


Most traders learn about Break of Structure and Change of Character early in their price action journey, yet a subtler signal often precedes both. That signal is the Change in State of Delivery, commonly abbreviated as CISD.
Understanding the CISD meaning in trading gives you a practical edge: you can identify the precise moment when the market transitions from delivering price to one side of liquidity to the other, well before the broader crowd reacts.
This article breaks down CISD as it applies within Smart Money Concepts (SMC), explains how it differs from related signals, and walks through a step-by-step process for identifying it on live charts.
Every section is built around real market logic rather than indicator overlays, so you can apply these ideas directly to instruments such as forex pairs, gold, and indices.

- CISD is not a pattern. It is a state transition in how price is being delivered.
- It marks the inflection point where the delivery algorithm shifts its objective from one liquidity pool to the other.
- Unlike structural labels such as BOS or CHoCH, CISD describes what the market is doing at the present, not what has already been confirmed.
Understanding CISD in Trading
Before diving into chart mechanics, it is worth grounding the concept. This section covers what CISD actually means, how the bullish and bearish versions differ, and why this signal tends to appear before a full structural shift.
CISD Meaning in Trading Explained Clearly
In the context of price delivery, the market is always in one of two states: it is either delivering price to the buy side (moving higher, seeking buy-side liquidity) or delivering price to the sell side (moving lower, seeking sell-side liquidity). A CISD occurs when that directional delivery flips.
The mechanism is straightforward. During a sell-side delivery, price is creating lower lows and lower highs, sweeping through resting buy orders beneath old lows.
A CISD prints when a single candle, or a tight cluster of candles, closes above the most recent short-term high with enough conviction to suggest that institutional order flow has shifted. The market is no longer interested in delivering sell-side liquidity; it has transitioned to buy-side delivery.
Bullish vs Bearish CISD: Key Differences
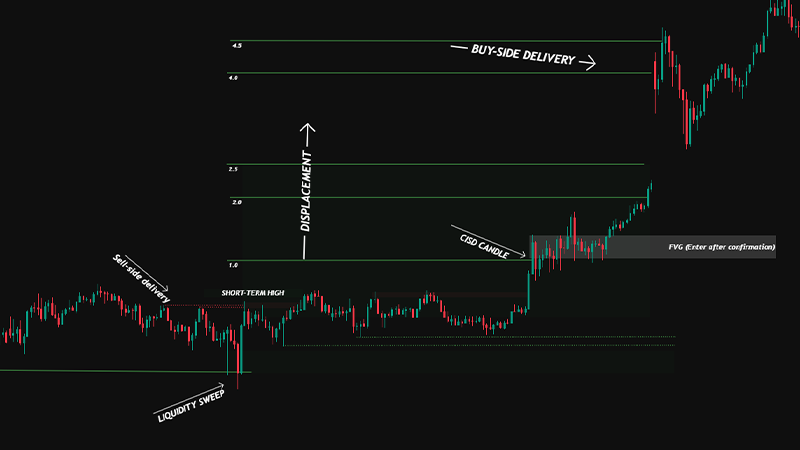
A bullish CISD appears at the end of a sell-side delivery leg. Price sweeps a low, then closes through a short-term high with displacement.
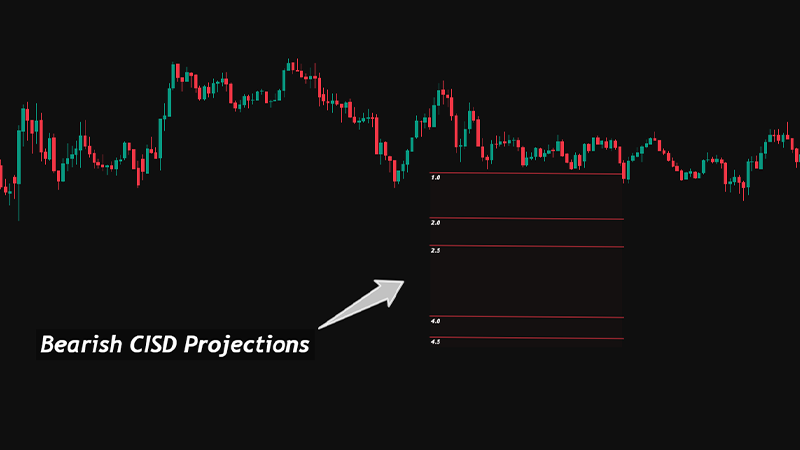
Conversely, a bearish CISD appears after a buy-side delivery run. Price takes out a high, then aggressively closes below a short-term low, signalling that delivery has shifted to the sell side.
| Bullish CISD | Bearish CISD |
|---|---|
| Occurs after sell-side delivery (down move) | Occurs after buy-side delivery (up move) |
| Price closes above a short-term high | Price closes below a short-term low |
| Displacement candle(s) show strong bullish momentum | Displacement candle(s) show strong bearish momentum |
| Often follows a liquidity sweep below a key low | Often follows a liquidity sweep above a key high |
| Suggests institutional buying has begun | Suggests institutional selling has begun |
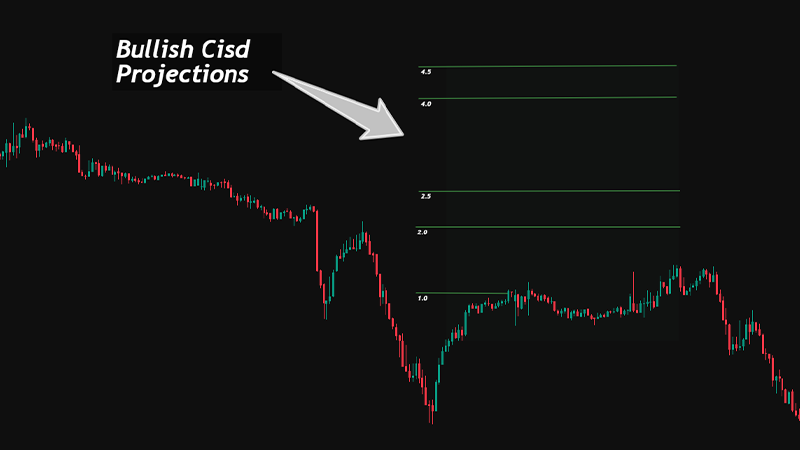
Bullish CISD
Bearish CISD
Why CISD Matters Before a Market Structure Shift
A Market Structure Shift (MSS) or Break of Structure (BOS) is typically confirmed when price takes out a significant swing point. CISD, by contrast, fires earlier because it only requires price to close through a minor, short-term level with displacement.
This makes CISD a leading signal: it tells you that the conditions for a structural shift are forming, even if the full break has not yet materialised.
For traders looking to position ahead of the crowd, this distinction is critical. Waiting for a confirmed BOS often means entering after a significant portion of the move has already unfolded.
Recognising the CISD gives you a higher-probability zone to begin looking for entries, provided you pair it with the right confluence factors.
Q: What does CISD mean in trading?
A: CISD stands for Change in State of Delivery. It describes the moment when the market transitions from delivering price to one side of liquidity (buy-side or sell-side) to the other. It is an early signal of potential reversal or retracement, commonly used within Smart Money Concepts.
CISD vs Market Structure and Momentum
CISD sits within a broader ecosystem of price action signals. This section clarifies how it relates to CHoCH, Break of Structure, and displacement so you can use the right label at the right time.
Difference Between CISD and Change of Character (CHoCH)
Traders frequently conflate CISD with CHoCH, and on the surface they can look similar. Both involve price closing through a prior swing point in the opposite direction. The distinction lies in what each concept describes.
CHoCH is a market-structure label. It marks the first break of a swing high in a downtrend (or swing low in an uptrend), suggesting the prevailing trend may be reversing. CISD is a delivery-state label. It marks the transition in how price is being delivered, irrespective of whether a full trend reversal follows.
In practice, a CISD can occur without producing a CHoCH. For example, price may shift from sell-side delivery to buy-side delivery just long enough to fill an imbalance, then resume its original direction.
The delivery changed, but the broader structure did not. This is why CISD is a more granular tool and why it should be used alongside structural analysis rather than as a replacement.
For a broader overview of how market structure works across asset classes, see Investopedia’s explanation of market structure.
How CISD Signals Come Before a Full Break of Structure
In a typical bearish-to-bullish reversal sequence, the order of events often looks like this: price delivers to the sell side, sweeps a significant low (stop hunt or liquidity grab), prints a displacement candle that closes above a short-term high (CISD), then continues higher to break a major swing high (BOS/MSS).
The CISD sits between the liquidity sweep and the structural break. It is the first mechanical confirmation that institutional participants have stepped in and that the delivery algorithm is transitioning.
If you wait for the BOS, you may sacrifice two or three candles of movement. If you act on the CISD with proper confluence, you can enter closer to the origin of the move.
The Role of Displacement in Confirming Delivery Change
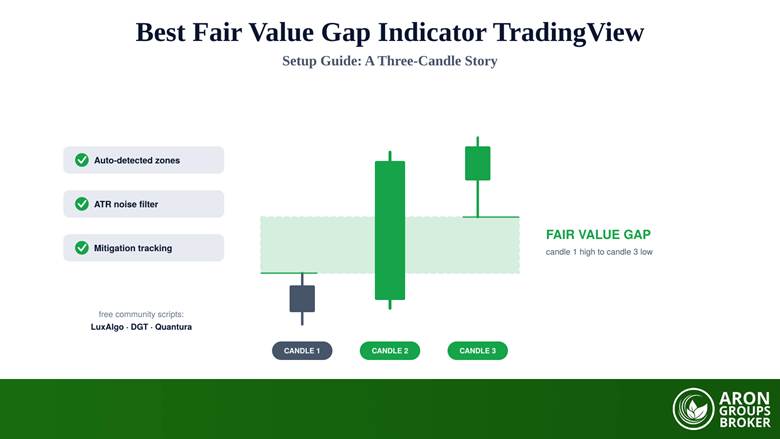
Not every candle that closes through a short-term level qualifies as a CISD. The candle or candle cluster must exhibit displacement: strong, directional momentum that leaves behind a Fair Value Gap (FVG) or visible imbalance.
Displacement is the footprint of aggressive institutional order flow. Without it, the close through the level may simply be noise or a weak reaction that is likely to fail.

Practical filter
If the candle that closes through the short-term high or low does not leave a visible gap
or imbalance on the chart, treat it with caution. Valid CISD candles tend to have full-bodied closings with minimal wicks on the side of the delivery shift.
Q: How is CISD different from CHoCH?
A: CHoCH (Change of Character) is a market-structure label that identifies the first break of a significant swing point. CISD is a delivery-state label that identifies when the directional flow of price shifts. A CISD can occur without a CHoCH following, making it a more granular and earlier signal.
Liquidity and Order Flow Context for CISD
CISD does not occur in a vacuum. Liquidity pools, stop hunts, and the overall order flow environment set the stage for a valid delivery change. This section explains the relationship between these elements.
Buy-Side and Sell-Side Delivery in Practice
The terms buy-side delivery and sell-side delivery describe the direction in which price is being offered. When price is moving higher, it is delivering to buy-side liquidity: resting sell limit orders, stop losses above highs, and pools of pending orders sitting above old swing highs.
When price moves lower, it delivers to sell-side liquidity in the same fashion, targeting resting buy orders and stops beneath lows.
Understanding which side the market is currently delivering to allows you to anticipate where it is likely headed.
For a detailed primer on how liquidity operates across financial markets, see the Bank for International Settlements’ overview of market liquidity.
Once the delivery state changes (CISD), you know the algorithm has exhausted its interest in the prior side and is now pursuing the opposite pool of liquidity.
How Liquidity Sweeps Reveal Potential CISD
A liquidity sweep, sometimes called a stop hunt, occurs when price dips below a key low or spikes above a key high to trigger clustered stop-loss orders. This event is significant because it represents the final act of the current delivery state. The market has reached its target pool of orders and consumed them.
What follows the sweep is where the CISD becomes relevant. If price immediately displaces in the opposite direction after the sweep, closing through a short-term level, that is a strong indication that the delivery state has flipped.
The combination of sweep plus displacement plus close through a short-term level forms the classic CISD setup that many Smart Money Concepts traders rely on.
When Stop Hunts Can Mislead Traders
Not every liquidity sweep leads to a genuine CISD. In trending markets, price can sweep a minor low and bounce momentarily before continuing in the original direction. This is a common trap, and it is one reason why displacement matters so much.
False CISD Signals
Not every displacement candle represents a real delivery shift.
Be cautious when:
- The candle closes with a large wick
- No liquidity sweep occurs before the move
- The signal appears in a sideways range
- The displacement does not create a visible imbalance
These situations often lead to failed CISD signals and quick reversals.
If the candle following the sweep does not show clear displacement, or if it closes weakly (large wick, small body), the odds of a true delivery change are lower.
Traders should also check whether the sweep targeted a significant pool of liquidity or merely a minor, isolated low. Sweeps into well-defined equal lows or swing lows with visible order clusters are far more reliable precursors to a CISD than sweeps of random intraday levels.
Q: Does every liquidity sweep lead to a CISD?
A: No. A sweep only sets the stage. For a valid CISD, price must displace in the opposite direction with a strong-bodied candle that closes through a short-term level. Without that displacement, the sweep may simply be part of the ongoing delivery rather than a transition.
Step-by-Step Guide to Identifying CISD on Charts
Theory is useful, but application is what matters. This section provides a practical walkthrough of the signals, candle characteristics, and timeframe considerations that help you identify a CISD in real time.
Early Signals to Watch for a Valid CISD
Before a CISD prints, several early signals tend to appear. The current delivery leg may start to show signs of exhaustion: candles becoming smaller, wicks appearing on the delivery side, and price stalling near a key liquidity level.
While none of these signals confirm a CISD on their own, together they create context that a transition is approaching.
Checklist: Is This a Valid CISD?
Before treating a candle as a CISD, verify the following conditions:
- A clear delivery leg exists (price trending toward liquidity)
- A liquidity sweep occurs above a high or below a low
- A displacement candle appears immediately after the sweep
- The candle closes beyond a short-term high or low
- The candle body is strong with minimal opposing wick
- A Fair Value Gap or imbalance is visible
If at least four conditions are present, the CISD signal becomes significantly more reliable.
Experienced traders also monitor the higher timeframe narrative. If the higher timeframe is bullish and price is currently in a lower-timeframe sell-side delivery (a retracement), the probability of a bullish CISD increases.
Aligning the delivery-state analysis with the broader directional bias filters out many false signals.
Candlestick Behaviour and Imbalance During Delivery Change
The candle that marks the CISD typically has several characteristics. Its body is large relative to the preceding candles. It closes firmly through the short-term level (not just wicks through it).
It often leaves behind an FVG: a gap between the high of the candle two bars back and the low of the CISD candle (in a bullish scenario).
This FVG is important for two reasons. First, it confirms displacement and therefore validates the CISD. Second, it provides a potential re-entry zone.
After the initial displacement, price frequently retraces into the FVG before continuing in the new delivery direction. This retracement into the gap is one of the highest-probability entry models in SMC trading.
Timeframe Alignment and Chart Positioning for Accurate Identification
CISD is time-sensitive. A CISD on the 1-minute chart carries less weight than one on the 15-minute or 1-hour chart, simply because lower timeframes are noisier and more prone to false signals.
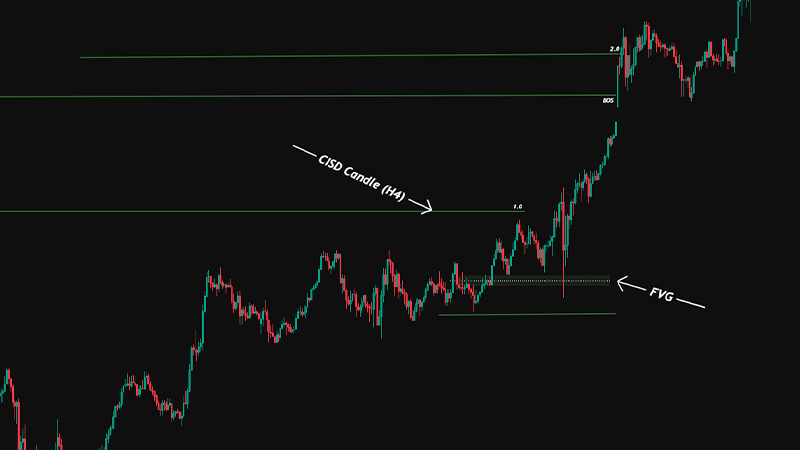
As a general guideline, identify the delivery direction on a higher timeframe (4H or daily), then drop down to a lower timeframe (5m to 15m) to spot the actual CISD.
Positioning on the chart also matters. A CISD that forms inside a higher-timeframe Order Block or at a significant premium/discount level carries more confluence than one that forms in the middle of a range with no clear reference point.
Always ask: does this CISD align with where I would expect institutional activity?
Q: Which timeframe is best for identifying CISD?
A: Most traders find the 5-minute to 15-minute chart ideal for spotting CISD, provided the directional bias has been established on a higher timeframe such as the 4-hour or daily. Lower timeframes (1-minute) can produce too many false signals in isolation.
Integrating CISD with Smart Money Concepts (SMC)
CISD becomes most powerful when it is layered with other SMC tools. This section covers how Order Blocks, Fair Value Gaps, and a simple confluence model turn CISD from a standalone observation into an actionable trade setup.
CISD and Order Blocks (OB): Practical Interaction
An Order Block is a zone where institutional participants are believed to have placed significant orders. When price returns to an OB during a retracement, a CISD forming within that zone is a strong signal.
It tells you that the OB is being respected and that delivery is shifting in the anticipated direction.
In practical terms, you might mark a bullish OB on the 1-hour chart, wait for the price to retrace into it, then switch to the 5- or 15-minute chart and look for a bullish CISD.
If you see displacement, an FVG, and a close above a short-term high within the OB, you have a high-confluence entry.
Fair Value Gaps (FVG) During Delivery Transition
FVGs and CISD are closely linked. The displacement that confirms a CISD almost always creates a Fair Value Gap. This gap represents inefficient price delivery: an area where only one side of the market was active.
Price tends to revisit these gaps to rebalance, which makes them natural targets for limit entries.
After a bullish CISD, for example, you might place a buy limit at the 50% level of the resulting FVG, with a stop below the low of the CISD candle.
This approach gives you a defined-risk entry that is rooted in the mechanics of delivery change rather than in arbitrary support-and-resistance levels.
Building Confluence Without Overcomplicating the Trading Model
One of the risks with SMC trading is overcomplication. Traders stack so many confluences that they either never take a trade or freeze under analysis paralysis.
A practical model keeps it to three or four elements: higher-timeframe directional bias, a significant point of interest (OB or premium/discount level), a CISD on the entry timeframe, and an FVG for precise entry.
If all four align, you have a trade. If one or more are absent, you wait. This framework respects the complexity of the market while keeping execution simple and repeatable.
For a deeper look at how invalidated Order Blocks become tradeable zones, read our guide to Breaker Blocks in price action.
Model summary
- Identify HTF bias (4H/Daily)
- Mark point of interest (OB, liquidity level)
- Wait for CISD on LTF (5m/15m)
- Enter on FVG retracement with stop below CISD candle low/high
Q: Can CISD be used as a standalone entry signal?
A: It is not recommended. CISD is most effective when combined with additional confluence such as a higher-timeframe Order Block, a liquidity sweep, and a resulting Fair Value Gap. Used alone, it can produce false positives, particularly in choppy or ranging conditions.
Conclusion
The Change in State of Delivery is one of the more nuanced tools in the Smart Money Concepts framework, but it is also one of the most practical.
By learning to identify the precise moment when delivery shifts, you position yourself ahead of the traders who wait for confirmed structural breaks. The key is discipline: valid CISD requires displacement, alignment with a higher-timeframe bias, and, ideally, a preceding liquidity sweep.
Apply this concept methodically, pair it with Order Blocks and Fair Value Gaps, and keep your model simple.
Over time, recognising CISD will become second nature, giving you the confidence to act early when the market transitions and the patience to stand aside when the conditions are not met.