Price on a forex chart can appear chaotic, yet certain moves repeat with striking regularity. Liquidity above yesterday’s high gets swept before a reversal. A fair value gap left behind a fast impulse attracts price back days later. These patterns form the backbone of a concept Michael J. Huddleston (ICT) calls the Interbank Price Delivery Algorithm, or IPDA.
IPDA proposes that price delivery in global currency markets follows a structured set of rules rather than moving randomly. Those rules revolve around two objectives: collecting liquidity where stop orders cluster and rebalancing imbalances where price moved too fast for efficient order matching. The framework uses 20-day, 40-day, and 60-day look-back periods to identify the ranges from which the next liquidity targets and imbalance zones are drawn.
This article explains each component of the IPDA framework, from the theoretical foundation through to the data ranges, seasonal shifts, and practical execution model that ICT traders use to build directional bias and time their entries.
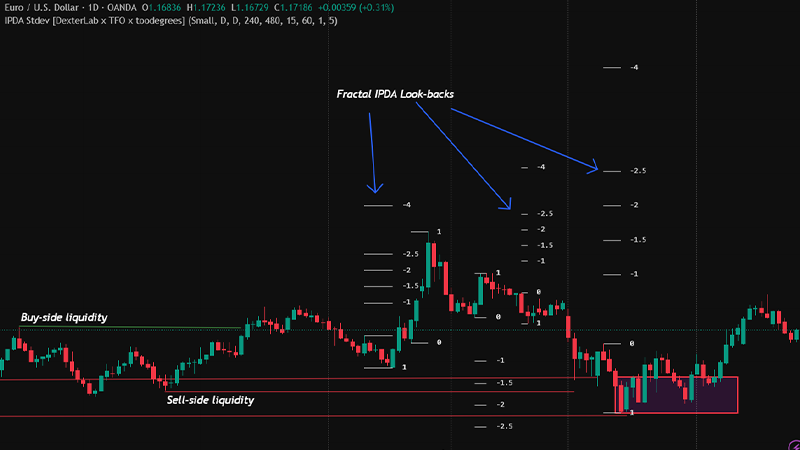
IPDA stands for Interbank Price Delivery Algorithm, a theoretical model within ICT methodology explaining how price is delivered systematically.
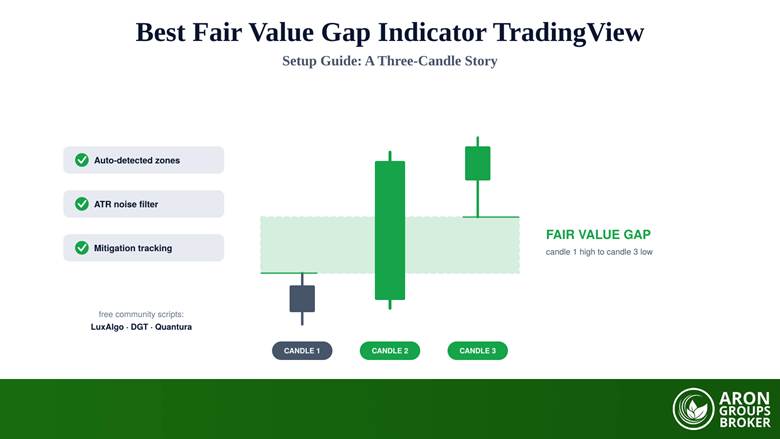
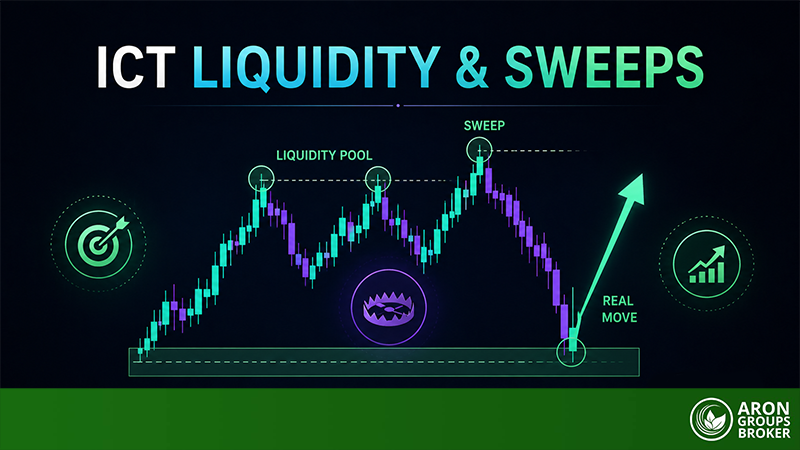
Price moves for two reasons under IPDA logic: to hunt liquidity at old highs and lows, or to rebalance imbalances such as fair value gaps.
The framework uses three look-back periods (20, 40, and 60 days) to define ranges whose highs and lows serve as institutional reference points.
IPDA seasonal shifts occur roughly every quarter, resetting the algorithm's directional bias for the next cycle.
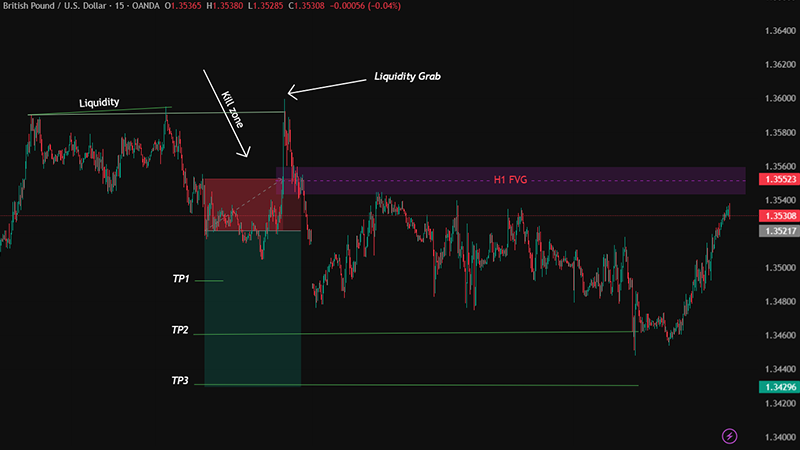
Execution within IPDA relies on combining data-range analysis with PD arrays, kill zones, and market structure shifts on lower timeframes.
IPDA is interpretive, not mechanical. It provides a reading framework rather than automated signals.
What Is the Interbank Price Delivery Algorithm?
IPDA is a conceptual model developed within ICT (Inner Circle Trader) methodology. It describes the idea that price in financial markets is not driven by simple supply-and-demand randomness but is instead delivered according to a structured logic that serves institutional participants. Under this model, an algorithm, broadly defined as a set of rules governing order execution, manages where price travels next by targeting two categories of destination: liquidity pools and price imbalances.
Risk Disclosure
CFDs are complex instruments and come with a high risk of losing money rapidly due to leverage. You should consider whether you understand how CFDs work and whether you can afford to take the high risk of losing your money. Past performance is not indicative of future results. This content is provided for educational purposes only and does not constitute investment advice.
The Two Drivers of Price Movement
According to IPDA logic, every significant price move serves one of two purposes. The first is liquidity collection. Stop-loss orders cluster above old highs (buy-side liquidity) and below old lows (sell-side liquidity). The algorithm drives price into these pools to trigger those resting orders, generating the volume institutional participants need to fill large positions.
The second driver is imbalance correction. When price moves aggressively in one direction, it leaves behind zones where no efficient two-sided trading occurred. In ICT terminology, these are fair value gaps (FVGs), further subdivided into sell-side imbalance and buy-side inefficiency (SIBI) zones and buy-side imbalance and sell-side inefficiency (BISI) zones. The algorithm returns price to these areas to restore balanced delivery.
IPDA as a Reading Framework, Not a Signal System
It is important to treat IPDA as a lens for interpreting price behaviour rather than a mechanical trading system. The model does not tell a trader exactly when to enter or exit. Instead, it helps identify the most probable destination for price, whether that destination is a liquidity pool above a prior swing high or an unfilled imbalance several sessions back. Execution still requires confirmation through tools such as market structure shifts, displacement, and kill zone timing.
Read More: What Is Liquidity in ICT? Buy-Side, Sell-Side and Liquidity Sweeps
IPDA Data Ranges: The 20, 40, and 60-Day Look-Back
The operational core of the IPDA model is the data range. Starting from the current trading day, the algorithm looks back across three consecutive 20-day windows. Each window defines a range whose high and low become critical reference levels for liquidity and imbalance analysis.
How the Three Ranges Are Defined
The most recent 20 trading days form the first range. The preceding 20 days (days 21 through 40) form the second. The earliest window (days 41 through 60) forms the third. In each range, the highest price and the lowest price represent potential liquidity targets, because stop orders and pending orders tend to accumulate around visible swing extremes.
When price takes out the high or low of the 20-day range, ICT traders watch for a reaction. The next probable target becomes a level within the 40-day or 60-day range, or an imbalance that sits between the current price and that target. This cascading structure gives traders a hierarchy of draw-on-liquidity levels from short-term to medium-term.
Applying IPDA Data Ranges on the Daily Chart
The practical workflow begins on the daily timeframe. Mark the high and low of the most recent 20 trading sessions. Do the same for the 40-day and 60-day windows. These six levels (three highs, three lows) establish the algorithm’s operating field. Price that breaks above the 20-day high, for instance, may be seeking the 40-day high next, or it may reverse if the break was a liquidity sweep rather than a genuine expansion.
Liquidity and Imbalance Within the IPDA Framework
IPDA treats liquidity and imbalance as complementary forces. Liquidity provides the fuel for price movement; imbalance provides the destination or the mechanism through which the movement is rebalanced. Understanding both is necessary before applying the model to live charts.
Buy-Side and Sell-Side Liquidity in IPDA
Buy-side liquidity consists of resting buy stop orders above prior swing highs. When price trades above those highs, the stops are triggered, converting into market buy orders that generate volume. Sell-side liquidity sits below prior swing lows in the form of sell stop orders. The IPDA model proposes that the algorithm deliberately drives price into these pools before reversing, a behaviour commonly observed as a stop hunt or false breakout.
Within the data ranges, the 20-day, 40-day, and 60-day highs and lows represent layered liquidity targets. A sweep of the nearest level may satisfy the algorithm’s short-term objective, or it may be the first step toward a deeper sweep of a more distant level.
SIBI and BISI: Imbalance Zones on the Chart
When bearish momentum creates a gap where price dropped so quickly that no efficient buying occurred, the zone is classified as a sell-side imbalance and buy-side inefficiency (SIBI). The market may later rally into this zone to allow the buy side to participate at fair prices. Conversely, a bullish impulse that leaves behind a zone of insufficient selling creates a buy-side imbalance and sell-side inefficiency (BISI). Price may later retrace into this zone to let sellers fill orders.
These imbalance zones often correspond to fair value gaps on the chart: a three-candle formation where the wicks of the first and third candles do not overlap, leaving an unfilled gap in the middle candle’s range. Identifying SIBI and BISI zones within the active IPDA data range narrows the field of relevant imbalances to those most likely to attract price.
Read More: Fair Value Gap Trading Strategy Explained
Q: How does IPDA differ from standard supply-and-demand analysis?
A: Standard supply-and-demand analysis identifies zones where buying or selling pressure previously dominated, then expects price to react at those zones again. IPDA adds a directional hypothesis: price is not just reacting to old zones but is being actively delivered toward specific liquidity targets and imbalance areas in a structured sequence. The 20/40/60-day data ranges and the two-driver model (liquidity plus imbalance) give IPDA a time-based dimension that conventional supply-and-demand analysis typically lacks.
IPDA Seasonal Shifts and Quarterly Cycles
Beyond the 20/40/60-day micro-structure, the IPDA model includes a macro-level concept: seasonal shifts. These shifts describe a change in the algorithm’s directional tendency that occurs roughly every three to four months, aligning with calendar quarters.
What Triggers a Seasonal Shift
A seasonal shift typically materialises after the algorithm has completed a full cycle of liquidity collection and imbalance rebalancing across the 60-day look-back. At that point, the directional bias resets. A pair that spent the prior quarter trending higher may begin seeking sell-side liquidity as the new quarter opens. ICT traders watch for this transition around the start of January, April, July, and October, though the exact timing can vary by several weeks.
Using Seasonal Context for Directional Bias
Seasonal shifts are not trade signals. They provide a macro filter. If a seasonal shift suggests a bearish quarter, the trader prioritises short setups that align with sell-side liquidity draws. Conversely, a bullish seasonal shift favours long setups targeting buy-side liquidity. Combining this quarterly bias with the granular 20-day data range analysis produces a top-down framework: the seasonal shift sets the compass direction, and the data ranges identify the nearest waypoints along the route.
Read More: What Is a Market Cycle in Trading?
Executing Trades Within the IPDA Model
IPDA provides the map. Execution requires zooming into lower timeframes and applying a sequence of confirmation steps before committing capital. The workflow below integrates IPDA analysis with ICT execution tools.
Establishing Daily and Weekly Bias
Start on the daily chart. Identify which IPDA data-range levels have been taken and which remain untouched. If the 20-day low was recently swept and price is now rallying, the bias shifts bullish, and the next draw on liquidity is likely the 20-day or 40-day high. If the 20-day high was swept and price is reversing, the bias shifts bearish. Confirm the bias by checking whether the most recent displacement aligns with the proposed direction.
Dropping to the Intraday Chart
Once the daily bias is set, move to the 15-minute or 5-minute chart during an ICT kill zone (London open, New York morning, or New York afternoon). Look for a market structure shift: a break of a recent swing high or low that confirms the algorithm is now delivering price in the biased direction. After the shift, identify a fair value gap or order block created by the displacement move. That zone becomes the entry area.
Mini Example: GBPUSD Short Setup Using IPDA
- On the daily chart, the 20-day high at 1.2740 is swept on Monday. Price closes back below the level, suggesting a liquidity grab rather than a genuine breakout.
- The next untouched draw on liquidity is the 40-day low at 1.2580. A bearish daily bias is established.
- On Tuesday during the New York morning kill zone, the 15-minute chart prints a bearish market structure shift with strong displacement.
- A SIBI (fair value gap) forms between 1.2710 and 1.2720 during the displacement leg.
- A limit sell order is placed at 1.2715 (midpoint of the FVG) with a stop above the sweep high at 1.2745. The target is the 40-day low at 1.2580.
IPDA vs Conventional Technical Analysis
Traders accustomed to indicator-based analysis often wonder how IPDA relates to the tools they already use. The following comparison highlights the structural differences.
| IPDA / ICT Framework | Conventional Technical Analysis |
|---|---|
| Price moves to collect liquidity and rebalance imbalances | Price reacts to support, resistance, and indicator signals |
| Uses 20/40/60-day data ranges for target identification | Uses static S/R levels, trend lines, and moving averages |
| Incorporates time-based filters (kill zones, macro times) | Primarily price-based; time is secondary |
| Seasonal quarterly shifts inform macro directional bias | Trend analysis via MAs or ADX without quarterly framing |
| Entry via PD arrays (FVG, OB) after market structure shift | Entry via indicator crossovers, pattern breakouts, or S/R bounces |
| Interpretive framework requiring discretionary skill | Can be systematic and rule-based with coded indicators |
Limitations and Critical Perspective
IPDA offers a compelling narrative for understanding institutional price behaviour, but it is important to approach it with the same rigour applied to any trading methodology.
The Algorithm Is a Model, Not a Verified Mechanism
No public documentation from interbank market participants confirms the existence of a single price delivery algorithm operating as ICT describes it. IPDA is best understood as a heuristic model: a mental framework that helps traders organise price action around liquidity and imbalance concepts. The patterns it identifies are observable and often tradeable, but attributing them to a specific algorithm requires a leap of faith that not all market participants are willing to make.
Confirmation Bias and Curve Fitting
Because IPDA uses three overlapping data ranges and multiple imbalance types, almost any price move can be retroactively explained within the framework. This makes the model susceptible to confirmation bias. The antidote is forward testing: define the bias and the target before the session opens, then evaluate whether the framework produces a statistical edge over a meaningful sample of trades.
Q: Is IPDA suitable for beginners? A: IPDA is an advanced concept that assumes familiarity with ICT building blocks such as fair value gaps, order blocks, market structure shifts, and kill zones. Beginners benefit from mastering those individual components first. Once the foundational tools are internalised, IPDA provides the macro context that ties them together into a coherent top-down analysis. |
Read More: What Is PD Array in ICT Trading?
Conclusion
The Interbank Price Delivery Algorithm offers ICT traders a structured way to interpret why price moves to specific levels and when directional bias is likely to shift. By mapping the 20-day, 40-day, and 60-day data ranges, identifying untouched liquidity targets, and locating imbalance zones within those ranges, traders can build a clear hypothesis for each trading week and session.
Execution still depends on lower-timeframe confirmation: a market structure shift, a displacement move, and a defined entry zone such as a fair value gap or order block. IPDA sets the destination; the trader’s job is to find the right vehicle and timing to get there. Practise the framework on historical charts, track results over a statistically meaningful sample, and refine the process before applying it with real capital.