icon icon Home
icon icon Accounts
icon icon Quick start
icon icon Symbols

What Is UTAD in Wyckoff? A Complete Guide to Upthrust After Distribution

Author
Abe Cofnas
Abe Cofnas
calendar Last update: 21 April 2026
watch Reading time: 12 min

Upthrust After Distribution (UTAD) in Wyckoff is the classic last squeeze above range resistance that lures breakout buyers in, then snaps back into the trading range and sets up weakness. But here’s the real question: when you see a false breakout above resistance, how do you know it’s a true Wyckoff distribution UTAD (late Phase C) and not just a normal breakout that will hold?

bookmark
Key Takeaways
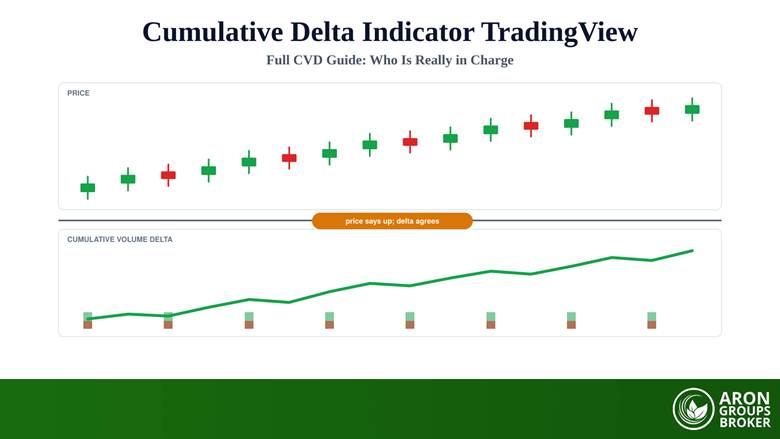
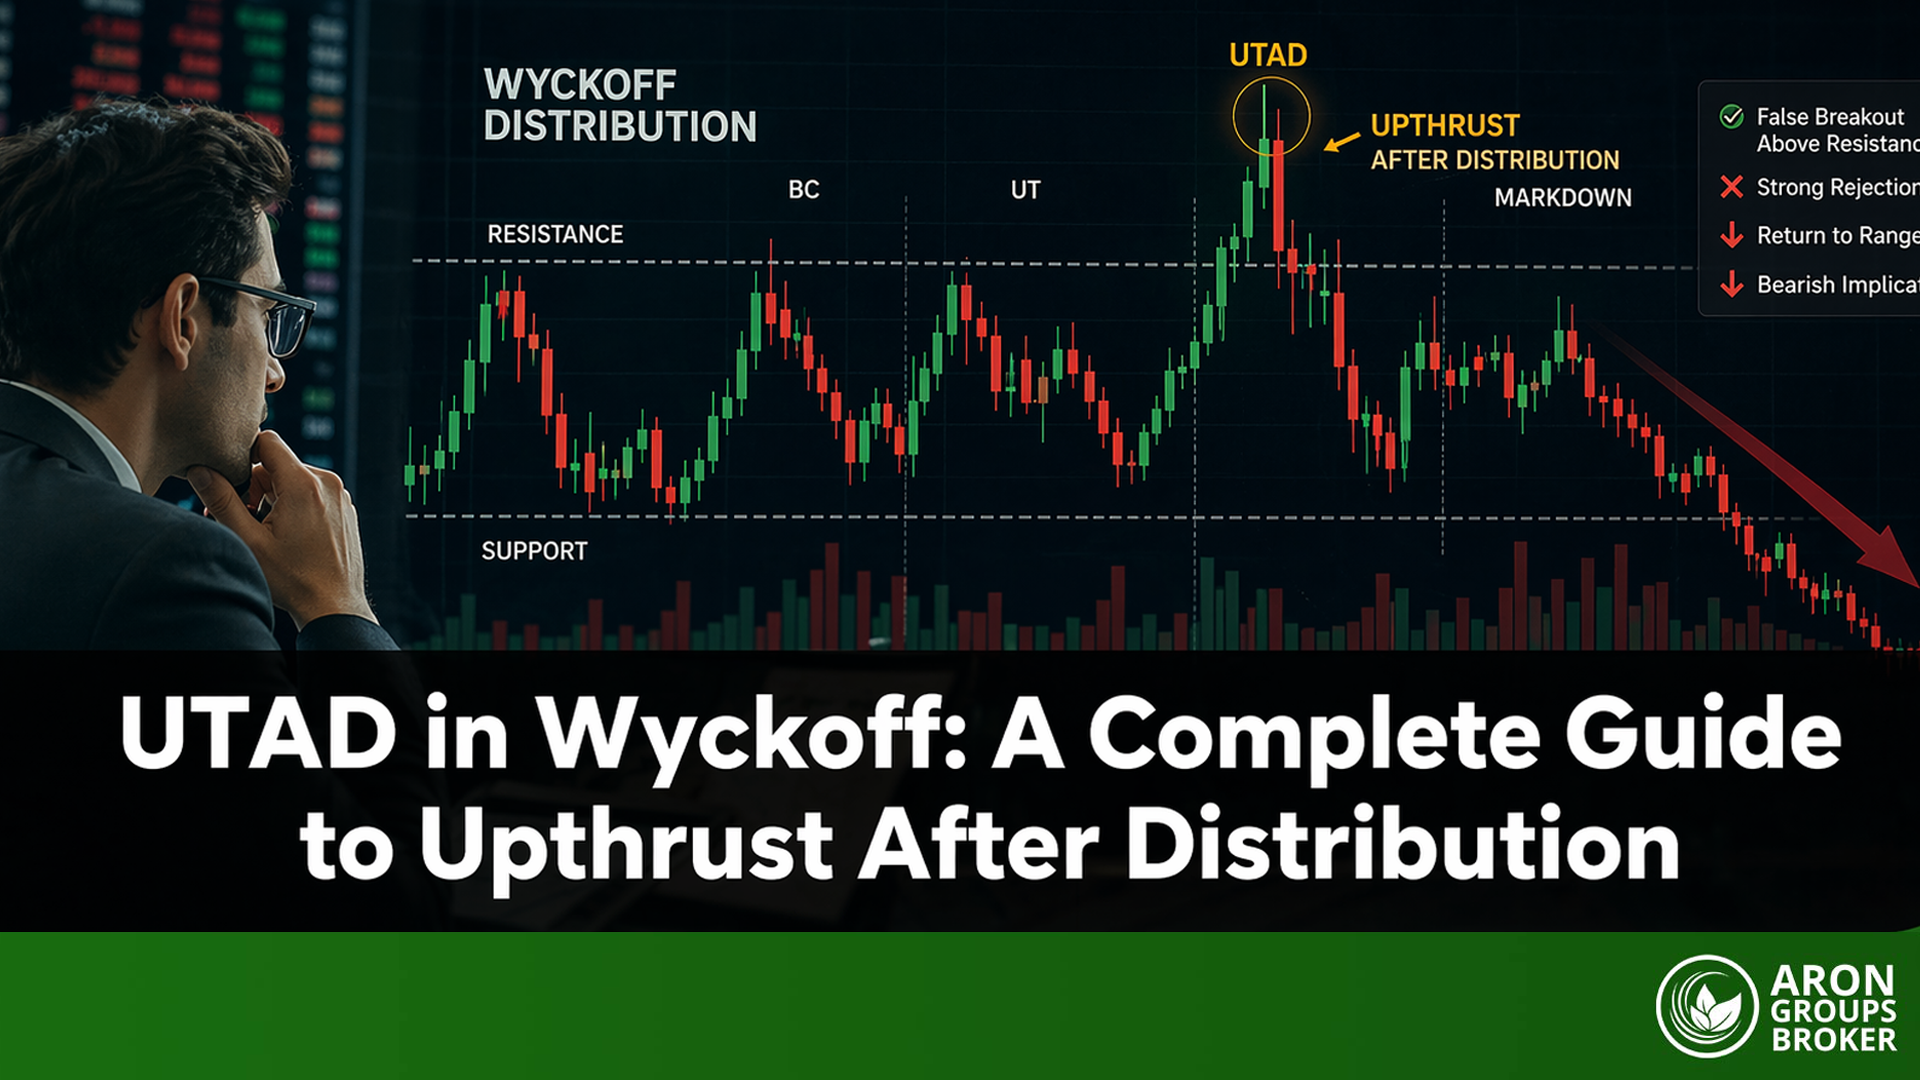
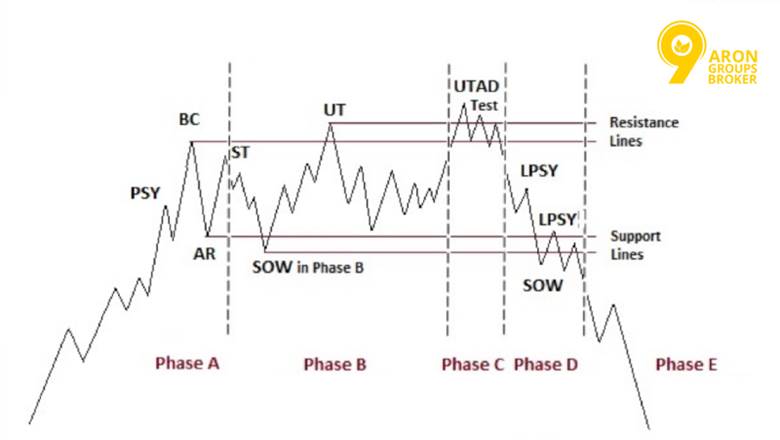
  • UTAD Wyckoff meaning: a false breakout above the trading range in a distribution structure that quickly reverses back into the range (a bull trap).
  • It typically appears in late Phase C of the Wyckoff Distribution and acts as a test of remaining demand.
  • The purpose is to trap breakout buyers and trigger buy stops above the range highs (a liquidity event / stop run).
  • The most important clue is rapid rejection back into the range (failed acceptance above resistance).
  • Confirmation often comes from a Sign of Weakness (SOW) after the upthrust, suggesting a transition toward markdown.
  • Key failure case: price holds above resistance and builds value (it wasn’t UTAD—think sustained breakout/reaccumulation instead).

What You Need to Know About UTAD in Wyckoff

If you’re asking what is UTAD in Wyckoff?, keep it anchored to structure. UTAD is not a standalone candle pattern. It is a late-stage event inside a distribution trading range that often precedes a bearish move.

Understanding the UTAD Concept in Wyckoff

According to Stockcharts, in Wyckoff Distribution, Phase C may show an Upthrust (UT) or UTAD. In both cases, price pushes above trading range resistance and then quickly reverses and closes back inside the range—a classic bull trap.

Understanding the UTAD Concept in Wyckoff

So, the clean definition is:

  • UTAD = false breakout above the range after distribution has already formed.
  • It tests remaining demand and wrong-foots breakout traders.

If you want a one-line mental model:
UTAD is the market borrowing liquidity from breakout buyers to finish distribution at high prices.

Key Features of Upthrust After Distribution

A real Upthrust After Distribution Wyckoff event usually has these features (not all need to be perfect, but most should be present):

  • Late Phase C context: distribution range already exists.
  • Stop run above highs: price hunts above range resistance to trigger buy stops and breakout entries.
  • Rapid rejection: price falls back into the range quickly (failed acceptance above resistance).
  • Climactic behaviour: volume/volatility can spike around the upthrust in Phase C.
  • Confirmation after UTAD: a Sign of Weakness (SOW) typically follows, showing supply is in control.
sms-star

Remember: If price can’t stay above resistance, treat the breakout as a question mark, not a victory.

How UTAD Influences Market Cycles

TrendSpider explains that Wyckoff is a cycle story: accumulation → markup → distribution → markdown. UTAD tends to show up near the end of distribution and often signals the market is preparing to transition toward markdown.

What UTAD changes for your bias:

  • Before UTAD, the range can look neutral.
  • After UTAD + SOW, the range often stops behaving like consolidation and starts behaving like distribution, resolving lower.

But stay honest about the failure case:

  • If price breaks above resistance and holds (acceptance + building), you may be looking at strength, not UTAD.

Spotting the UTAD Pattern in Charts

Spotting UTAD is mostly about sequencing. You’re looking for a late-stage distribution range, then a deceptive breakout, then proof of weakness.

Recognising Structural Signs of UTAD in Distribution

Use this structure-first approach:

  • Confirm a distribution range exists
    You should see a clear resistance band and repeated failure to trend higher (range formation).
  • Locate the late-stage test (Phase C)
    Wyckoff sources describe Phase C in distribution as where UT/UTAD can appear as a test of remaining demand.
  • Mark the UTAD event
    Price pops above range resistance (stop run), then closes back inside.
  • Wait for confirmation: SOW
    After UTAD, look for a clear downside push (Sign of Weakness). StockCharts’ Wyckoff case studies explicitly discuss UTAD in Phase C and subsequent weakness.
Recognising Structural Signs of UTAD in Distribution
sms-star

Important note: UTAD without post-event weakness is often just volatility.

UTAD vs Upthrust (UT): Key Differences for Traders

Both UT and UTAD are deceptive pushes above resistance, but UTAD is typically framed as the more dramatic, late-stage trap that often precedes breakdown.

A practical distinction:

PatternWhere it appearsWhat it tends to mean
UT (Upthrust)Can appear as an upthrust test during distribution developmentA warning, but not always the last trap
UTAD (Upthrust After Distribution)Late distribution (Phase C final test)Often, the final bull trap before weakness/markdown
sms-star

Tip: UT is a warning. UTAD is a warning with teeth—but only after the market proves it with weakness.

Identifying the Distribution Top Pattern Accurately

Most false positives happen when traders label any false breakout as UTAD. Here’s a cleaner accuracy checklist:

  • Was there a real distribution range before the breakout?
  • Did the breakout fail quickly (rejection back inside the range)?
  • Was there climactic behaviour (volume/volatility) around the upthrust?
  • Did a Sign of Weakness (SOW) follow?
  • Did price fail to accept above the resistance? If it is accepted and built above, treat it as a different story (breakout/reaccumulation).
sms-star

Important note: If your range boundaries keep shifting to make the UTAD fit, you likely don’t have a Wyckoff range—just noise.

How UTAD Forms and Why It Happens

In Wyckoff, Upthrust After Distribution (UTAD) is not a random false breakout. It is a late-stage event inside a distribution trading range, most often described in Phase C. Price pushes above range resistance, then quickly falls back inside. That move helps trap breakout buyers and source liquidity for selling.

How UTAD Forms and Why It Happens

Liquidity Grabs Above Recent Highs in UTAD

A clean way to think about UTAD Wyckoff is liquidity first. UTAD runs above the range highs where:

  • Breakout buy orders sit.
  • Buy stops sit (short stops and late-buyer stops).
    That burst creates a stop run above the range and provides liquidity for distribution.

What you want to see on the chart:

  • The breakout looks convincing at first.
  • Then it fails fast (no acceptance).
  • Price returns to the range.
sms-star

Don’t forget: In UTAD, the breakout is not the signal. The failure is the signal.

Stop Runs Within the Trading Range During UTAD

UTAD usually does not appear out of nowhere. Distribution is a process. It often includes repeated tests and shakeouts inside the range before the final upthrust. StockCharts’ Wyckoff material describes how Phase C can show an upthrust-type event that tests demand, and how weakness often shows up after these tests.

Practical in-range behaviour that often sets the stage:

  • Rallies that struggle to hold gains.
  • Repeated probes of resistance without clean continuation.
  • Early signs of weakness that start to change character.
sms-star

Why it matters: it tells you the range is being used for distribution, not for building strength.

Buying Climax Context Leading to UTAD

Many distribution structures begin with a Buying Climax (BC) and an Automatic Reaction (AR) that start forming the range. UTAD is typically framed as a later event after that range has matured.

A clean sequence to keep in mind:

  • Uptrend exhausts → BC forms.
  • AR defines the lower boundary.
  • Range develops (tests, weaker rallies).
  • Late Phase C → UT / UTAD test above resistance.

Technical Signals and Confirmation of UTAD

UTAD is easiest to trade when you treat it as a sequence, not a candle. The two non-negotiables are (1) the false breakout and (2) proof of weakness after it.

Detecting False Breakouts Above Resistance

A UTAD is a false breakout above resistance that quickly reverses back into the trading range. That close back in the range behaviour is central in Wyckoff descriptions of UT/UTAD.

Read More: Candlestick Range Theory Explained

A practical detection checklist:

  • Breaks above the range resistance.
  • Fails to hold (no acceptance).
  • Closes back inside the range.
  • Often shows expanded spread/volatility, and sometimes climactic activity.

Bull Trap Mechanism in Distribution Tops Explained

The utad meaning in Wyckoff sources emphasises the wrong-footing effect. UTAD looks like the trend is resuming, which attracts breakout buyers. In reality, it often provides one last opportunity to sell into that demand (It has been noted by Wyckoff Analytics).

So the trap is simple:

  • Buyers buy the breakout.
  • Stops and breakout entries provide liquidity.
  • Price reverses, leaving late buyers trapped.

Signs of Weakness and Rapid Rejection After UTAD

Rapid rejection is the key tell, but Wyckoff confirmation usually looks for a Sign of Weakness (SOW) after the upthrust. StockCharts defines SOW as a downside move toward (or slightly past) the lower boundary of the range, often with increased spread and volume.

What confirmation often looks like:

  • UTAD fails, and price returns into the range.
  • A downside push develops (SOW).
  • Subsequent rallies weaken (lower quality demand).

Trading Strategies for UTAD in Wyckoff

A UTAD trade is not short because it is wicked. It is short after the market proves it cannot accept above the range.

Entering Short After Failed Acceptance of the Range

The core entry logic is: short after failed acceptance above resistance. That means you wait for price to break out, fail, and return into the range—then look for weakness. Wyckoff sources describe UT/UTAD as a move above resistance that quickly reverses and closes back in the trading range.

Two practical entry approaches:

  • Conservative: wait for the SOW to appear after UTAD, then look for a rally failure (often labelled as a last point of supply in Wyckoff work).
  • Earlier (higher risk): enter on the first clean return back inside the range, but only if the rejection is decisive.

Stop Placement and Risk Management During UTAD Trades

Risk Management is straightforward in concept: if price is accepted above the UTAD high, your UTAD idea is likely wrong.

Practical stop logic:

  • A common placement is beyond the UTAD extreme (above the false breakout high).
  • Keep the stop aligned with your entry plan (don’t hope through acceptance).

Failure case to respect:

  • Price breaks out and holds above resistance (sustained acceptance). That can turn into strength/reaccumulation rather than distribution.

Targeting Liquidity Below the Range in UTAD Context

Once UTAD is confirmed, the narrative shifts toward markdown. Wyckoff writing explicitly ties UTAD to subsequent weakness and markdown-style behaviour.

Practical targets are usually range-based:

  • First target: the range support / AR low area.
  • Next targets: liquidity below the range (prior lows, obvious support breaks) if markdown continues.
sms-star

Tip: In UTAD, targets are not random. They are the liquidity pools below the range.

Advanced UTAD Analysis and Insights

Once you can recognise a UTAD, the next step is reading it as part of the full Wyckoff story. UTAD is not a pattern that sells. It is a late distribution event that only matters if the surrounding phases support it.

Combining UTAD With Other Wyckoff Phases

A UTAD makes the most sense when the earlier distribution anatomy is visible.

A clean Wyckoff sequence to keep in mind:

  • Buying Climax (BC) and Automatic Reaction (AR) helps define the trading range.
  • Secondary Tests (ST) help confirm the boundaries.
  • Phase C can show a UT or UTAD as a final test of demand.

What the advanced read looks like:

  • UTAD appears after the range has matured.
  • Then you look for the Sign of Weakness (SOW). That is the real confirmation.
  • If weakness develops, you start thinking of markdown risk, not range trade.

Using Volume and Price Action to Confirm UTAD

Volume is not a magic filter. But it adds context. Many Wyckoff case studies highlight UTAD as a dramatic push to new highs that attracts buyers and can show strong spread/effort.

What you want to see (simple):

  • The breakout above resistance shows effort (wide spread/urgency).
  • The market then fails to hold above resistance (no acceptance).
  • Weakness follows (SOW or change of character).

Practical tip:

  • Don’t sell because volume is high.
  • Use volume to judge whether the breakout attempt was climactic and likely to trap late buyers.
sms-star

Important note: A high-volume breakout that holds can be strength. UTAD needs failure.

UTAD Meaning in Market Structure for Traders

In market-structure terms, UTAD is a false breakout above resistance in a distribution range. It is designed to look like a continuation, but it often shifts behaviour toward weakness.

Here is the trader-facing meaning:

  • UTAD warns that the market may be transitioning from distribution → markdown.
  • It also defines a clean line in the sand: acceptance above range highs vs failure and return.

A strong UTAD narrative has two parts:

  • Liquidity event above highs (stop run/bull trap)
  • Weakness confirmation afterwards (SOW)

Common Mistakes to Avoid in UTAD Trading

Most UTAD losses come from rushing the label. Or rushing the entry.

Confusing UTAD With Normal Upthrust Moves

Wyckoff material often mentions UT and UTAD together in Phase C. That is exactly why traders confuse them.

How to avoid the mix-up:

  • UT can appear as an upthrust test during distribution development.
  • UTAD is typically framed as the more dramatic final upthrust after distribution has matured.

Practical rule:

  • If you cannot describe the distribution range clearly, do not label UTAD.

Overreliance on Single Indicators in UTAD

UTAD is structural. It is not an RSI event.
If you trade UTAD because it is overbought, you will get faked out.

Better approach:

  • Use structure first (range + Phase C context).
  • Then use acceptance vs rejection above the resistance.
  • Then demand SOW confirmation.

Timing Mistakes: Entering Too Early or Too Late

Two common timing errors:

Too early:

  • You short the first wick above the resistance.
  • But price is still in the trap-building phase.
    You end up funding the UTAD.

Too late:

  • You wait so long that the markdown is already extended.
  • Your risk-to-reward collapses.

A cleaner timing logic:

  • Treat UTAD as the event.
  • Treat SOW as the confirmation.
  • Use the first weak rally after SOW (often discussed as Last Point of Supply (LPSY)) as a safer timing point.

Conclusion

UTAD in Wyckoff is a late distribution event—an upthrust above range resistance that fails, traps breakout buyers, and often precedes weakness and markdown. The trading edge is not the breakout candle. It is the sequence: false breakout → rapid rejection → Sign of Weakness. If price accepts above the resistance and holds, treat it as a different story. That failure case is what keeps UTAD trading honestly.

Continue Reading
not-found
calendar 21 April 2026
Rate this article
Plugin not installed

Leave a Reply

Your email address will not be published. Required fields are marked *

No thanks