


Mastering the Last Point of Supply (LPSY) is essential for any trader looking to navigate the final stages of a Wyckoff distribution phase. While many retail traders are lured into buying late-stage rallies, Wyckoff analysis teaches us that these moves are often the last gasp of a dying trend.
By identifying the LPSY, you gain a structural map that reveals when the composite operator has finished selling, and a major markdown phase is about to begin.

- The LPSY marks where the composite operator stops supporting the price, causing small rallies to hit a wall of supply and fail.
- A valid LPSY confirms a market shift by testing the old range floor and turning former support into a new price ceiling.
- The LPSY’s weak energy acts as a safety shield, helping traders distinguish this low-risk entry from a high-volatility, dangerous UTAD.
- While the Sign of Weakness shows the market is broken, the LPSY serves as the final launchpad before the markdown phase begins.
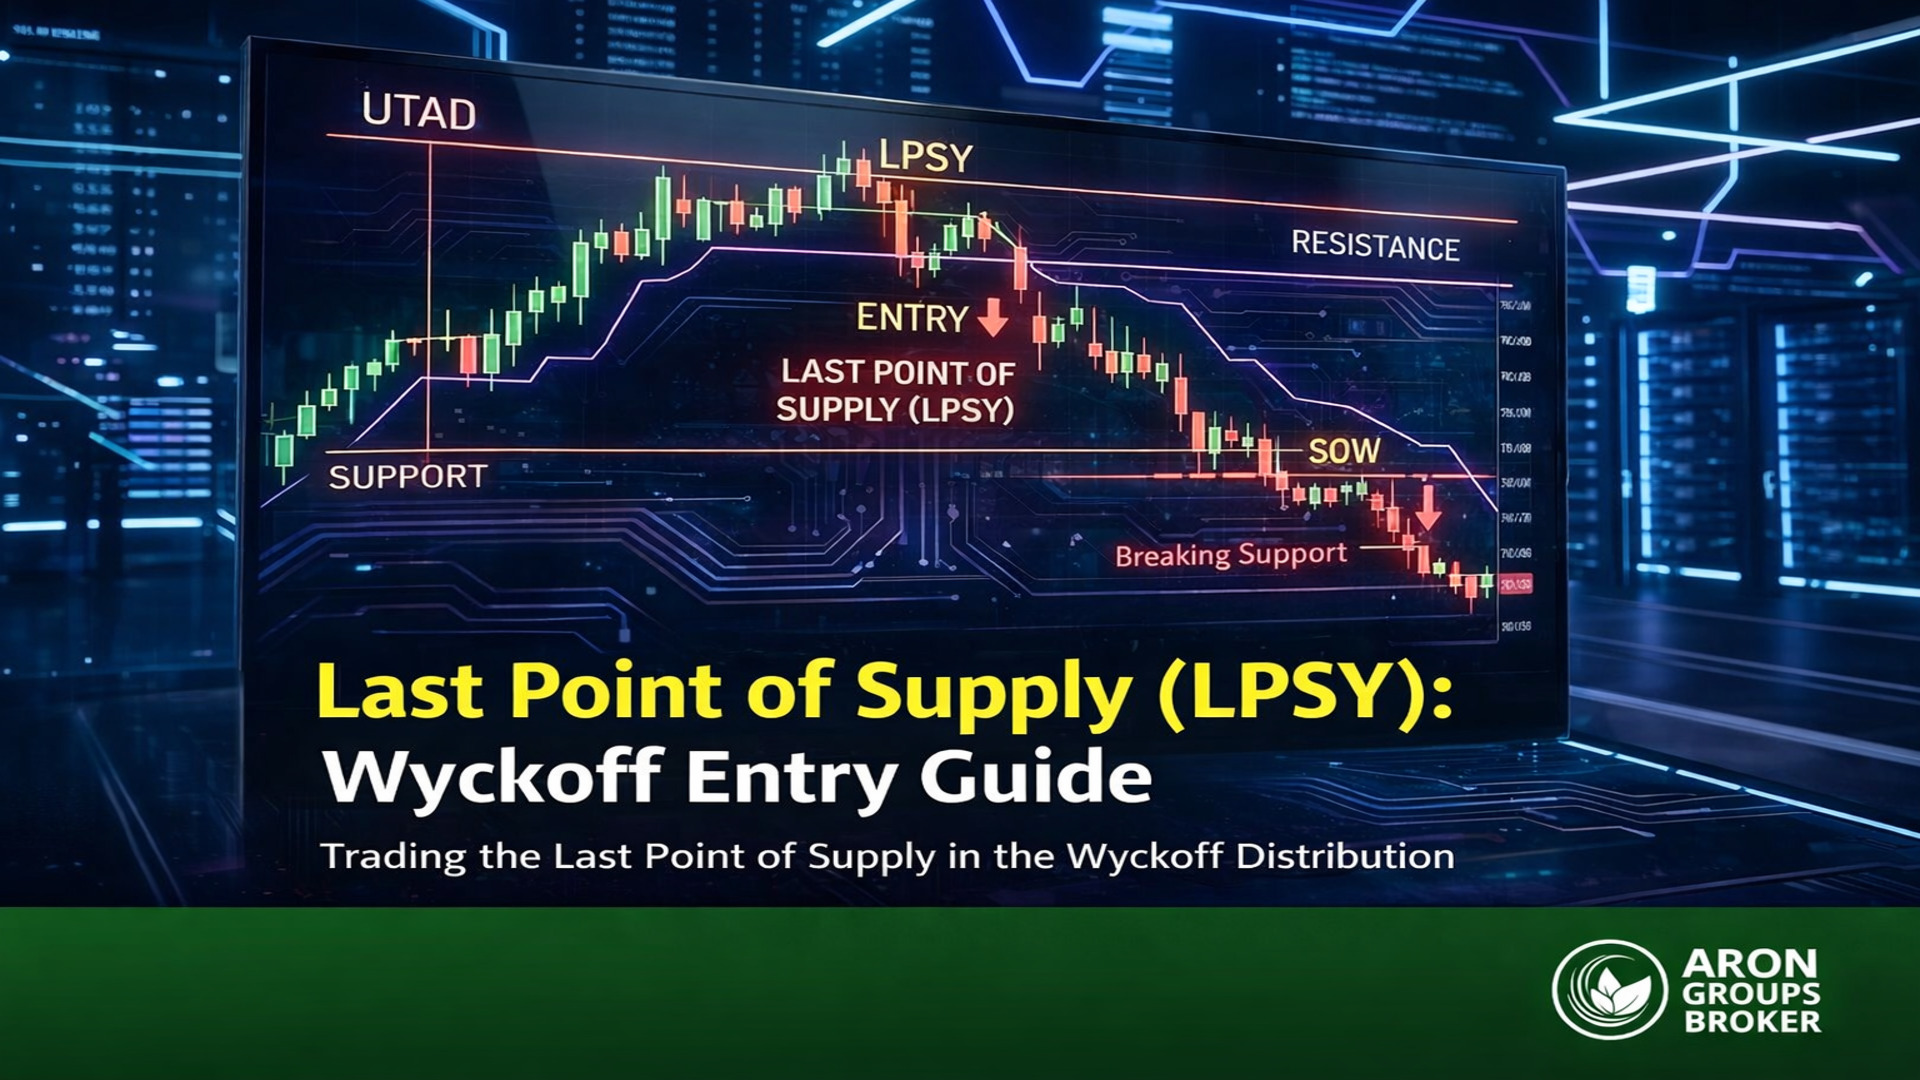
What is the Last Point of Supply?
In the Wyckoff Method, the Last Point of Supply (LPSY) is a specific price rally that happens near the end of the distribution phase. This occurs after major players known as the composite operator have finished selling their shares to the public.
Because most of the big buyers have already left the market, this rally is weak. It lacks genuine demand, meaning there aren’t enough buyers to push the price significantly higher.

Key Point:
The LPSY is not just a random price dip. It is the market's final, failing attempt to rise before it enters a long-term downtrend, which Wyckoff calls the markdown phase.
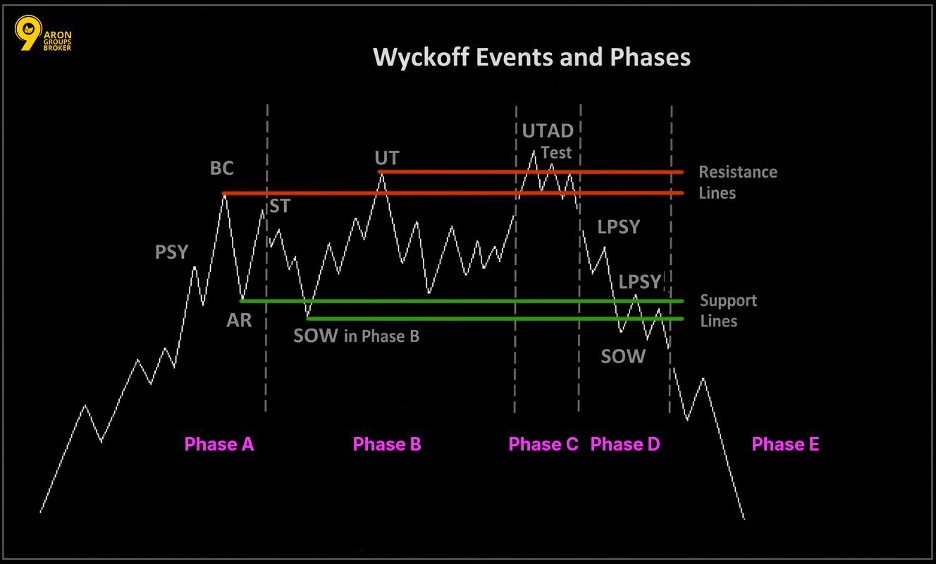
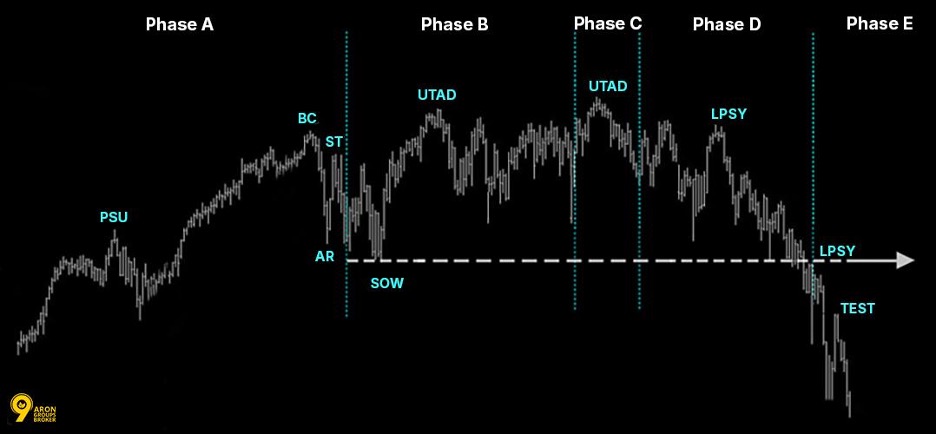
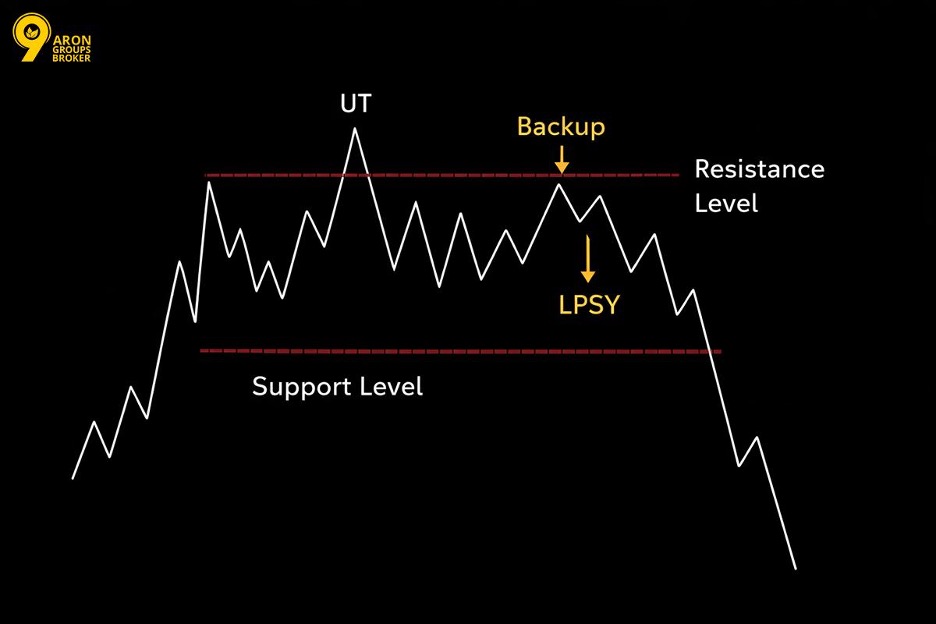
How LPSY Appears Within the Wyckoff Distribution Phase
According to TradingWyckoff.com, Wyckoff analysis follows a specific sequence of events. It starts with Preliminary Supply (PSY) and a Buying Climax (BCLX), followed by reactions and tests. The LPSY specifically appears during Phase D.
By this stage, the price has already dropped below its main support level. The LPSY acts as a backup move, with the price trying to return to that old support level (which is now resistance) before the final drop in Phase E.
The Wyckoff Distribution Sequence
| Phase | Event | What It Signals |
|---|---|---|
| Phase A | PSY, BCLX, AR | The distribution process begins. |
| Phase B | ST, UTAD | The range is set; supply is absorbed. |
| Phase C | SOW | Demand fails; the price breaks lower. |
| Phase D | LPSY | A final rally into new resistance. |
| Phase E | Markdown | A sustained downtrend begins. |
Identifying Key LPSY Signals
Learn how to spot the specific technical warnings that a Last Point of Supply is forming.
Signs of Weakness (SoW) Before LPSY
The Sign of Weakness (SoW) is a price drop that falls below the lower boundary of the trading range on high volume. This move confirms that supply is now in control and the distribution phase is almost finished. You cannot reliably identify an LPSY until a SoW has been confirmed.
The SoW is a necessary structural requirement. It removes any doubt about whether the market is currently in a “distribution” or “accumulation” stage.
Important:
Do not try to find an LPSY until the SoW is clearly visible on your chart. If you enter a "short" position too early, before supply dominance is confirmed, you risk getting caught in a normal price dip during an ongoing uptrend.
Spotting Lower Highs After Distribution
A lower high appearing after distribution is the clearest visual signal of an LPSY. Once the SoW pushes the price below the trading range’s support, the next rally will fail to reach the previous high.
This creates a series of descending peaks, confirming that sellers are stepping into the market at lower and lower price levels.
Each lower high during a weak rally reinforces the fact that supply is absorbing every attempt by buyers to push the price back up. Traders should track the “swing highs” that occur after the SoW and compare them to the original resistance levels.
Recognising Supply Dominance Zones
A supply dominance zone is a price area where sell orders are constantly stronger than buy orders, stopping the price from moving higher. In Wyckoff analysis, these zones usually match the bottom of the old trading range. This area has now converted from “support” into “resistance”.
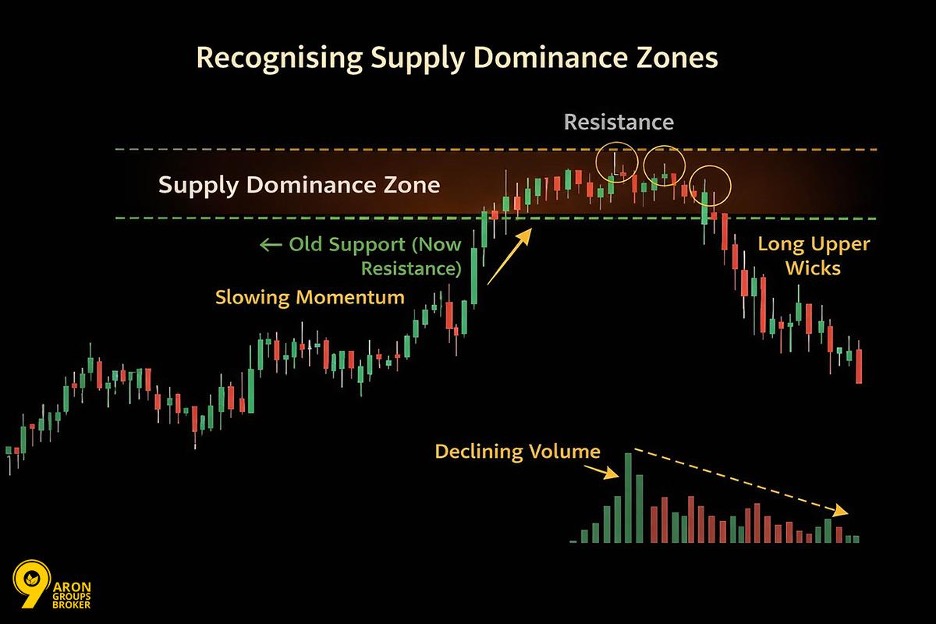
When the price enters a supply dominance zone during an LPSY rally, it produces three specific signals:
- Slowing momentum: The price stops moving upward quickly.
- Long upper wicks: Candlesticks show that the price tried to rise but was pushed back down.
- Declining volume: Trading activity is declining as the rally approaches the resistance area.
Together, these three elements show that the rally is losing energy as it hits a “ceiling” of sellers.
Q: Can an LPSY form more than once in a single distribution structure?
A: Yes. In complex Wyckoff distribution phases, multiple LPSYs can form in a row. Each one represents a failed rally that creates a progressively lower high. When this happens, each LPSY is assigned a numerical label, such as LPSY 1, LPSY 2, and so on.
Each new LPSY confirms that supply is still in control, making the argument for a short entry even stronger. Traders should note that seeing multiple LPSYs often means the distribution process is taking longer, which can lead to a more significant markdown phase.
LPSY vs Other Distribution Points
Understand the critical differences between the Last Point of Supply and other key signals in the Wyckoff distribution phase.
Comparing LPSY with UTAD
Wyckoff Analytics clarifies the critical distinction: Both the Upthrust After Distribution (UTAD) and the LPSY are bearish signals in a Wyckoff distribution. However, they appear at different times and mean different things. The table below explains the differences:
| Feature | UTAD | LPSY |
|---|---|---|
| Phase | Phase B or early Phase C | Phase D |
| Position (vs Range) | Briefly breaks above resistance | Fails below prior resistance |
| Volume | Often elevated (high volume) | Typically declining (low volume) |
| Purpose | Final shakeout of short sellers | Last opportunity to exit long positions |
| Implication | Distribution is continuing | Markdown is imminent (about to start) |
Mistaking an LPSY for a UTAD is a common and expensive mistake.
Remember: a UTAD happens inside the trading range and can briefly look bullish, but an LPSY happens after the Sign of Weakness (SoW) and doesn’t get near the top of the range.
LPSY and Backup to Resistance Levels
In the Wyckoff method, “backup to resistance” (BTR) refers to the price returning to a level that used to be support but has now been broken. For the LPSY, this happens after the SoW pushes the price below the trading range’s support. This subsequent weak rally, the LPSY is that exact backup to resistance.
The BTR is significant for two reasons:
- It gives anyone still holding long positions a final chance to sell.
- It gives short sellers a safe, high-probability entry point.
By this time, the support level has already been tested and confirmed as new resistance during the SoW.
Key Point:
This backup to resistance that Wyckoff traders watch for is not a sign of bullish strength. Instead, it is a supply-absorption event in disguise, meaning large sellers are using the weak rally to finish selling their remaining positions.
How to Enter Trades Using LPSY
Discover the best strategies and timing for entering a short position as the market begins its final decline.
Short Entry Techniques Using LPSY
A short entry using the LPSY is most reliable when two conditions are met:
- The price has finished a confirmed Sign of Weakness (SoW),
- And the following rally shows signs of failure.
These signs include a lower high, declining volume, and the price being close to a resistance zone. You should place the short entry just as the rally begins to lose its upward momentum.
Traders usually enter the market in one of two ways:
- Breaking Consolidation: Entering when the price breaks below a small sideways movement (consolidation) within the rally.
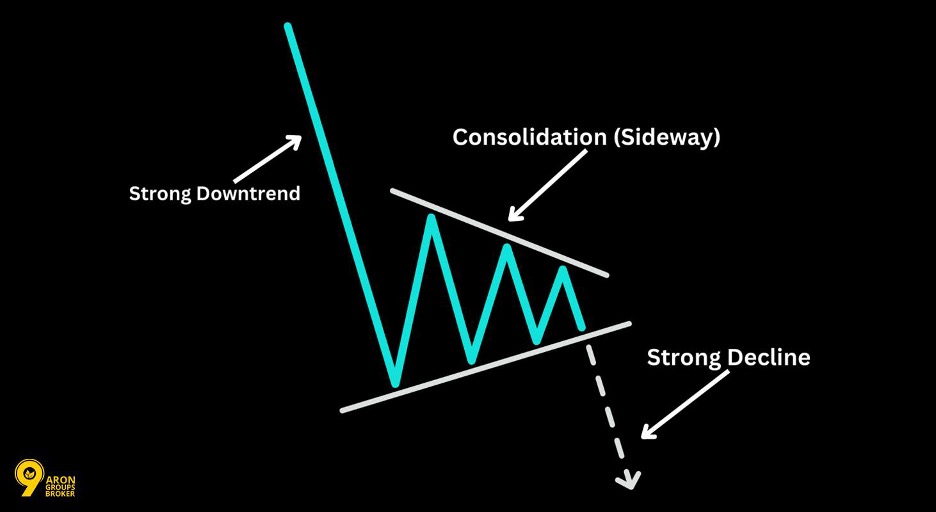
- First Lower-Low: Entering on the first “lower-low” that forms after the LPSY peak is reached.
In both cases, traders use the recent LPSY high as the reference point for their stop-loss level.
Timing Entries on Weak Rallies
Timing your entry on a weak rally requires patience. If a rally moves quickly with high volume, it is not an LPSY; instead, it might mean there is new demand or a complex recovery starting. A true LPSY rally usually moves slowly, with small price movements and shrinking volume.
To get a precise entry, you should watch how the price behaves as it nears the resistance zone:
- Look for a clear rejection, such as a bearish engulfing candle.
- Watch for a series of lower closing prices.
These signals are much safer than blindly entering a trade just because the price reached a resistance zone.
Leveraging Post-Rally Failures for Shorts
Once the initial distribution is over, you can use rally failures to confirm your trade or add to your position. After the LPSY peak is set and the price starts falling, a trader can use every failed intraday rally as a second chance to enter.
This is only recommended if the volume continues to drop on every small bounce.
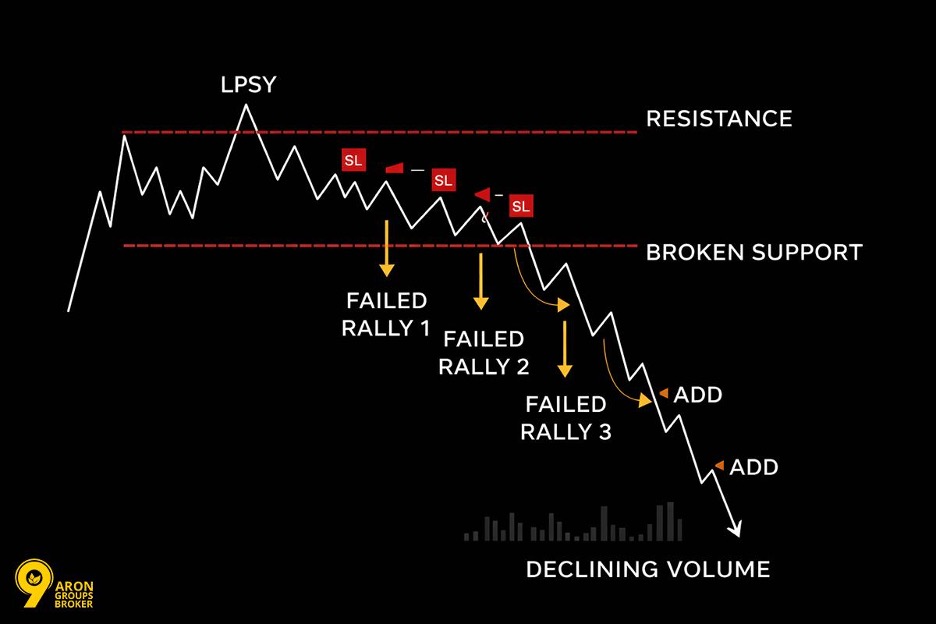
This technique, called adding to a position on confirmation, must be used with very strict risk rules. Remember that every new addition to your trade needs its own stop-loss point.
Market Behaviour After LPSY
Understand how the market moves once the final selling point is confirmed and the price begins to fall.
Post-Distribution Rally Failures
After a confirmed LPSY, the market rarely shows another significant upward move. This is because supply has been fully absorbed, demand is exhausted, and the composite operator has finished selling their positions. Any rallies that do happen are usually short, happen on low volume, and cannot reach the previous LPSY peak.
These failed rallies are visual proof that the Phase E markdown has started. They are not usually meant for new entries; instead, they confirm that your current short positions are in the right place.
Signals for Downtrend Continuation
Once the markdown phase is underway, you will see several signals that the downtrend is continuing:
- Each lower high form is below the previous one.
- Volume increases during price drops (downswings) and decreases during small bounces (upswings).
- The price fails to stay above any minor support levels.
Together, these signs confirm that the markdown phase is active.
Key Point:
In Wyckoff analysis, a markdown is more than just a price drop. It is a structured process where supply is stronger than demand at every price level, creating a steady pattern of lower highs and lower lows.
Avoiding False Signals in Weak Rallies
Not every small price rise in a downtrend is a true LPSY. On shorter timeframes, a normal price pullback can look very similar to an LPSY. The main difference is the context:
- An LPSY only happens within the Wyckoff distribution structure.
- It must happen after a confirmed Sign of Weakness (SoW).
- It must occur within a clearly defined trading range.
Traders who use Wyckoff rules alone without looking at the bigger picture on the chart are much more likely to mistake a signal and enter a trade with a bad risk-to-reward ratio.
Confirming LPSY Using Technical Tools
Use volume, price patterns, and the overall market structure to verify that an LPSY is real.
Volume Analysis for LPSY Validation
When checking for an LPSY, your main focus should be on one thing: volume should decrease during the rally.
This drop in demand during the price rise is the opposite of the heavy volume seen during the earlier Sign of Weakness (SoW) drop. This difference confirms that selling pressure is still in control.
If volume actually increases during the rally, be careful. Rising volume on an upswing might mean the distribution phase isn’t finished yet, or a different pattern like a “re-accumulation” is forming.
Price Action Patterns and Trend Context
During an LPSY, candlesticks often show specific signs:
- Long upper wicks: These show that the price was rejected at a resistance level.
- Small “real bodies”: These indicate that buyers and sellers are indecisive.
- Bearish closing candles: These appear as the rally runs out of energy.
These patterns are only useful if you look at the bigger trend context. For example, an LPSY on a daily chart is much more reliable if the weekly chart is already in a clear downtrend.
Coordinating LPSY Entries with Market Structure
To trade an LPSY effectively, you must align your entry with other technical evidence. Look for “confluence” where different tools tell the same story:
- Prior resistance levels: The price hits a ceiling where it previously struggled.
- Moving averages: These lines have started to point downward.
- Relative Strength Index (RSI): The indicator shows the move’s strength is fading.
Never trade a single signal by itself. The LPSY is a structural idea; it works best when you have at least two independent technical reasons to support your trade.
Q: Does the LPSY work on all asset classes and timeframes?
A: The Wyckoff method was originally created for the stock market, but the LPSY concept is now applied to forex, commodities, indices, and cryptocurrency markets. The core principles supply and demand, effort versus result, and cause and effect work in any market.
However, liquidity is very important; Wyckoff analysis is most reliable in liquid markets where volume data is accurate. On very short timeframes (under 15 minutes), there is more “noise” in the data, making it less reliable for identifying an LPSY.
Common Mistakes to Avoid
Stay disciplined by recognising these frequent errors that can hurt your trading performance.
Confusing LPSY with UTAD in Trade Decisions
Confusing these two signals usually leads to taking a short position too early, leaving you “stopped out” before the real price drop begins.
Unlike the LPSY, a UTAD temporarily pushes above the distribution range. Its purpose is to trigger stop losses for people already betting against the market before the actual decline begins.
To avoid this, a disciplined trader waits for the Sign of Weakness (SoW) to confirm that Phase C has ended before calling any rally an LPSY. This simple rule removes most mistakes in identifying the Last Point of Supply.
Overlooking Backup to Resistance Signals
If you ignore backup to resistance (BTR) signals, you might miss the most organised entry point in the entire Wyckoff sequence. Some traders see the SoW and immediately enter a short trade before the backup even forms. This leads to a lower-quality entry and reduces your potential profit.
Waiting for the backup gives you two major benefits:
- Tighter Stop-Loss: You can place your stop-loss much closer to your entry.
- Better Risk-to-Reward: You gain a significant structural advantage by being patient.
Entering Trades Prematurely or Overtrading
Overtrading happens when a trader tries to short every small rally inside the range before the structure is actually confirmed. This behaviour causes a series of small losses that drain your account before the best opportunity, the confirmed LPSY even arrives.
Overtrading during volatile, sideways markets is one of the most common ways retail traders lose their money. Being patient is not just waiting; it is a deliberate decision to manage your risk.
Conclusion
The Last Point of Supply marks the critical transition from a sideways market to a confirmed downtrend. By waiting for the Sign of Weakness and the subsequent weak rally, you ensure you trade in harmony with the composite operator.
This disciplined approach separates professional Wyckoff traders from those who get caught in the “noise” of early distribution.