icon icon Home
icon icon Accounts
icon icon Quick start
icon icon Symbols

Wyckoff SOW Insights: Identifying Supply-Controlled Breakdowns

Author
Abe Cofnas
Abe Cofnas
calendar Last update: 15 April 2026
watch Reading time: 10 min

The Sign of Weakness (SOW) is one of the most important bearish clues in the Wyckoff method, but it is often misread as any sharp drop. In practice, SOW is not just a red candle or a quick breakdown. It is a context-based signal that shows supply taking control, usually after a distribution process has already developed.

A proper SOW helps traders distinguish between random volatility and a genuine transition towards weakness. That distinction matters because the trade logic, timing, and risk management are very different.

This guide explains what SOW really means in Wyckoff analysis, where it appears in the distribution structure, how it behaves in price and volume, and how traders can apply it in a disciplined way.

bookmark
Key Takeaways
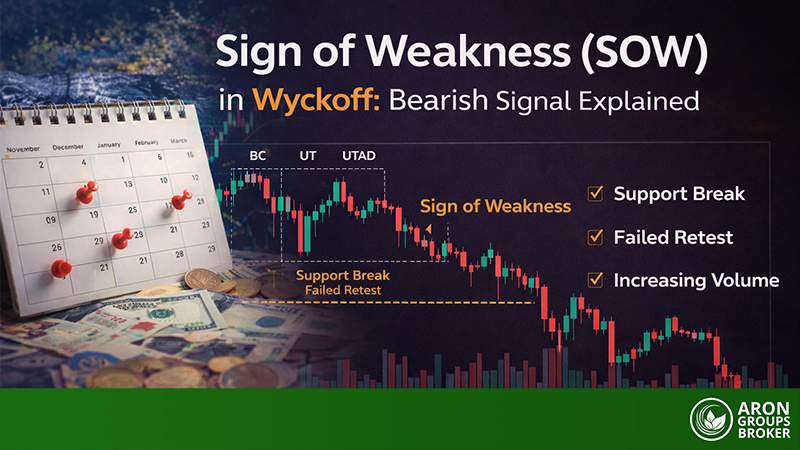
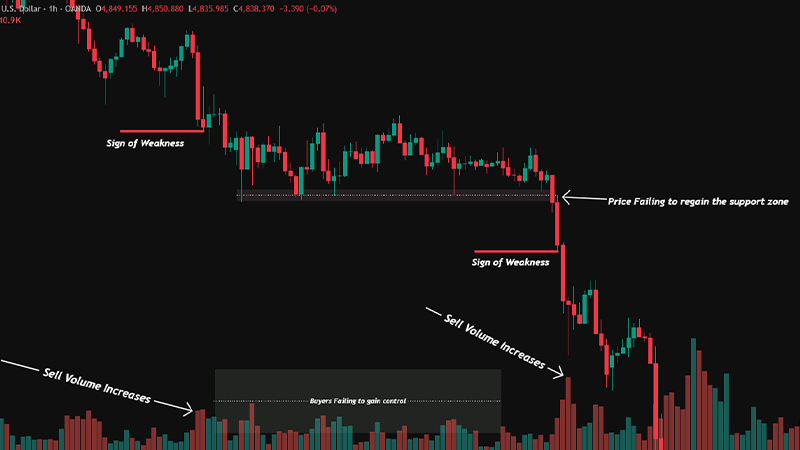
  • A Wyckoff SOW is a bearish sign of supply dominance, not just a one-off sell-off.
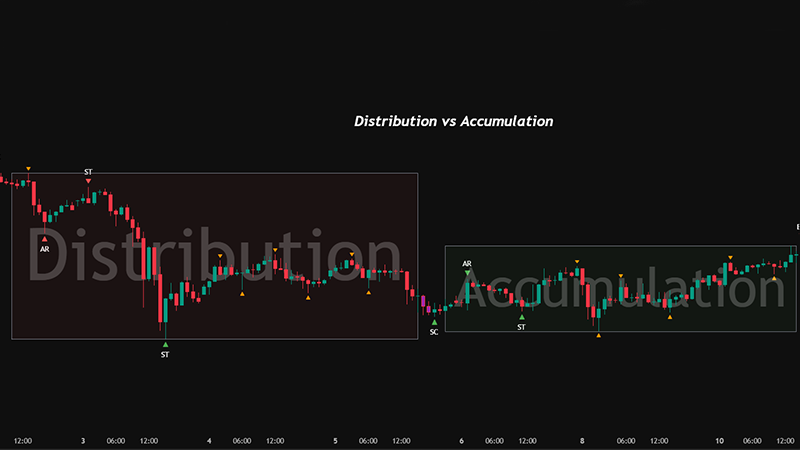
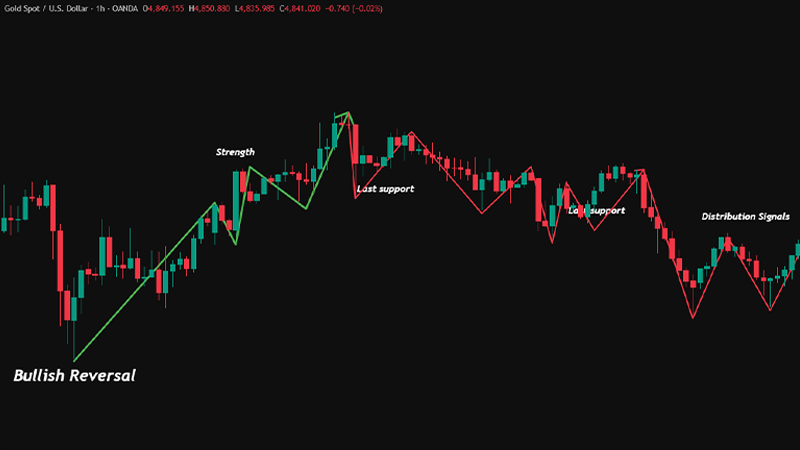
  • Context matters: SOW is typically analysed inside a distribution range, often in late Phase D.
  • High-volume downside expansion and failure to reclaim support are core confirmation clues.
  • SOW and LPSY are related but different events in the breakdown process.
  • The best trade applications usually involve pullbacks after weakness, not panic selling at the low.

Understanding the Sign of Weakness (SOW) in Wyckoff

The Sign of Weakness is a diagnostic event in the Wyckoff distribution. It signals that demand is no longer absorbing supply effectively, and that the market is becoming vulnerable to markdown.

In simple terms, SOW tells you that sellers are beginning to dominate the range structure.

What SOW Wyckoff Really Means

In Wyckoff language, SOW is a bearish event that shows a meaningful deterioration in price behaviour. It is often seen as a downward move through support or across the trading range with an expanding spread and notable volume.

What makes it a Wyckoff SOW is not only the drop itself, but the message behind it:

  • Supply is active.
  • Demand is failing.
  • The rally attempts are less effective.
  • The character of the range is shifting.

A trader looking at SOW should think in terms of “control transfer” rather than “price fell, so it must be SOW”.

sms-star

Did You Know?

A sharp decline can happen inside a trading range without becoming a valid SOW if price quickly reclaims support and demand shows strong follow-through.

Key Differences Between SOW and Minor Shakeouts

A common mistake is confusing SOW with minor downside probes or shakeouts. They can both involve a move below a local support level, but they serve different functions.

Minor Shakeout vs True SOW (Practical Wyckoff Comparison)

CheckMinor ShakeoutTrue SOW
Break below supportBrief dipDecisive break
Recovery after breakFast reclaim into rangeWeak bounce / poor reclaim
Volume on sell-offNormal / mixedMeaningful / elevated
Downside move qualityMessy or short-livedCleaner and stronger
What it usually meansTrap / liquidity probeSupply taking control
Practical trader responseWait for confirmationWatch for pullback short (LPSY)

The key difference is follow-through. Shakeouts tend to fail as bearish events. SOW tends to persist and weaken subsequent rallies.

Context and Market Phase for SOW

SOW should not be analysed in isolation. In Wyckoff, context determines meaning. The same downward move can mean very different things depending on the phase and prior events.

Context and Market Phase for SOW

Late Phase D in Wyckoff Distribution

SOW is commonly associated with late Phase D of a Wyckoff distribution. By this point, the trading range has usually shown repeated evidence that upward progress is struggling.

​Typical background conditions before a Phase D SOW:

  • Prior signs of supply in the range,
  • Failed rallies or weaker upward pushes,
  • Increased volatility near resistance,
  • The inability to sustain strength after bullish-looking moves.

In late Phase D, the market often begins to reveal its true directional intent. The SOW is one of the clearest expressions of that intent.

It is the point where the range starts behaving less like neutral balance and more like a preparation zone for markdown.

How SOW Typically Follows UT and UTAD Signals

Many Wyckoff distribution structures include an Upthrust (UT) or Upthrust After Distribution (UTAD) before the SOW. These events test demand above resistance and often trap breakout buyers.

After UT/UTAD, a valid SOW may appear when:

  • The price falls back into the range with weak demand,
  • The support is tested and breaks more decisively,
  • The rallies become shallow and unstable.

This sequence is significant as it reinforces the bearish narrative: the price initially tests higher levels, demand fails to sustain the breakout, and supply subsequently increases on the downside.

sms-star

Key Notes:

  • UT/UTAD is not mandatory in every distribution, but when present, it often improves the quality of a later SOW read.
  • SOW becomes more meaningful when it follows a failed upside continuation.

Price Action Characteristics of SOW

SOW has a distinct behavioural profile. Traders who focus only on labels miss the practical evidence in price spread, volume, support interaction, and recovery quality.

Wide Down Moves With High Volume​

One of the classic SOW features is a wide downward price spread accompanied by relatively high volume. This combination suggests urgency and participation from the supply.


A wide down move on low volume may simply reflect the temporary absence of buyers. A wide down move on high volume is more consistent with active selling pressure.


That said, volume interpretation should stay contextual. Exceptionally high volume can sometimes reflect climactic action rather than clean continuation, while moderately high but persistent volume on downswings may be a stronger sign of sustained supply control.


​The main concern here is not to question the high volume’s reason, but rather to question the price’s reaction to it.

Support Breaks Within the Range

SOW often involves a break of support inside the distribution range, especially support that was previously defended multiple times.

Support Breaks Within the Range

The quality of the support break matters:

  • Clean breaks with limited bounce tend to be more bearish.
  • Breaks followed by immediate strong reclaim are less convincing.

When price repeatedly returns below support after attempted recoveries, that behaviour usually supports the SOW interpretation.

This is one reason Wyckoff analysis is process-based. A single support break is not enough. Repeated failure to restore strength is the deeper signal.

Transition to Markdown Phase

SOW is frequently a bridge between distribution and markdown. It does not always mark the exact beginning of markdown, but it often shows that the market is moving in that direction.​

You can think of SOW as the market’s behavioural shift, where upside efforts lose quality, downside moves gain efficiency, and support breaks start to matter more than resistance breaks.

Transition to Markdown Phase

If the range was previously two-sided, SOW begins to tilt the odds towards one-sided downside movement.

sms-star

Trading Tip:

Traders often lose discipline by trying to short the first sign of weakness. In many cases, the cleaner opportunity appears on the next weak rally after the SOW.

Demand Fails to Absorb Selling Pressure

Another core SOW characteristic is failed absorption by demand. This is visible when:

  • Bounce attempts are short-lived.
  • Volume rises on declines but not on recoveries.
  • Price cannot hold reclaimed levels.


In practical terms, demand is still present, but it is no longer effective enough to reverse the flow. That imbalance is what makes SOW useful for bearish trade planning.​


Q: Can SOW happen without a dramatic volume spike?

A: Yes. While higher volume often strengthens the signal, a valid SOW can also develop through repeated weak rallies and efficient downside movement that shows supply dominance.

SOW in Relation to Other Wyckoff Signals

SOW is part of a sequence, not a standalone label. Its meaning becomes clearer when compared with nearby Wyckoff events, especially LPSY and failed support reclamation.

SOW vs LPSY: Weak Rally Back to Supply

SOW and LPSY (Last Point of Supply) are related but not identical.

SOW is a bearish sign that shows material weakness and supply control; meanwhile, LPSY is usually the weak rally that follows, where the price returns towards resistance or former support and fails.

In many distribution structures, the sequence looks like this:

  • SOW breaks or weakens support
  • Price rallies weakly
  • Rally stalls under supply (LPSY)
  • Markdown resumes

This distinction matters for execution. Traders who short the SOW impulse may face poor R:R if they chase weakness. Traders who wait for LPSY often get a more structured entry.

Confirming SOW: Broken Support Not Reclaimed

One of the strongest practical confirmations of SOW is failed support reclamation. If a key support breaks and the price cannot reclaim and hold it, the bearish case strengthens.

Confirmation clues:

  • Rebounds into broken support, loses momentum.
  • Candles show upper wicks near former support.
  • Volume does not support recovery.
  • Price rolls over quickly after the test.

This polarity change is often more informative than the original breakdown candle.

Weakness After Trading Range: Ensuring Real Breakdown

Not every move below a range is a real breakdown. Markets often undercut lows and reverse. To improve reliability, traders should look for evidence that weakness is persistent, not temporary.

Useful checks:

  • Was the breakdown preceded by distribution-like behaviour?
  • Did the price break and stay weak, or snap back quickly?
  • Are rallies weaker after the break?
  • Is downside spread more efficient than upside recovery?

Don’t label a move as SOW purely because it broke the range low; Wyckoff signals are behaviour-based, and false breakdowns are common.

Practical Trading Applications of SOW

SOW becomes valuable when it improves decision quality. The goal is not to label the chart perfectly. The goal is to trade the weakness with structure and risk discipline.

Entry Logic: Short on Pullback After Breakdown

A common application is to avoid shorting the initial SOW impulse and instead wait for a pullback into supply.

Typical bearish entry logic after SOW

  1. Identify the SOW and broken support zone.
  2. wait for a rally back towards that zone
  3. assess rally quality (spread, volume, momentum)
  4. Enter short when the rally stalls and weakness returns.


With this approach, not only will you have a better entry location, but you can also have a clearer invalidation point.


In many cases, the pullback after SOW becomes the LPSY or part of the LPSY structure.

Risk Management and Stop Placement

Risk management matters more than signal labels. Even a well-identified SOW can fail due to range expansion, news, or broader market strength.


Practical stop placement ideas:

  • Above the pullback high / LPSY high
  • Above the reclaimed supply zone is shorting a retest
  • Beyond the structural level that invalidates the bearish thesis


Avoid placing stops based only on an arbitrary distance. Wyckoff-based trade ideas should fail at structural points, not random percentages.

sms-star

Practical reminders:

  • Size the position after defining the stop, not before.
  • If the pullback is too deep or too volatile, the setup quality may be lower.
  • A missed trade is cheaper than a forced trade in a noisy range.

Combining SOW With Volume and Price Patterns

SOW is strongest when price and volume tell the same story.

Examples of useful alignment:

  • SOW down move shows widespread and expanding volume.
  • Pullback rally has a narrower spread and weaker volume.
  • Rollover from pullback shows renewed downside expansion.


This gives a cleaner supply-demand contrast:

  • Strong selling effort
  • Weak buying response
  • Renewed seller control

You can also combine SOW with simple price-pattern observations, such as:

  • Failed retest of broken support
  • Lower highs after the breakdown
  • Compression before renewed downside push

Conclusion

The Sign of Weakness (SOW) in Wyckoff is not just a bearish candle or a break below support. It is a context-driven signal that shows supply gaining control, usually after a distribution process has already weakened demand.

Its real value comes from how it changes market behaviour: downside moves become more efficient, support breaks matter more, and rallies struggle to reclaim lost ground. That is why SOW is often a key transition signal on the path towards markdown.

​For practical trading, the strongest use of SOW is usually not chasing the initial breakdown, but reading the sequence that follows, especially failed support reclamation and weak rallies such as LPSY behaviour.

Treat SOW as evidence of changing control, then build your trade around structure, confirmation, and disciplined risk management.

Continue Reading
not-found
calendar 15 April 2026
Rate this article
Plugin not installed

Leave a Reply

Your email address will not be published. Required fields are marked *

No thanks