
The JOLTS report is the Job Openings and Labor Turnover Survey, a monthly release from the US Bureau of Labor Statistics (BLS). It measures the demand side of the labour market: the jobs employers want to fill, and how many workers are hired, quit or laid off. It does not measure unemployment.
It matters now because the Fed is tightening again. On 16 September 2026 the Fed raised its target for the federal funds rate to 3.75% to 4.00%, its first hike since July 2023. The latest JOLTS report, out on 29 September, counted 7.08 million openings in August, when 7.03 million people were unemployed.
This guide explains the five core numbers, the ratio of openings to unemployed people and the Beveridge curve. It then covers the Fed, the payrolls comparison and how gold, the dollar and yields have reacted on release days.
- JOLTS is a monthly BLS survey of about 21,000 business and government establishments that counts job openings, hires, quits, layoffs and other separations; it is published at 10:00 am Eastern.
- The August 2026 report, released on 29 September, showed 7.08 million openings (a 4.3% rate), 5.19 million hires and a quits rate of 1.9%.
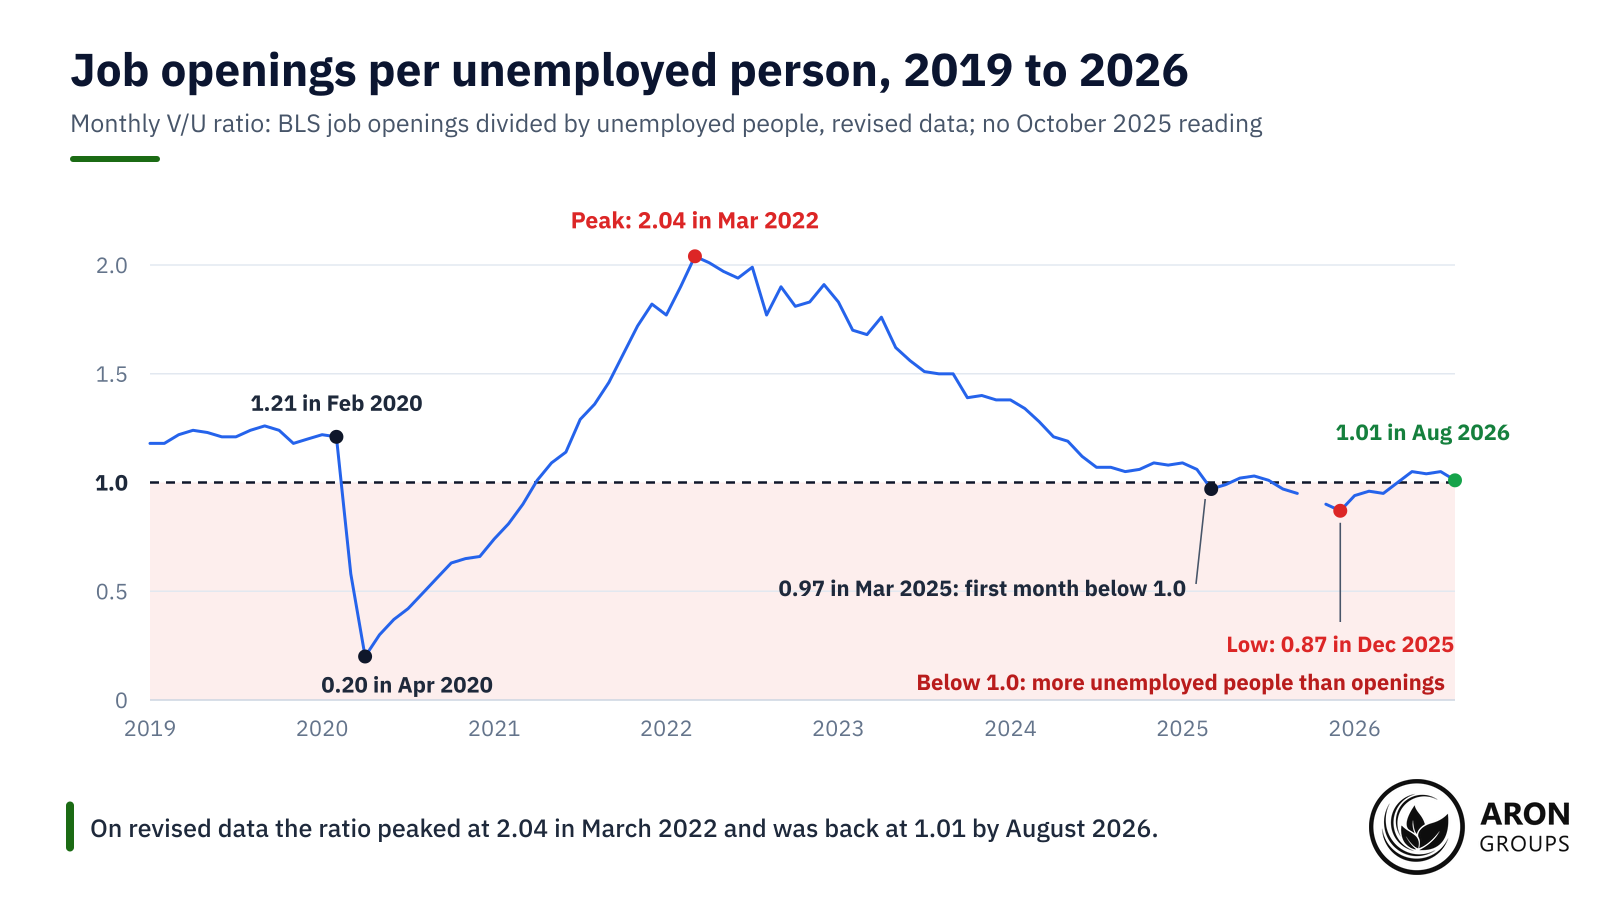
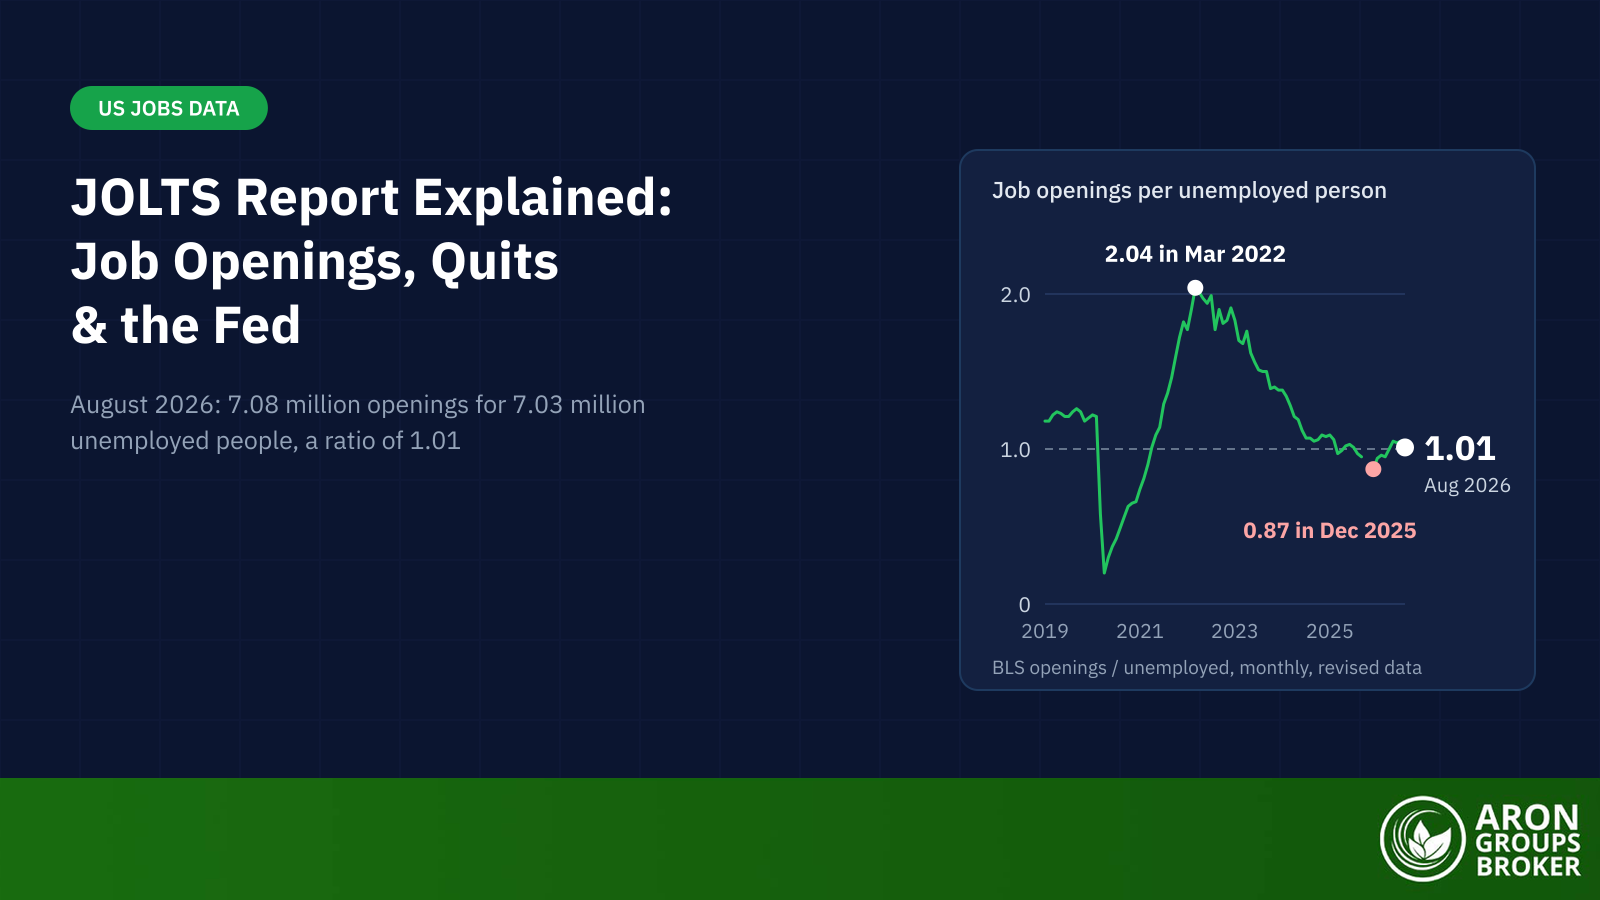
- Openings per unemployed person peaked at 2.04 in March 2022, slipped below 1.0 in March 2025 on revised data and stood at 1.01 in August 2026.
- The quits rate was back at its 2019 level of 2.3% by April 2023, more than a year before unemployment reached 4.2% in July 2024, so it can flag cooling early.
- Market reactions are usually modest: on 2 June 2026 openings beat forecasts by 750,000, yet the 2-year Treasury yield closed unchanged at 4.05%.
What Is the JOLTS Report?
The JOLTS report is a monthly snapshot of US labour demand and turnover. BLS surveys about 21,000 business and government establishments. It asks how many positions they are trying to fill and how many people joined or left their payrolls. People also call it the JOLTS job report or the JOLTS index, but it is a survey; its index-like readings are rates and ratios.
Risk Disclosure
Trading forex and CFDs carries a high level of risk and can result in the loss of all your capital. This content is educational and is not investment advice. Never risk money you cannot afford to lose.
Release Time and Schedule
The data come out at 10:00 am Eastern, usually on a Tuesday, four to five weeks after the month they describe. August 2026 figures arrived on 29 September; September’s are due on 3 November and October’s on 1 December 2026.
The schedule is not immune to politics. BLS cancelled the September 2025 release during the federal funding lapse, then published those figures, which included partial data, alongside October’s on 9 December 2025.
The Five Core Numbers in JOLTS Data
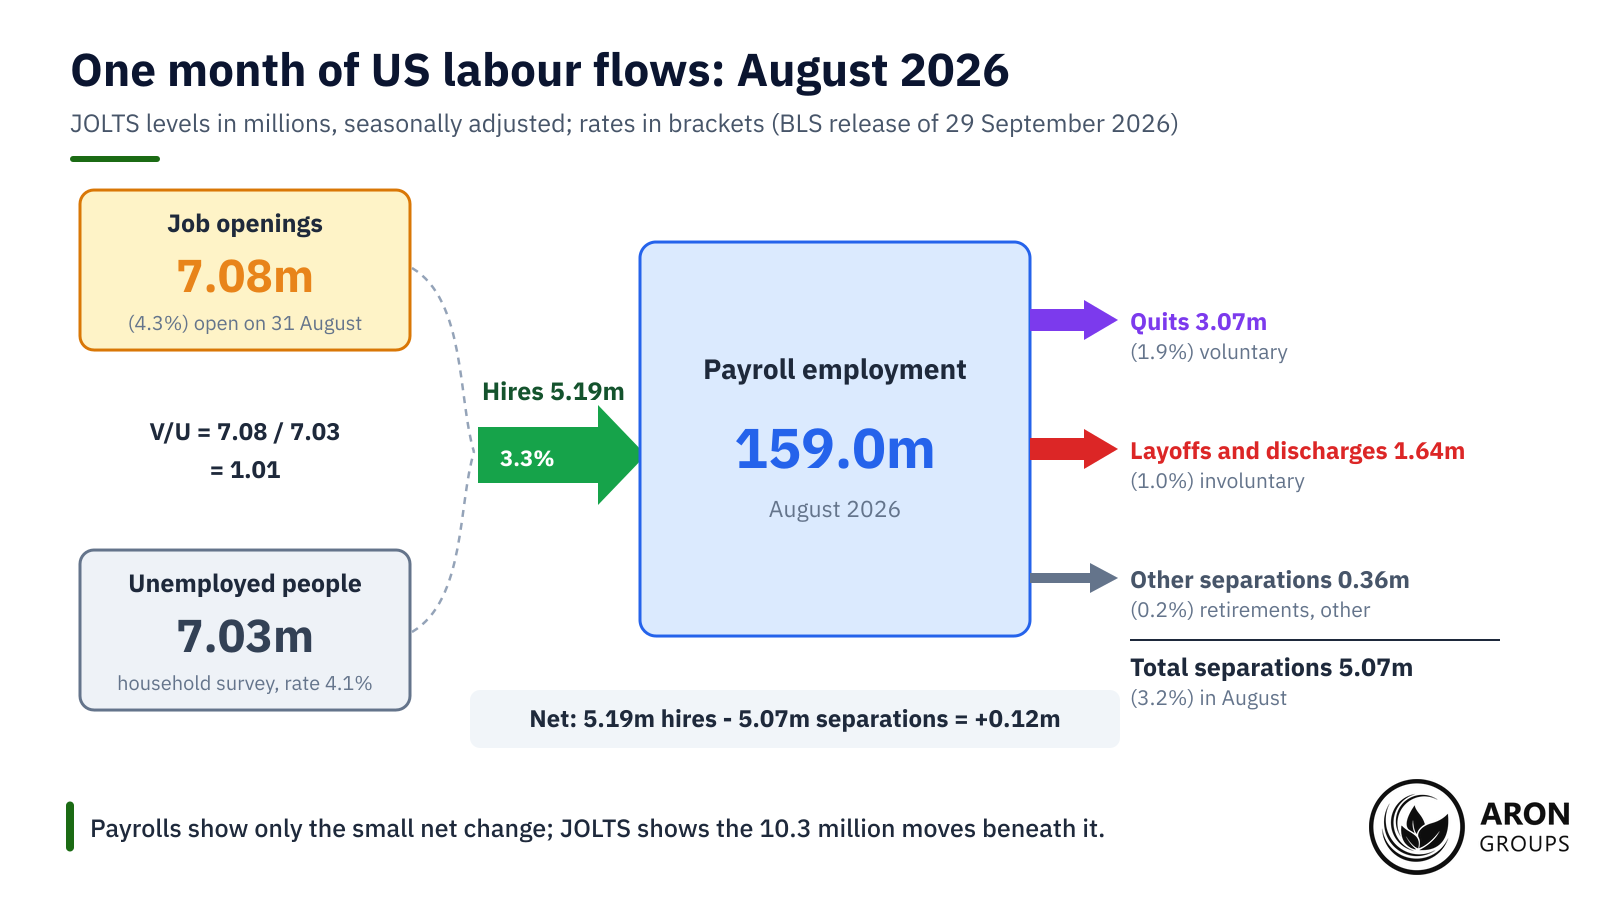
JOLTS tracks five headline series: job openings, hires, quits, layoffs and discharges, and total separations, which also include retirements and other exits. Payroll figures show only the net result of all this movement. JOLTS shows the gross flows underneath.
August 2026 shows the scale. Employers made 5.19 million hires and recorded 5.07 million separations, a net gain of about 120,000, close to the 133,000 rise in payrolls. That net change was about 1% of the 10.3 million moves beneath it.
Job Openings: The Headline Number
JOLTS job openings are positions open on the last business day of the month. BLS counts one only if a specific job exists, work could start within 30 days and the employer is recruiting from outside the establishment. Internal transfers, recalls of laid-off staff and jobs filled through temp agencies do not count.
The job openings rate divides openings by employment plus openings, so it measures unfilled demand as a share of all jobs, filled or not. It was 4.3% in August 2026, against 4.2% a year earlier and a peak of 7.5% in March 2022.
Quits, Hires and Layoffs
Hires count everyone added to payrolls during the month: 5.19 million in August 2026, a hires rate of 3.3% of employment. Layoffs and discharges are involuntary exits; they were 1.64 million, a rate of 1.0%, down from 1.83 million a year earlier.
Quits are voluntary departures, and they are the confidence gauge. People rarely resign without a better offer when jobs are scarce, so a high quits rate signals that workers feel in demand. The rate peaked at 3.0% in November 2021 and April 2022 and was 1.9% in August 2026, below every month of 2019.
Quits also tend to turn early. The rate was back at its 2019 level of 2.3% by April 2023, the month unemployment hit a 3.4% low. Unemployment did not reach 4.2% until July 2024.
The V/U Ratio: Openings per Unemployed Person
The vacancy-to-unemployment (V/U) ratio divides job openings by the number of unemployed people in the household survey behind the unemployment rate. A reading of 2.0 means two open jobs for every jobseeker; below 1.0, jobseekers outnumber openings.
Jerome Powell, then Fed Chair, leaned on it repeatedly in 2022. On 4 May 2022 he told reporters there were “1.9 vacancies for every unemployed person”. On 30 November he put the figure at about 1.7. Traders call it the Fed’s favourite JOLTS metric, though that is market shorthand, not an official label.
Revised data show how far the ratio travelled. It was 1.21 in February 2020 and 0.20 in April 2020. It then peaked at 2.04 in March 2022, with a second high of 2.01 in July. It first slipped below 1.0 in March 2025, bottomed at 0.87 in December 2025 and was back at 1.01 in August 2026.
Revised Versus Real-Time Readings
The dates depend on the data vintage. In real time, the July 2025 report, published on 3 September 2025, put the ratio at 0.99, the first reading below 1.0 since 2021. Revised data now put the first sub-1.0 month in March 2025, four months earlier.
There is also a hole in the series. Household survey data were not collected for October 2025 during the shutdown, so no ratio exists for that month.
Mini Example: Reading the August 2026 Release
Start with the levels BLS published on 29 September 2026: 7,079,000 openings and 3,066,000 quits. August payroll employment was 159.015 million after the 2 October revision, and the household survey counted 7,031,000 unemployed people.
Openings rate: 7.079 divided by (159.015 + 7.079) is 7.079 / 166.094 = 4.26%, which BLS publishes as 4.3%. Quits rate: 3.066 / 159.015 = 1.93%, published as 1.9%.
V/U ratio: 7.079 / 7.031 = 1.007, about one opening per jobseeker. Against a consensus of about 7.23 million, openings missed by roughly 150,000, a mildly dovish surprise.
The Beveridge Curve and the Soft-Landing Debate
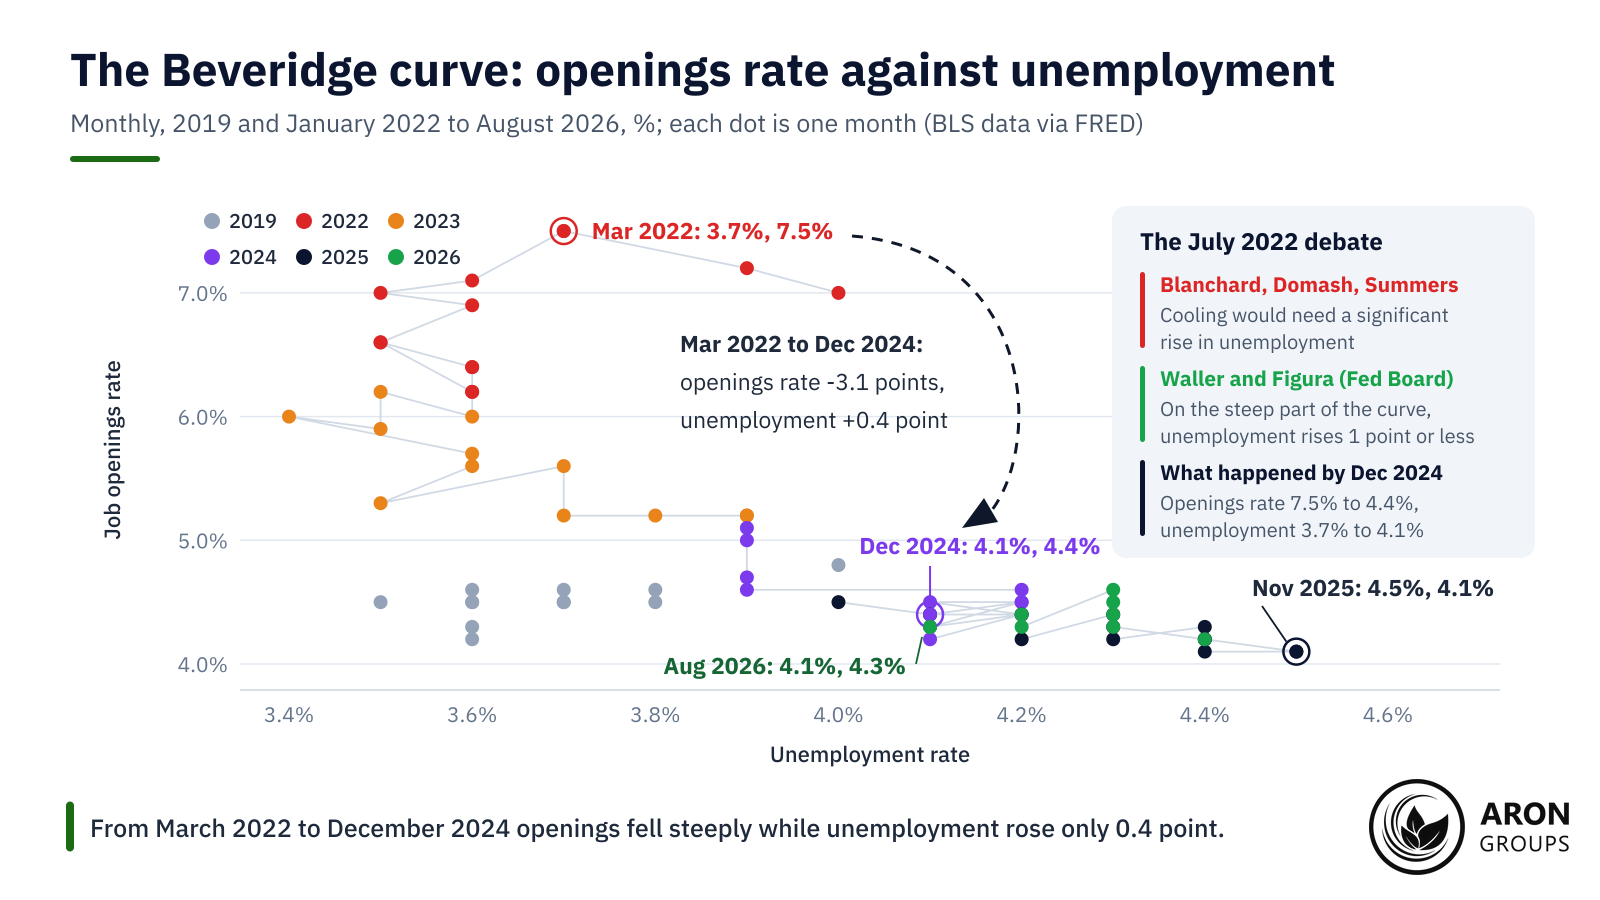
The Beveridge curve plots the job openings rate against the unemployment rate. It usually slopes down: when employers are desperate for staff, unemployment is low. Where the economy sits on the curve tells the Fed how costly it will be to cool the labour market.
In July 2022 that question split economists. Olivier Blanchard, Alex Domash and Lawrence Summers argued in a PIIE policy brief that vacancies had never been cut without a painful rise in unemployment. Fed Governor Christopher Waller and Board economist Andrew Figura replied in a FEDS Note on 29 July 2022. The curve, they argued, was very steep at high vacancy rates.
On their estimates, a fall in the vacancy rate from 7% to 4.6% would add about 1 percentage point or less to unemployment. A steep curve means openings can fall a long way while few people lose their jobs.
What 2023 to 2026 Showed
The data backed the steep-curve view. Between March 2022 and December 2024 the openings rate fell 3.1 points while unemployment rose 0.4 point. In September 2024 Figura and Waller wrote that the labour market’s evolution had borne out their prediction.
The easy part is over, though. A BIS bulletin of 25 September 2025 found US vacancies roughly on par with the number of unemployed workers. It said the phase of falling vacancies with stable unemployment was nearing its end, and by November 2025 unemployment was 4.5%.
That is why a ratio near 1.0 matters. On Figura and Waller’s own estimates, the same 2.4-point fall in the vacancy rate from 4.6% would add two to three times as much unemployment.
Why the Fed Watches Openings and Quits
The Fed watches JOLTS because tight labour markets push up wages, and wages feed inflation. When openings far exceed jobseekers, employers bid for staff and workers quit for better pay. In May 2022 Powell said employers were struggling to fill openings and wages were rising at the fastest pace in many years.
Powell kept citing the survey as the market cooled. At his press conference on 1 May 2024, the day March JOLTS data came out, he said quits and hiring rates had essentially normalised. A normal quits rate suggested wage pressure was fading without mass layoffs.
The 2026 picture is different. On 16 September Chair Kevin Warsh, in office since May, said job openings and weekly hours had been increasing. He called the labour side of the mandate in good shape. That left inflation as the focus, with the median projection at 4.1% for end-2026.
Key Point
Openings measure demand, quits measure worker confidence, and the V/U ratio sets demand against supply. When all three are high, wage pressure tends to build; when they fall while layoffs stay low, the labour market is cooling without a recession.
JOLTS vs NFP, ADP and Jobless Claims
JOLTS is slower than the other labour releases but goes deeper. The monthly jobs report gives the net change in payrolls and the unemployment rate. JOLTS arrives about a month later and explains the flows behind them. The table compares the four main US labour releases.
| Release | What it measures | Reference period | Release time (ET) | Latest headline | Typical market impact |
|---|---|---|---|---|---|
| JOLTS (BLS) | Openings, hires, quits, layoffs from about 21,000 establishments | Openings: last business day; flows: whole month | 10:00 am, four to five weeks after month end | 7.08m openings, quits rate 1.9% (Aug 2026, out 29 Sep) | Moderate; larger when the Fed debates tightness |
| Jobs report: NFP and unemployment rate (BLS) | Net payroll change (about 119,000 businesses and agencies) and unemployment (about 60,000 households) | Pay period or week including the 12th | 8:30 am, usually first Friday | +29,000 jobs, 4.2% unemployment (Sep 2026, out 2 Oct) | High |
| ADP National Employment Report | Private payroll change from weekly payroll data on 26m+ workers | Calendar month | 8:15 am, Wednesday before the jobs report | +90,000 (Sep 2026, out 30 Sep) | Moderate; can diverge from BLS |
| Weekly jobless claims (Department of Labor) | New claims for unemployment insurance | Week ending Saturday | 8:30 am, every Thursday | 197,000 (week to 26 Sep, out 1 Oct) | Low unless the trend breaks |
JOLTS against the other US labour releases. Sources: BLS, ADP and the US Department of Labor, releases of 29 September to 2 October 2026.
The timing explains the lag. When August JOLTS data came out on 29 September, August payrolls were already 25 days old, and September payrolls followed three days later. JOLTS adds less news about the month itself; its value is in showing why payrolls moved and how tight demand remains.
How the JOLTS Report Moves Gold, the Dollar and Yields
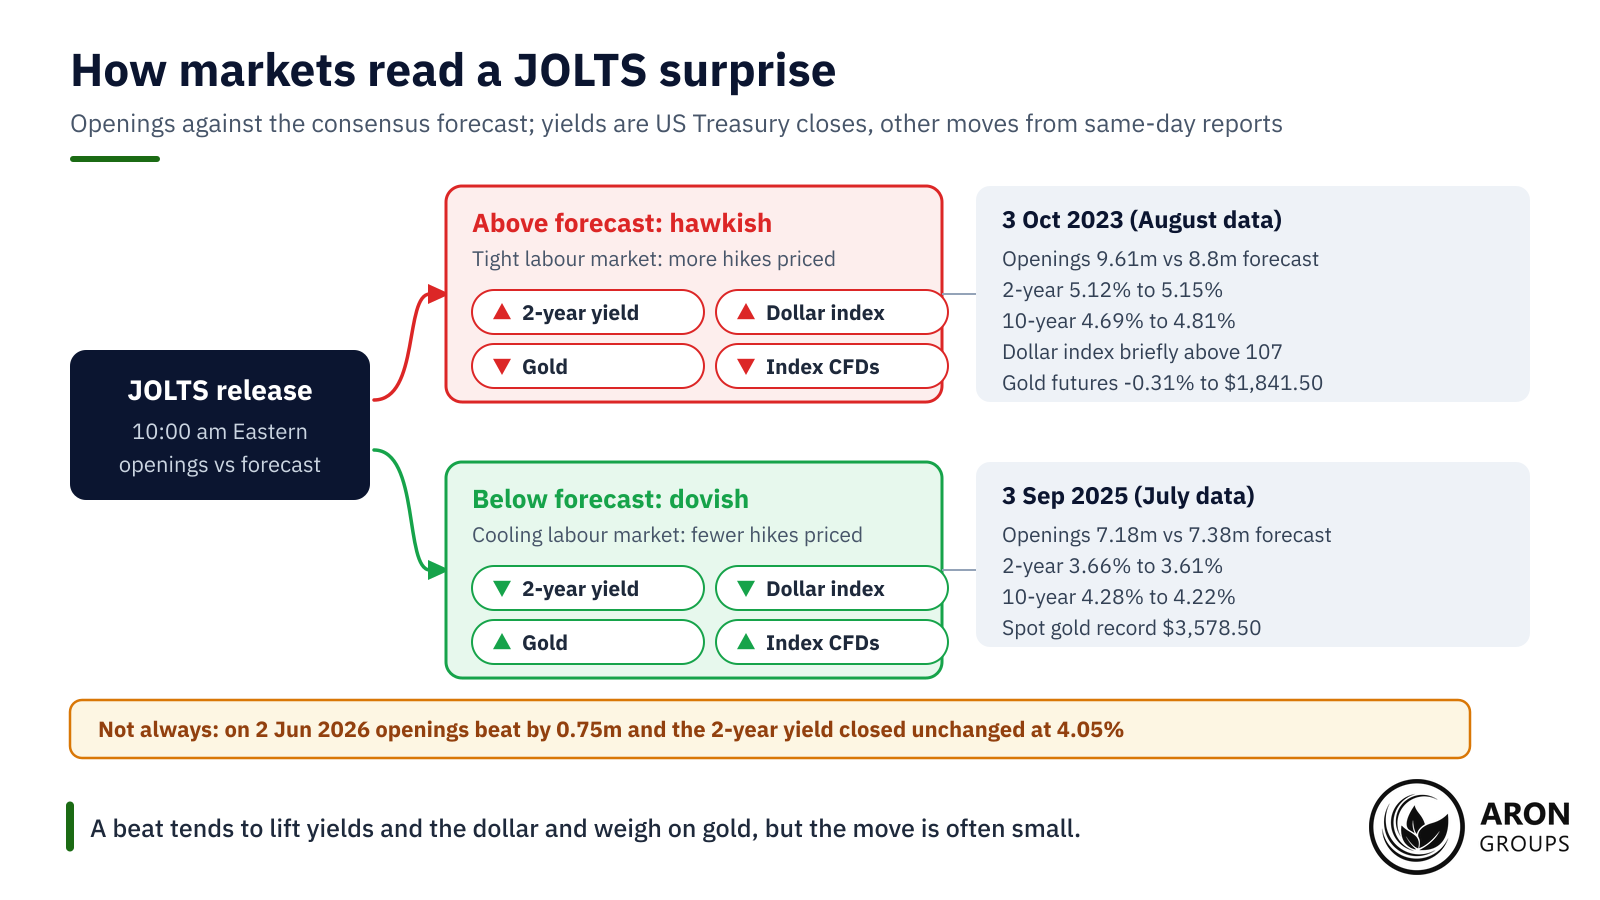
JOLTS moves markets through Fed expectations. Openings above forecast suggest a tighter labour market, so traders price more hikes or fewer cuts. That hawkish surprise tends to lift the 2-year Treasury yield and the dollar, while gold, which pays no interest, comes under pressure.
A miss is a dovish surprise that tends to soften the dollar and support gold. Rising yields also mean falling bond prices: as an SEC investor bulletin puts it, when market interest rates rise, prices of fixed-rate bonds fall.
Three Dated Examples
On 3 October 2023 August openings jumped to 9.61 million against a forecast of 8.8 million. The 2-year yield closed at 5.15%, up from 5.12%, and the 10-year rose from 4.69% to 4.81%. The dollar index briefly topped 107 and December gold futures fell 0.31%.
On 3 September 2025 July openings fell to 7.18 million against 7.38 million expected, below the number of unemployed for the first time since 2021. The 2-year yield fell from 3.66% to 3.61%, and spot gold set a record of $3,578.50.
The latest release was mixed. On 29 September 2026 openings of 7.08 million missed a forecast of about 7.23 million. Spot gold traded more than 1% higher at $4,166 and the 2-year yield dipped from 4.92% to 4.89%. The 10-year still rose, from 5.24% to 5.26%.
Why the Reaction Is Usually Smaller Than for NFP or CPI
JOLTS describes a month that payrolls have already covered, so much of the news is priced. On 2 June 2026 April openings beat forecasts by 750,000, yet the 2-year yield closed unchanged at 4.05%. On 5 June payrolls of 172,000 against 85,000 expected lifted it to 4.17%. CME FedWatch then put the odds of a hike by December at about 58%.
CPI is a direct read on inflation, the variable the Fed is trying to control, while JOLTS is one step removed. JOLTS matters more when the Fed is debating labour tightness, as in 2022 and 2023, or when the ratio crosses one opening per jobseeker.
How Traders Use JOLTS Data
Start with the calendar and the forecast, then judge the surprise in proportion, the way the Citi Economic Surprise Index scores data against expectations. A 150,000 miss on 7 million openings is about 2%, and July’s figure was itself revised by 64,000 a month later.
Then check quits and the V/U ratio, and read the whole picture alongside payrolls, wages and CPI. Leverage magnifies release-day swings: a CFTC advisory warns that two out of three forex customers lose money.
Q: Is a high JOLTS number good or bad for gold?
A: Usually bad in the short term, because more openings point to a tighter labour market and a more hawkish Fed, which lifts yields and the dollar. The effect is often small and can be swamped by other news: on 2 June 2026 a 750,000 beat left the 2-year yield unchanged.
The Honest Limits of JOLTS Data
JOLTS is one input, not a forecast. Its response rate was 35.0% in December 2025, down from 66.0% in January 2016, and thinner samples tend to make monthly estimates noisier. BLS described August’s 256,000 fall in openings as little changed.
Revisions can be large. The annual revision in March 2026 cut January 2025 openings by 331,000 and September 2025 by 489,000. Revised data now date the first sub-1.0 ratio to March 2025, not July.
Openings also measure intentions, not hires: a position counts while the employer is recruiting, whether or not it is ever filled. Read JOLTS with payrolls, unemployment, wages and inflation, never alone.
Where Aron Groups Fits
Aron Groups does not offer bonds or futures, but the markets that react to JOLTS trade on MetaTrader 5. Gold on XAU/USD, the major dollar pairs and index CFDs such as NDXUSD, SPXUSD and DJIUSD are where a surprise tends to show up. The economic calendar lists each JOLTS release.
Release minutes can be volatile, so position size matters more than direction. A demo account lets you watch a 10:00 am Eastern release with no capital at risk. A Nano account trades from 0.01 nano lots with a fixed spread, while spreads on floating-spread ECN accounts can widen around the release. Margin call sits at 100% and stop-out at 50% (40% on Islamic and VIP).
Conclusion
The JOLTS report is the official monthly window on US labour demand: openings, hires, quits and layoffs, and the V/U ratio built from them. In August 2026 it counted 7.08 million openings for 7.03 million unemployed people, a ratio of 1.01, down from 2.04 in March 2022.
Its message is about tightness, not timing. Openings fell steeply after 2022 without mass layoffs, but with the ratio near 1.0, further cooling is more likely to cost jobs. With the Fed hiking again, the next release on 3 November 2026 deserves a place on your calendar, read alongside payrolls, wages and inflation.
Frequently Asked Questions
Short answers to common questions about JOLTS data.
What time is the JOLTS report released?
BLS publishes it at 10:00 am Eastern, usually on a Tuesday, four to five weeks after the month it covers. September 2026 data are due on 3 November 2026 and October data on 1 December 2026.
What is JOLTS data?
It is the monthly output of the Job Openings and Labor Turnover Survey: openings, hires, quits, layoffs, other separations and total separations. Each comes as a level and a rate, broken down by industry, region and establishment size.
Is JOLTS a leading indicator?
Partly. Quits and openings often turn before unemployment does, as quits did in 2022 and 2023. But the report comes out about a month after payrolls for the same period, so the signal arrives late.
What is a healthy V/U ratio?
There is no official target; Powell said in May 2022 that the Fed had no goal for it. The ratio was about 1.2 before the pandemic, while readings near 2.0 in 2022 came with wages rising at the fastest pace in many years.