
icon icon Home
icon icon Accounts
icon icon Quick start
icon icon Symbols

Buffer ETFs: How Defined-Outcome Funds Protect Your Downside, Cap Your Upside, and What That Protection Really Costs

Author
Abe Cofnas
Abe Cofnas
calendar Last update: 19 October 2026
watch Reading time: 9 min

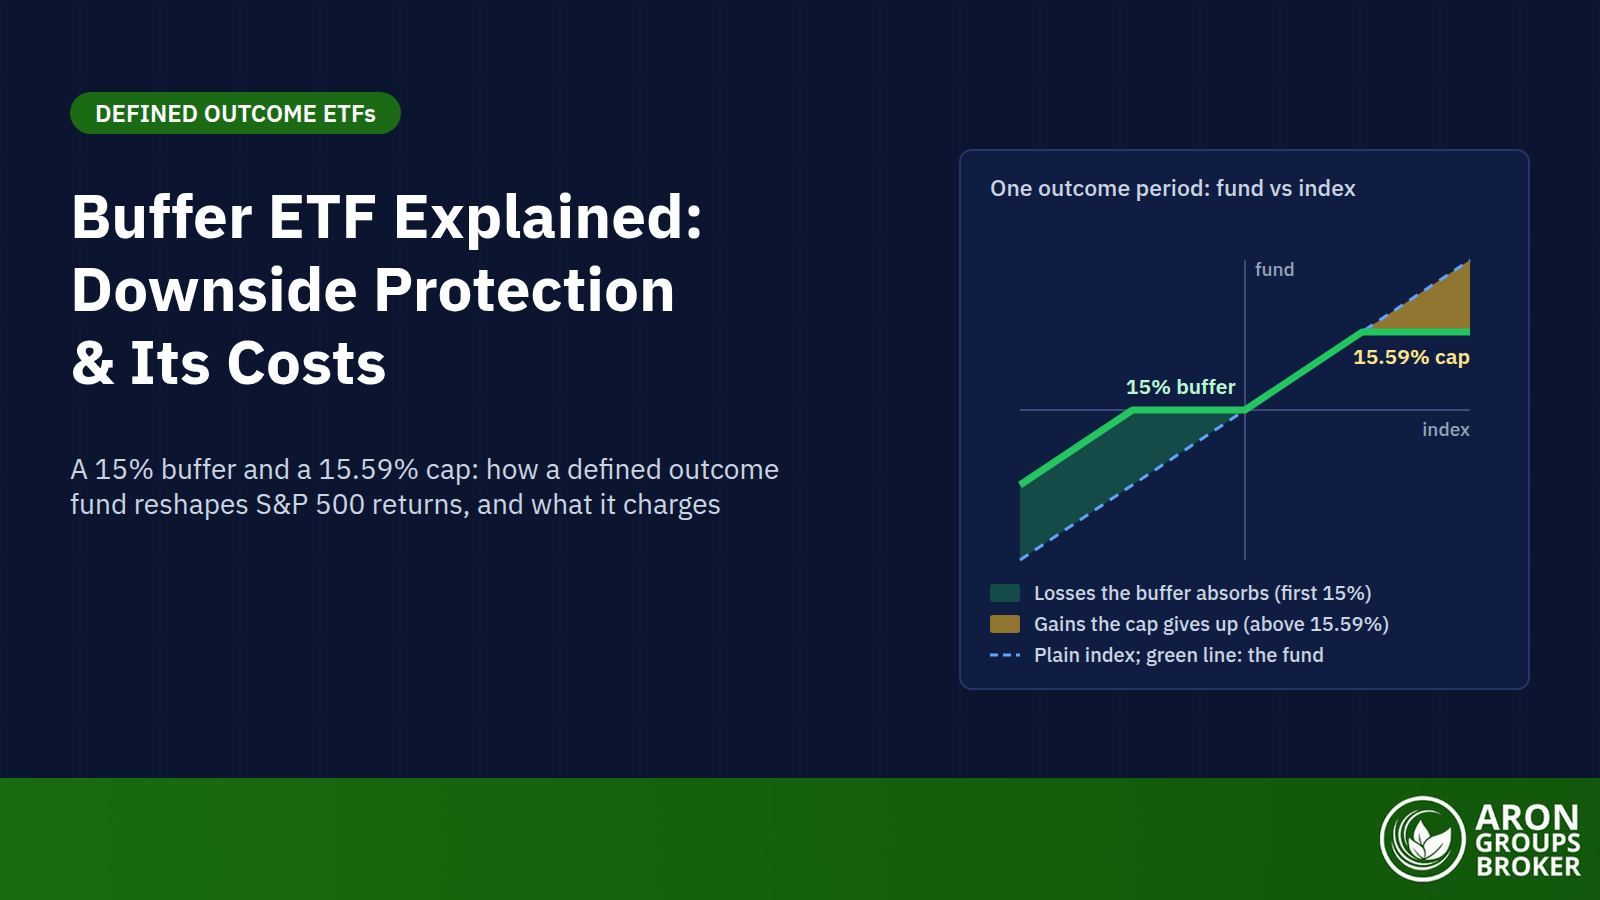
A buffer ETF is an exchange-traded fund that uses options to absorb the first slice of a stock index’s losses, typically 10% to 20%. In exchange, it caps your gains. Also called a defined outcome ETF, it fixes the buffer, the cap and the time window, usually one year, on the day that window opens.

It matters now because the category has gone mainstream. Data firm ETF Action counted $89 billion in 487 buffer ETFs from 19 issuers in April 2026, up from $74.6 billion in 430 funds in September 2025. Because each fund is built from options, its terms move with volatility and interest rates. On 1 October 2026, Innovator reset its October fund, POCT, with a 15% buffer and a 15.59% cap.

This guide explains the options behind the buffer and the cap, works through POCT’s real terms and shows why timing decides what you get. It then compares buffer ETFs with covered call and plain index funds.

bookmark
Key Takeaways
  • A buffer ETF absorbs a set slice of an index's losses, such as the first 15%, and caps gains in return over an outcome period of usually one year.
  • Innovator's POCT reset on 1 October 2026 with a 15% buffer and a 15.59% cap before its 0.79% fee, or 14.21% and 14.80% after it.
  • The buffer and cap apply only if you hold from the first day of the outcome period to the last; buying or selling in between changes the result.
  • Index dividends are not paid on top of the defined outcome, a drag of about 1% a year at the S&P 500's 1.05% yield on 2 October 2026.
  • Buffer ETFs held $89 billion across 487 funds in April 2026, and First Trust's Vest range and Innovator managed about 85% of it.

What Is a Buffer ETF?

A buffer ETF is a fund whose return over a set period is shaped by options so that it lands inside a range defined in advance. FINRA’s investor guidance describes these defined-outcome ETFs as offering protection from some percentage of market losses while capping gains. The period is usually one year, after which the outcome period and the exposure reset.

sms-star

Risk Disclosure
Trading forex and CFDs carries a high level of risk and can result in the loss of all your capital. This content is educational and is not investment advice. Never risk money you cannot afford to lose.
The three terms fixed on day one

Every series is defined by three numbers. The buffer is the slice of losses the fund absorbs, such as the first 15%, and the cap is the most it can gain. The outcome period is the window, usually 12 months, over which both apply. The reference is a stock index or an ETF that tracks one, most often the S&P 500 through SPY.

Who issues them

In ETF Action’s April 2026 count, First Trust’s Vest range held $43.3 billion, or 48.9%, and Innovator $32.4 billion, or 36.6%. Allianz was a distant third with $5.4 billion, and BlackRock’s iShares runs a smaller range of its own.

How a Buffer ETF Works

The fund holds FLEX options, exchange-listed options whose strike, expiry and exercise style can be customised, on its reference index or ETF. Cboe launched them in 1993, and trades are cleared by the Options Clearing Corporation, which Cboe says significantly reduces counterparty risk. All of a series’ options expire on the last day of its outcome period.

On that day each option is worth only its intrinsic value, the amount by which it is in the money. That gives a return of zero between the start level and a 15% fall, and the index’s gain up to the cap. Above the cap the fund gains nothing more; below the buffer it loses one for one.

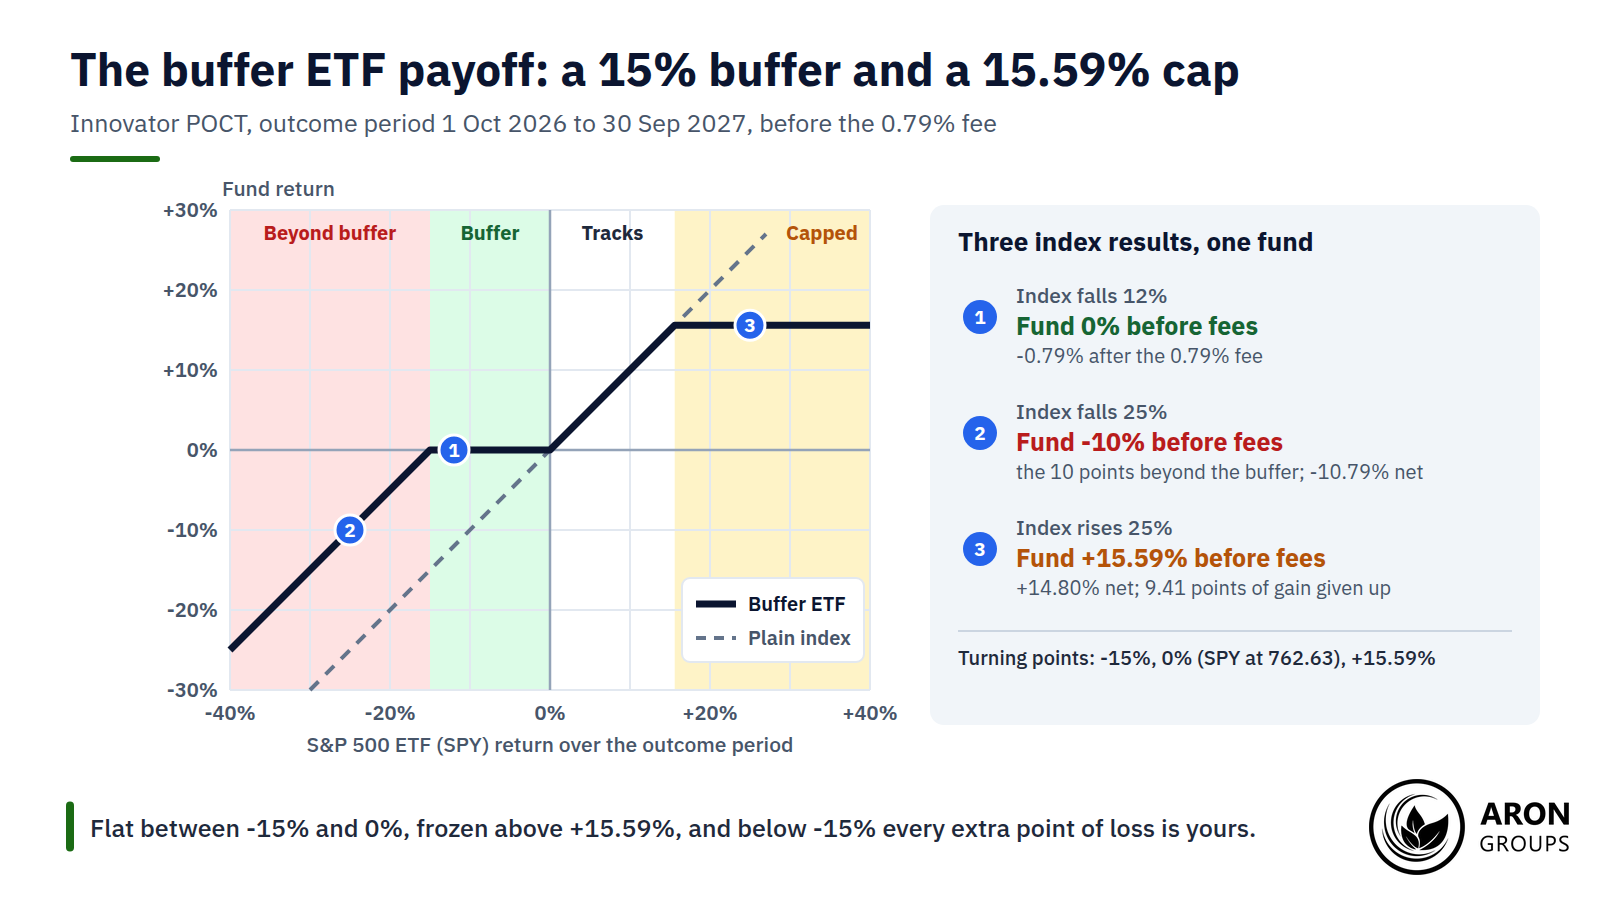
Held for the full period, POCT returns 0% if the index falls 12%, -10% if it falls 25% and 15.59% if it rises 25%, before fees.

Mini Example: POCT's October 2026 Series

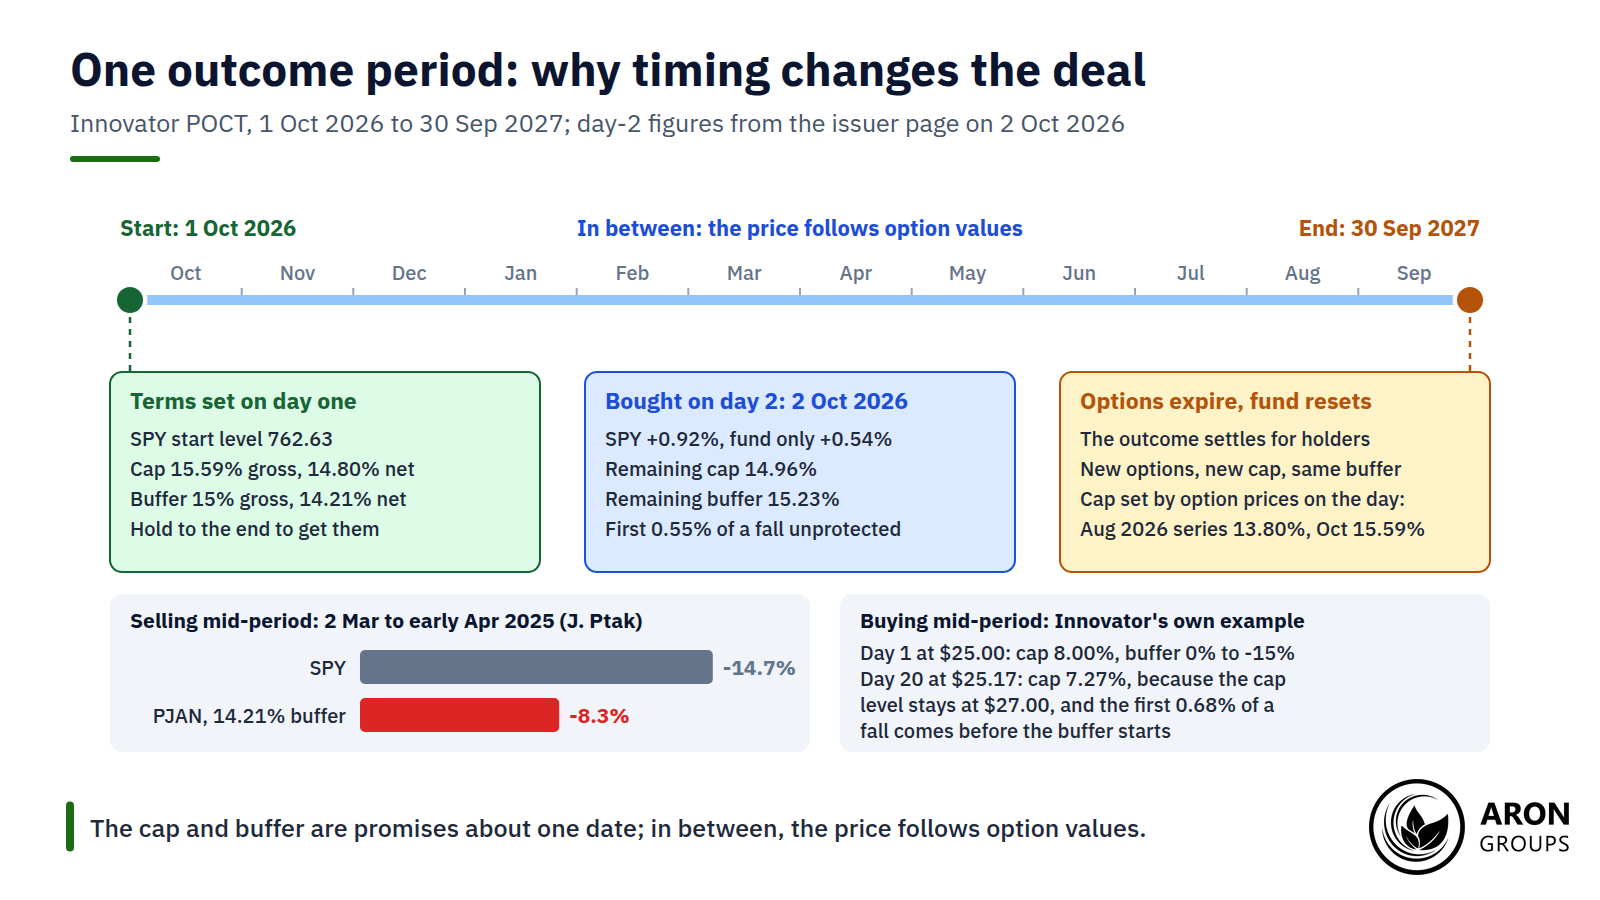
POCT’s outcome period runs from 1 October 2026 to 30 September 2027, starting from an SPY price of 762.63. Its terms are a 15% buffer and a 15.59% cap before fees, or 14.21% and 14.80% after the 0.79% management fee. Take an investor who buys on day one and holds to the end.

If SPY ends the period 12% lower, at about 671, the buffer absorbs the whole fall and the fund returns 0% before fees, roughly -0.8% after them. If SPY falls 25%, to about 572, the buffer covers the first 15 points and the fund loses the other 10%, about -10.8% after fees.

If SPY rises 25%, to about 953, the fund stops at its 15.59% cap, or 14.80% net. The investor forfeits 9.41 points of price gain plus roughly 1% of dividends. In the two falling cases the buffer saved 12 and 15 points; in the rising case the cap cost more than 10.

The Collar Behind the Buffer and the Cap

The payoff comes from option legs that together work like a collar, a hedge that pairs bought protection with sold upside. The SEC’s introduction to options defines a put as the right to sell shares at the strike price for a set period. A call is the right to buy them.

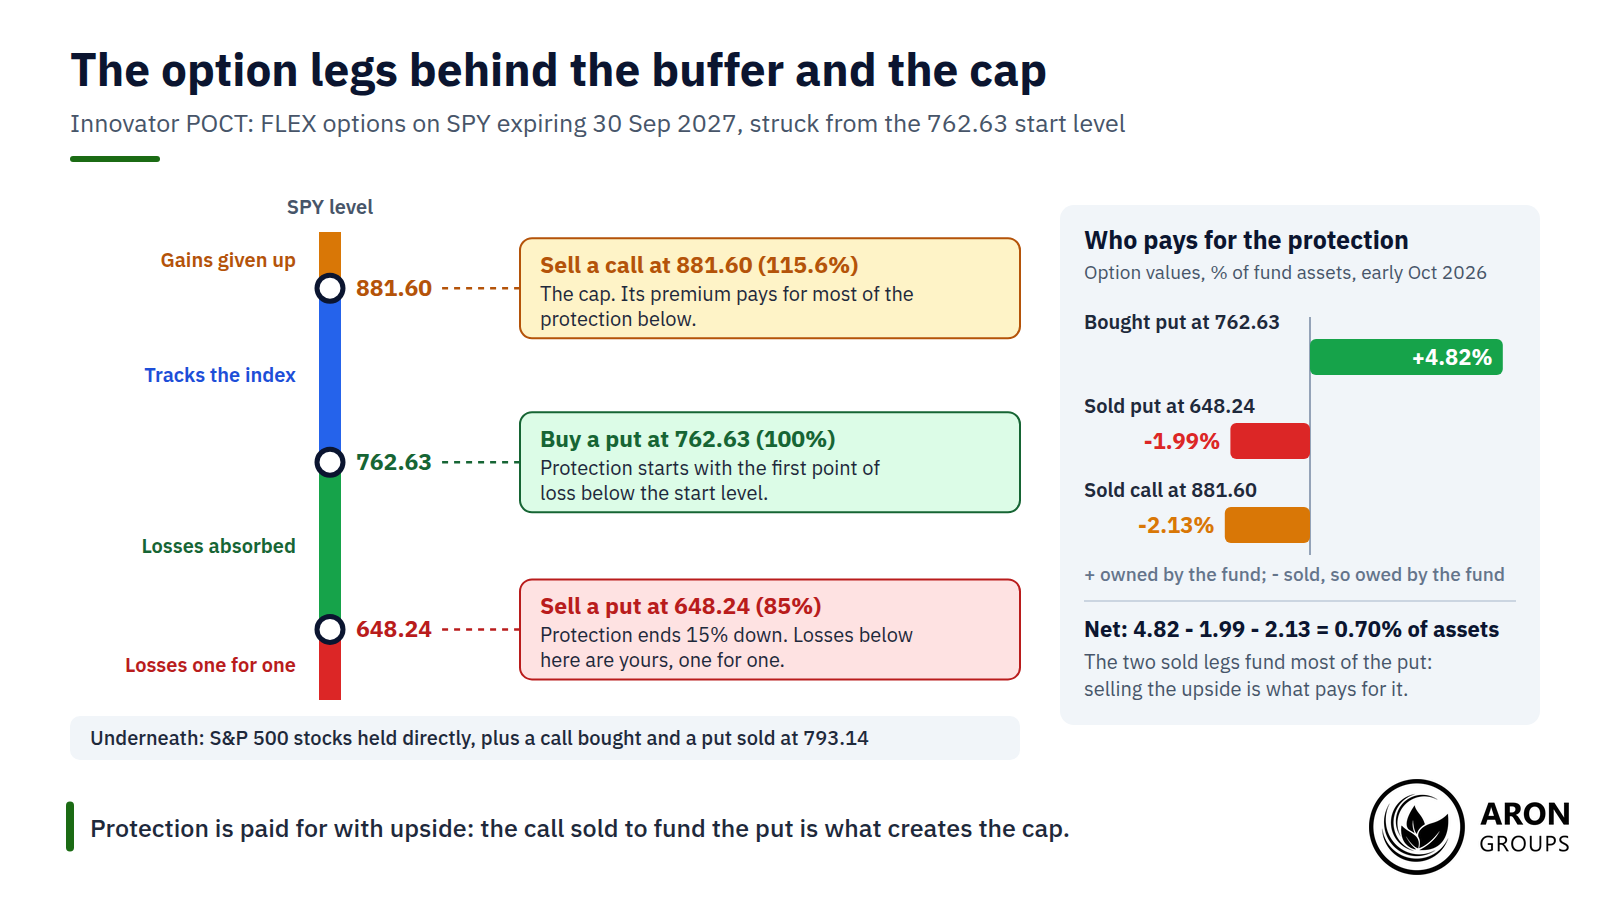
POCT’s October holdings show the legs, all expiring on 30 September 2027. Alongside S&P 500 shares, the fund buys a put at 762.63, the starting level, so protection begins with the first point of loss. It sells a put at 648.24, 15% lower, where protection stops.

That put spread is paid for mainly by selling a call at 881.60, 15.6% above the start. Any gain above that strike belongs to the call’s buyer, and that is the cap. In early October the bought put was valued at 4.82% of the fund’s assets, against 1.99% and 2.13% for the put and the call it sold.

Two sold options pay for most of the bought put, which is why protection costs you the upside above 881.60.

Why the cap changes every period

The buffer is chosen in advance, but the cap is whatever option prices allow on reset day. Those prices move with interest rates, volatility and dividends, so Innovator’s 15% buffer bought a 13.80% cap in August 2026 and 15.59% in October.

The Outcome Period: Why Timing Decides Your Result

The stated buffer and cap apply cleanly only to an investor who buys on the first day and holds to the last. POCT’s October 2026 summary prospectus says the outcomes may only be realised by investors who hold shares from the outset of the outcome period until its conclusion.

In between, the fund’s price reflects options that still carry time value. A fund can therefore show a loss after a sharp fall that the buffer would fully absorb at expiry. After a strong rally, it can lag well short of its cap.

Buying mid-period

A new buyer inherits the remaining terms, not the original ones. On 2 October 2026, day two of POCT’s period, SPY was up 0.92% and the fund 0.54%. A buyer that day got a remaining cap of 14.96%, and their buffer began only after a 0.55% fall. Innovator’s own investor guide shows the effect at day 20: a buyer at $25.17 rather than $25.00 sees an 8% cap shrink to 7.27%.

Selling early

Early sellers face the reverse problem, because the options have not yet paid out. Analyst Jeffrey Ptak found that from 2 March to early April 2025, SPY fell about 14.7%. Innovator’s PJAN, which buffers the first 14.21% of losses, fell 8.3%. Had the index stayed there until the period ended in December, most of that fall would have been absorbed.

What happens at the reset

When the period ends, the options expire, the outcome settles and the fund buys a new package with a fresh cap. It can be held through many periods, but each starts from the price on reset day. First Trust’s FOCT ends its current period on 16 October 2026 with only 0.69% of its net cap left and 9.70% of its buffer.

By day two of the period, POCT's remaining cap had slipped to 14.96%, and a new buyer's first 0.55% of losses was unprotected.

Types of Buffer ETFs

Issuers sell the same structure at different strengths, and the rule is simple: the bigger the buffer, the lower the cap. For the year from 1 October 2026, iShares estimated a cap of 18.20% to 20.26% for STEN, its 10% buffer fund. The same day Innovator set 15.59% for POCT’s 15% buffer and 9.43% for ZOCT, which buffers 100%.

Deep and 100% buffers

A deep buffer protects more, or protects a lower band. Innovator’s Ultra Buffer covers losses between 5% and 35%. Funds with a 100% buffer, such as ZOCT and iShares’ MAXJ, aim to absorb all or nearly all of an index fall over the period. The price is a single-digit cap: MAXJ started its current year on 1 July 2026 with an 8.04% cap.

Q: Can you lose money in a 100% buffer ETF?
A: Yes. Even over a full period the fee comes on top: on 2 October 2026 ZOCT’s remaining buffer was 99.66% before fees and 98.87% after them. You can lose more if you buy above the starting level or sell before the end, while the options still carry time value.

Laddered, quarterly and uncapped funds

Laddered funds tackle the timing problem by spreading entry dates. First Trust’s BUFR holds 12 monthly buffer ETFs in equal weights, so about a twelfth of the money resets each month. It held $10.8 billion on 1 October 2026 and costs 0.95% a year, including the underlying funds’ fees.

Other designs change the clock or the cap. PGIM sells quarterly funds with periods of about three months and buffers from 5% to 20%. Allianz’s Buffer15 Uncapped funds replace the cap with a spread: they share in gains only beyond a set threshold, while buffering the first 15% of losses.

Why Investors Use Buffer ETFs

The main appeal is behavioural. A cushioned loss is easier to sit through, and an investor who stays invested avoids the costly habit of selling near the bottom. For someone close to retirement, capital preservation and a smaller drawdown just before withdrawals begin can matter more than a few points of upside.

The cushion shows up in long-run data. In a Man Group analysis republished in September 2026, a Cboe S&P 500 buffer index had a worst drawdown of 44%, against 56% for the S&P 500. It also trailed equities by about 2% a year, which is the price of that smoother ride.

Buffer ETF vs Covered Call ETF vs Plain Index Fund

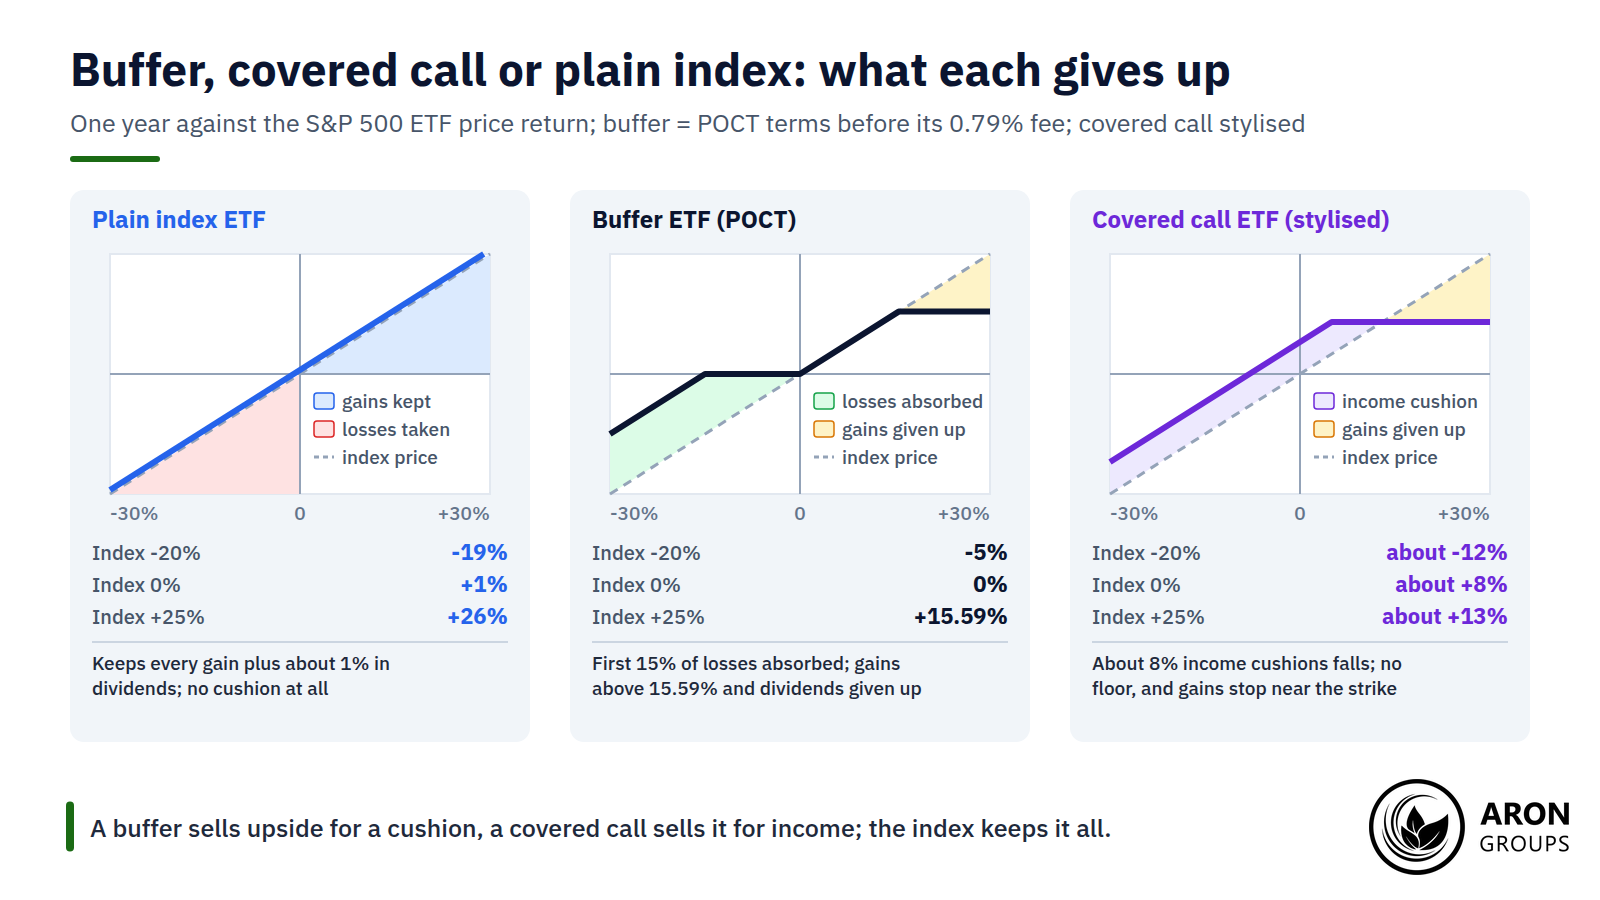
Buffer funds are often confused with covered call funds, because both sell calls and both give up upside. The difference is what the premium buys. A buffer fund spends it on put protection, while a covered call fund pays it out as income and keeps the full downside.

FeatureBuffer ETF (POCT)Covered call ETF (JEPI)Plain index ETF (SPY)
Main goalProtection against a defined slice of lossesMonthly incomeThe full market return
DownsideFirst 15% absorbed over the full period; losses beyond that one for oneNo floor; income only cushions lossesEvery point of loss
UpsideCapped at 15.59% before fees to 30 Sep 2027Limited by the calls soldUnlimited
DividendsNot paid on top of the outcomePaid out with option income; 8.14% trailing yieldPaid out; 0.99% yield
Expense ratio0.79%0.35%0.09%
Holding periodTerms apply only from start to end of the periodAnyAny
Net assets (Oct 2026)About $982 million$45.7 billion$817 billion

Buffer, covered call and plain index ETFs compared. Sources: Innovator (POCT, 2 October 2026); JEPI and SPY data at the close on 2 October 2026.

The returns follow the shapes. In the year to 2 October 2026, SPY returned 16.38% including dividends, while JEPI, which sells away part of each rally for income, returned 6.88%.

Only the plain index keeps every point of upside and the dividend; the buffer trades both for a cushion, and the covered call trades upside for income.

Match the tool to the priority: protection, income or growth. A buffer ETF suits someone who would otherwise sell in a crash. An investor who can sit through a bear market has historically done better with the index.

The Honest Limits of Buffer ETFs

A buffer ETF does not remove market risk; it moves it around. Some downside goes away, some upside goes with it, and a fee is charged for the swap.

Capped upside in strong markets

In a bull market you forfeit everything above the cap. First Trust’s FOCT, with a 15.09% cap, returned 9.59% in the first eight months of 2026, against 13.14% for the S&P 500. In NYU Stern’s calendar-year data with dividends, the index beat a 15.59% cap in 49 of the 98 years from 1928 to 2025.

No dividend stream on top

Most buffer ETFs hold options rather than shares, so they track price return and the dividends never reach you. Innovator’s 2026 prospectuses let its funds hold the stocks instead. The dividends are then counted inside the cap and buffer at an assumed rate, not paid on top. With the S&P 500 yielding about 1.05% on 2 October 2026, near a record low, the drag is smaller than in past decades, but permanent.

Higher fees

Fees run several times those of a plain index fund: 0.79% for POCT, 0.85% for FOCT, 0.95% for BUFR and 0.50% for MAXJ. SPY itself charges 0.09%. Headline caps are usually quoted before fees, so a 15.59% cap becomes 14.80% in your pocket.

Not principal protection

The buffer covers a defined range, not everything. POCT’s prospectus says shareholders bear every loss beyond 15% one for one; in its own table, an index fall of 100% leaves the fund down 85%.

Lower long-term returns

Over long periods the cap, the fees and the missing dividends add up. In NYU Stern’s data the S&P 500 fell in 26 of those 98 years and lost more than 15% in only seven. A 15% buffer would have fully absorbed the loss in 19 years, while a 15.59% cap would have bitten in 49.

Access is a practical limit too. Platform access to these US-listed funds varies by country, and investors in restricted regions face added legal, access and custody risk.

Where Aron Groups Fits

Aron Groups does not offer ETFs or options, so it cannot sell you a buffer fund or the collar inside one. It does offer index CFDs on MetaTrader 5, which track the index price continuously rather than settling once a year. A CFD trader shapes risk with stop-losses and position sizing rather than a cap.

There is no buffer, though. A stop can fill below its level when prices gap. Leverage also brings a margin call at 100% margin level and a stop-out at 50%, or 40% on Islamic and VIP accounts. In the EU, ESMA’s 2018 rules cap retail leverage on major index CFDs at 20:1. A demo account and a Nano account, commission-free from 0.0001 lots, let you test sizing at small scale.

Conclusion

A buffer ETF is a trade, not a free lunch. It gives up the best of a strong year, and the index’s dividends, for a cushion under the first 10% to 20% of losses.

Its promises are about two dates, the first day and the last. Bought or sold in between, the fund behaves like the options inside it, and even a 100% buffer can show a loss.

Held from reset to reset by an investor who would otherwise sell in a crash, a buffer ETF can do its job. Investors who can sit through falls have usually earned more from the plain index.

Frequently Asked Questions

Short answers to common questions about buffer ETFs.

Are buffer ETFs a good investment?

They can suit investors who value a smaller drawdown more than full upside, such as savers near retirement. Over long periods they have tended to lag the index because of the cap, fees and missing dividends. They are a risk tool, not a return booster.

Do buffer ETFs pay dividends?

Not the way an index fund does. Most hold options and track price return only, while Innovator’s funds may hold the stocks but count the dividends inside the cap and buffer. Distributions, where they occur, are usually annual and small.

What happens when a buffer ETF's outcome period ends?

The options expire, the outcome is settled and the fund rolls into new options with a fresh cap and the same buffer. You can keep holding, but the new terms are set from the price on the reset day, not your original entry price.

Is a buffer ETF the same as a stop-loss?

No. A buffer settles on one date and caps your gains in return for absorbing a set slice of losses. A stop-loss closes a position whenever its level trades and leaves gains uncapped. But it can fill at a worse price when markets gap, and it does not get you back in if prices recover.

Continue Reading
not-found
calendar 19 October 2026
Rate this article

Leave a Reply

Your email address will not be published. Required fields are marked *

No thanks