
icon icon Home
icon icon Accounts
icon icon Quick start
icon icon Symbols

Cost-Push Inflation Explained: Causes, Real Examples, How It Differs from Demand-Pull, and Why It Drives Stagflation

Author
Abe Cofnas
Abe Cofnas
calendar Last update: 6 November 2026
watch Reading time: 10 min

Cost-push inflation is a rise in the general price level caused by higher production costs rather than stronger demand. When energy, raw materials, wages, imported inputs or taxes cost more, firms raise prices to protect their margins. Because the pressure starts on the supply side of the economy, prices tend to rise while output falls.

Since the conflict involving Iran began on 28 February 2026, tanker traffic through the Strait of Hormuz has been severely constrained. US consumer energy prices rose 20.4% in the year to September, and headline inflation was 3.7%, while core inflation was 2.6% (BLS, 14 October). US crude futures settled at $101.41 a barrel on 16 October.

This guide covers the causes, the AD-AS graph and the contrast with demand-pull inflation. It then tests the idea against three energy shocks and Milton Friedman’s critique.

bookmark
Key Takeaways
  • Cost-push inflation is a rise in prices caused by higher production costs, such as energy, materials, wages or taxes, rather than by stronger demand.
  • On an AD-AS graph, short-run aggregate supply shifts left, so the price level rises while real output falls; demand-pull inflation lifts both.
  • In the year to September 2026, US consumer energy prices rose 20.4% and headline inflation was 3.7%, while core inflation was 2.6%.
  • An adverse supply shock is the usual trigger of stagflation, but Federal Reserve History traces the 1970s Great Inflation to excessive money growth.
  • Milton Friedman argued that costs cannot keep prices rising without more money; a one-off cost shock raises the price level once.

What Is Cost-Push Inflation?

The cost-push inflation definition is simple: cost-push inflation occurs when costs rise across much of the economy and firms pass them on. Prices climb even though customers are not buying more.

sms-star

Risk Disclosure
Trading forex and CFDs carries a high level of risk and can result in the loss of all your capital. This content is educational and is not investment advice. Never risk money you cannot afford to lose.
Where It Sits Among the Types of Inflation

Economists sort the types of inflation by where the pressure starts. Federal Reserve History notes that 1970s economists began to separate “demand-pull” inflation, driven by spending beyond what the economy could produce, from the “cost-push” kind. In its words, inflation “could also be pushed higher from supply disruptions, notably originating in food and energy markets”. A third type, built-in inflation, comes from expectations and wage setting that carry past inflation forward.

How Rising Costs Become Higher Prices

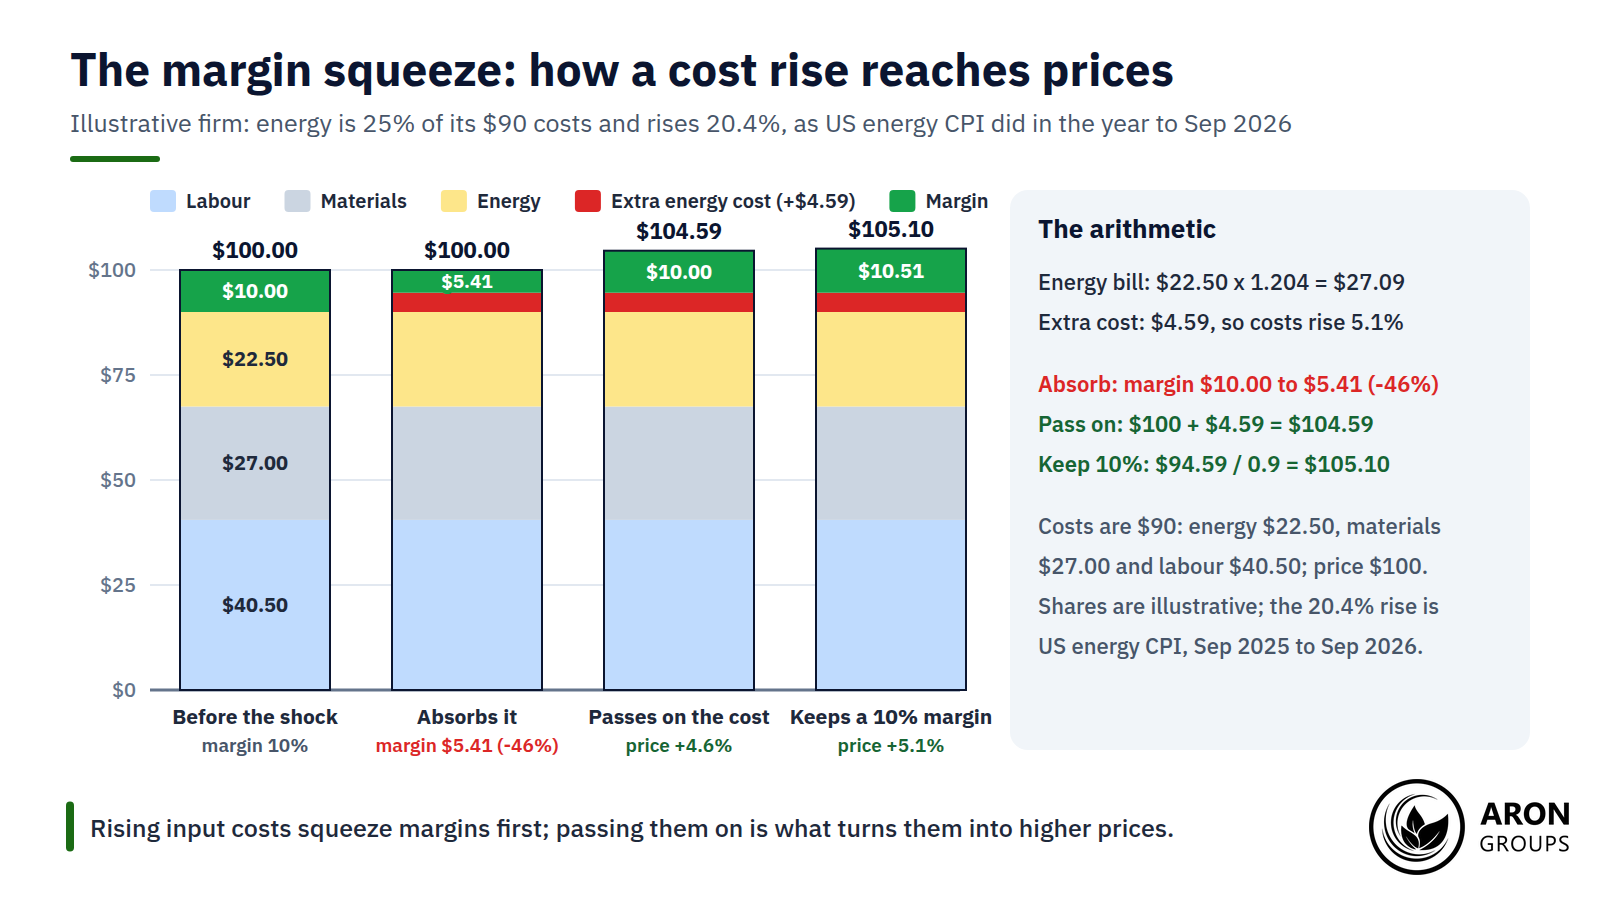
The mechanism runs through profit margins. When an input gets dearer, a firm’s cost per unit rises before its selling price moves, so its margin is squeezed. It can absorb the hit, raise its prices or do some of each. A cost rise shared by all its rivals is easier to pass on.

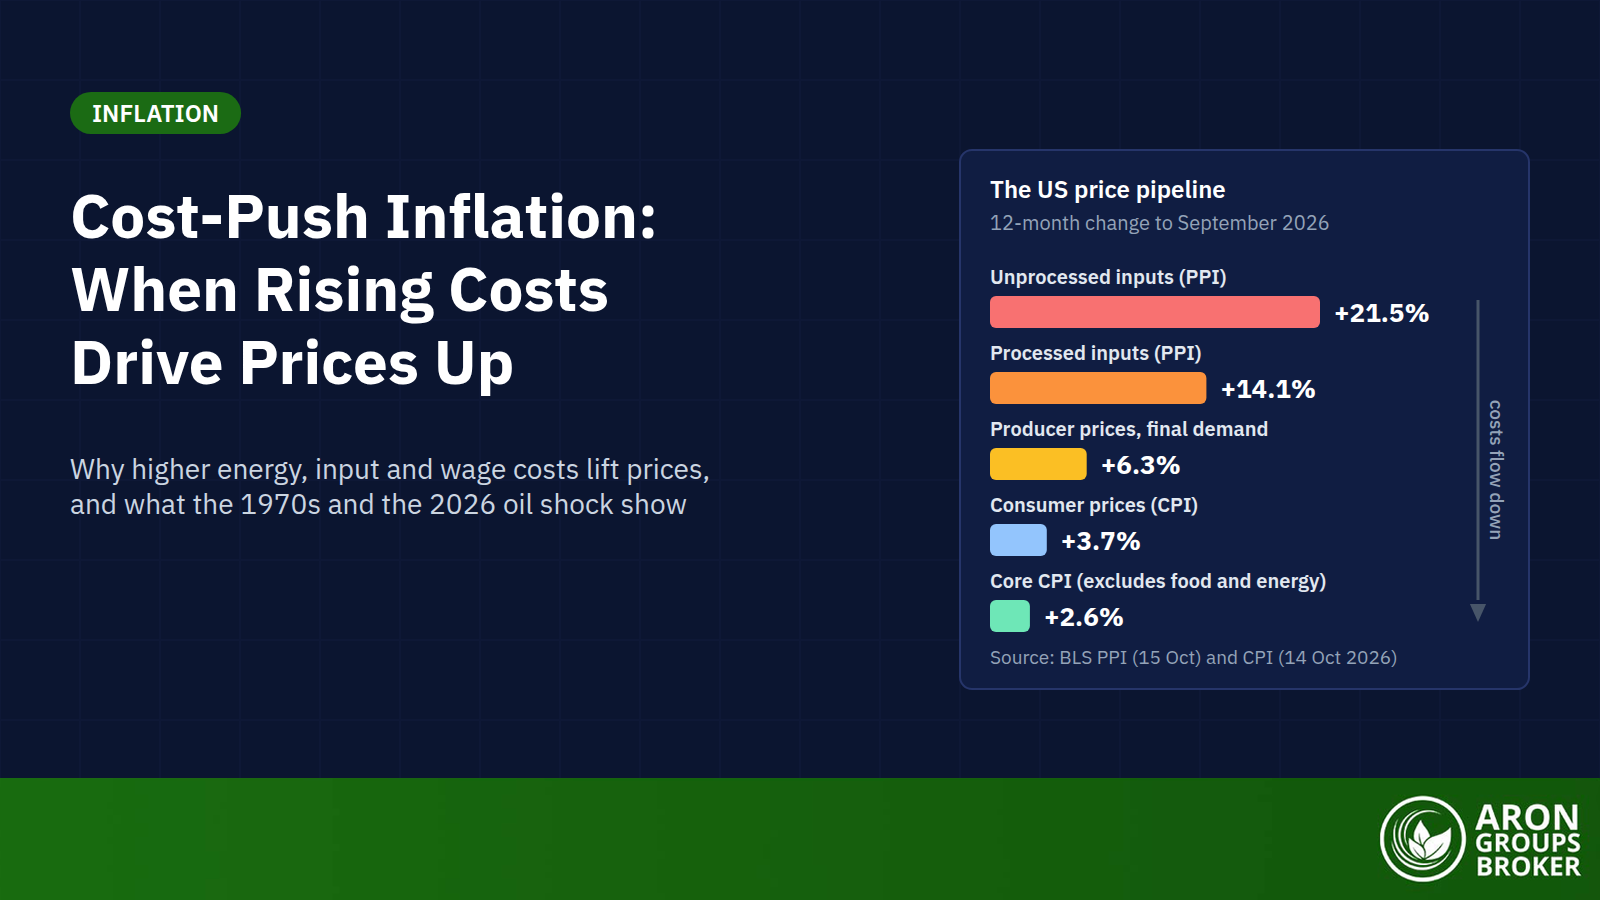
Costs also travel down the supply chain. In the year to September 2026, US producer prices of unprocessed inputs such as crude oil rose 21.5% (BLS, 15 October). Processed inputs rose 14.1% and final demand 6.3%. Inputs are only part of each stage’s costs, so the rise thins out along the way: consumer prices rose 3.7%.

Mini Example: When Energy Is a Quarter of Costs

An illustrative firm sells a product for $100. Its costs are $90: $22.50 of energy, $27.00 of materials and $40.50 of labour, leaving a $10 margin. Now its energy bill rises 20.4%, as US consumer energy prices did in the year to September 2026.

Energy now costs $27.09, so total costs rise $4.59, or 5.1%. If the firm absorbs the rise, its margin shrinks to $5.41, a fall of 46%. If it passes on the extra cost, the price rises 4.6% to $104.59; keeping a 10% margin needs $105.10, up 5.1%.

Across many firms and their suppliers, the same arithmetic lifts the price level.

Absorbing a 20.4% rise in energy costs cuts the illustrative firm's margin by 46%; passing it on lifts its price 4.6% to 5.1%.

What Causes Cost-Push Inflation?

The usual triggers fall into five groups, and they often overlap.

Oil and Energy Supply Shocks

A supply shock is a sudden fall in the supply of a key input. Energy usually matters most, because almost every product needs it to be made or moved. In its 6 October outlook, the US Energy Information Administration said Brent averaged $114 a barrel in September 2026. The spot price touched $131 on 15 September.

Supply Chain Disruptions

Bottlenecks raise costs even when raw materials are plentiful. In July 2021, the Cleveland Fed reported that carmakers cited “insufficient materials, including a lack of semiconductors” for running below capacity. Prices rose at the same time: US used car and truck prices were 45.2% higher in June 2021 than a year earlier. The New York Fed’s Global Supply Chain Pressure Index read 1.28 standard deviations above its average in September 2026, against 4.43 in December 2021.

Rising Wages and the Wage-Price Spiral

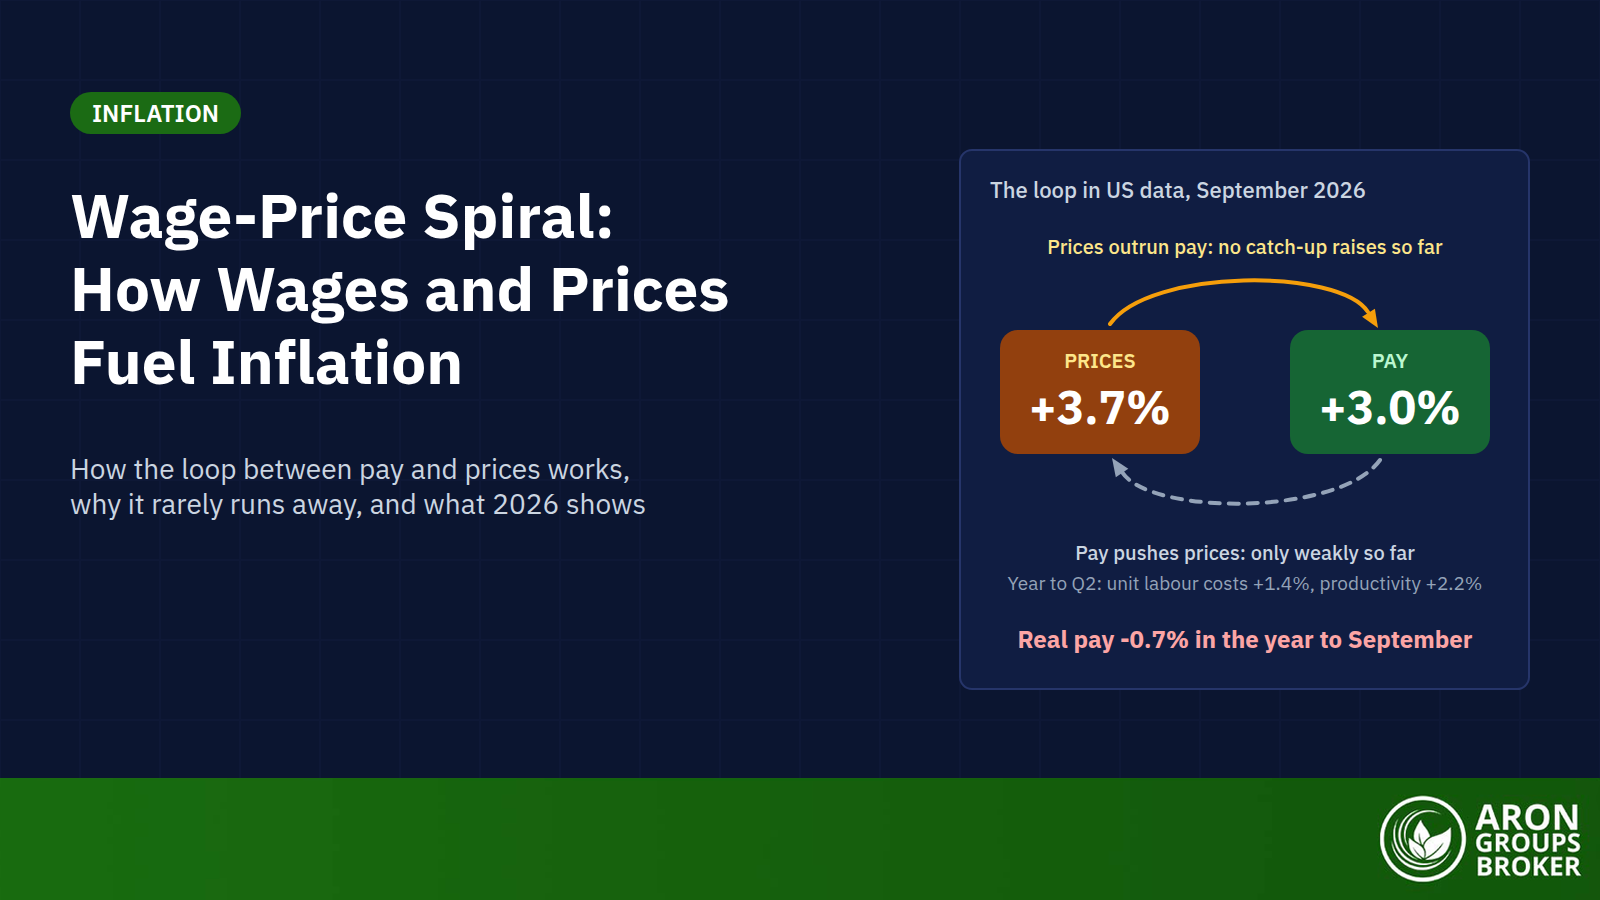
Pay is the biggest cost for many firms. When wages grow faster than productivity, unit labour costs rise, and price rises can feed new pay claims in a wage-price spiral. The 2026 data do not point to wages. US unit labour costs rose 1.4% in the year to the second quarter, and real hourly earnings fell 0.7% in the year to September.

Imported Inflation and a Weaker Currency

A weaker currency, or depreciation, raises the local price of imports priced in foreign currencies. Japan’s import prices rose 24.5% in yen terms in the year to September 2026, but 17.9% in the contracts’ own currencies (Bank of Japan, preliminary). The gap reflects the weaker yen, which turns the same foreign price into more yen.

US import prices rose 8.1% in the year to September, led by fuel at 34.5% (BLS, 16 October), although the dollar strengthened. It rose 3.5% against the euro and 4.5% against the yen in the year to 16 October (ECB reference rates).

Taxes and Tariffs

Taxes on production and tariffs on imported inputs raise costs directly. Studying the 2018 US tariffs, economists Mary Amiti, Stephen Redding and David Weinstein found “complete pass-through of the tariffs into domestic prices of imported goods”. The Yale Budget Lab put the average statutory US tariff rate at 11.0% on 24 August 2026. It estimated that current-law tariffs would ultimately raise consumer prices by about 0.7%.

The Cost-Push Inflation Graph: How AD-AS Shows It

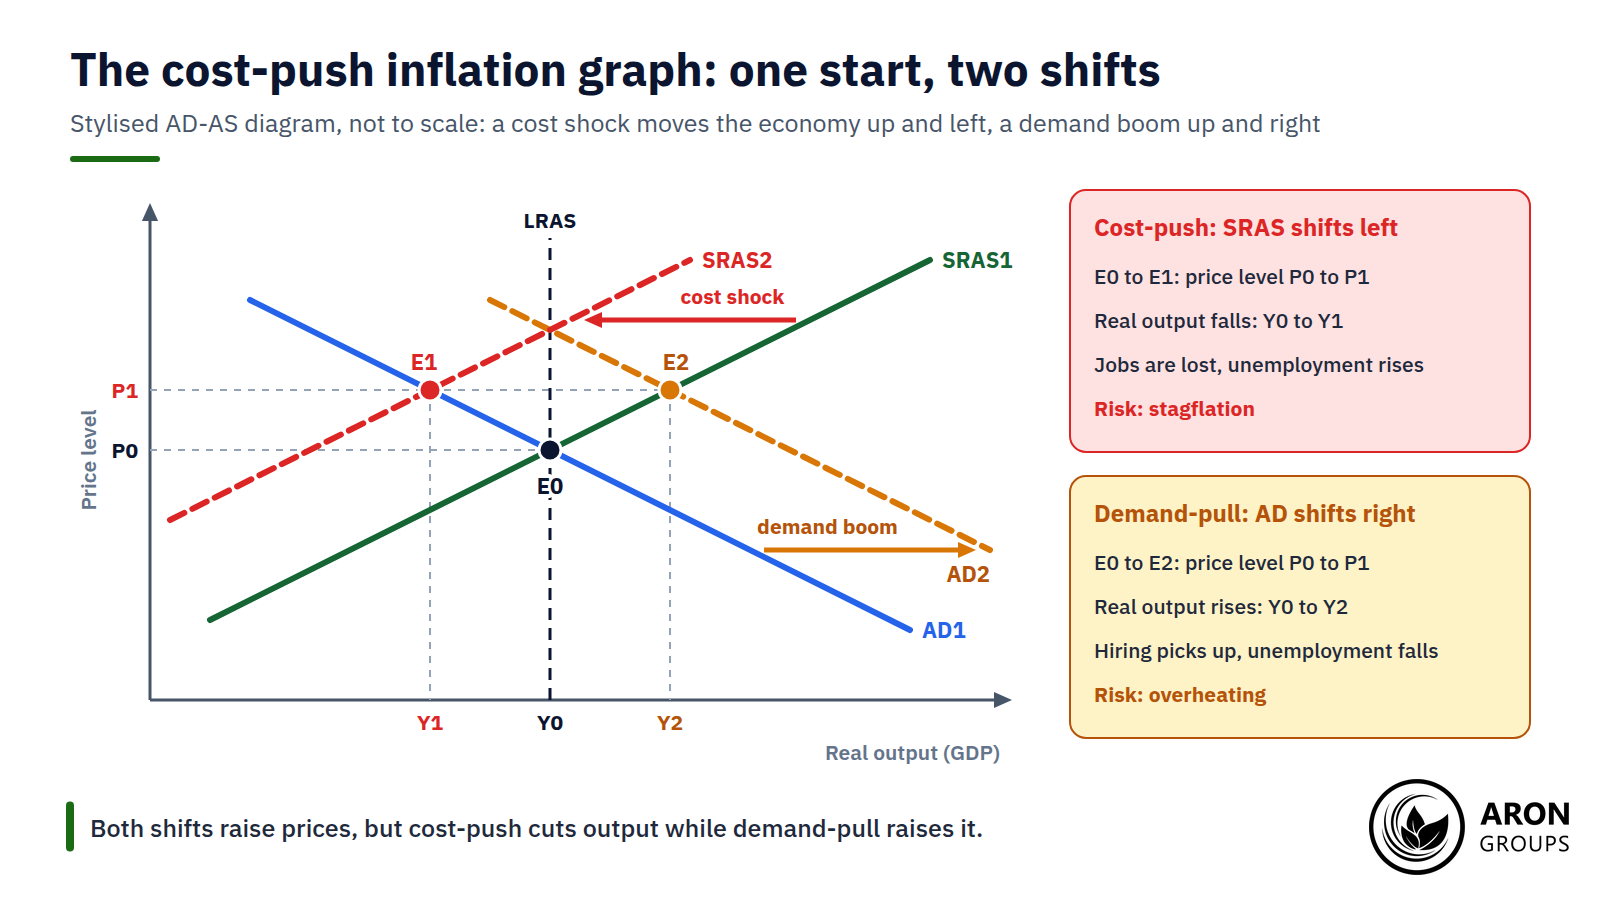
The aggregate demand and aggregate supply (AD-AS) diagram plots the price level against real GDP. Aggregate demand slopes down: at a higher price level, the same money buys less, so demand for real output falls. Short-run aggregate supply (SRAS) slopes up, because some costs, such as wages, adjust slowly, so higher prices make extra output profitable.

A cost shock shifts SRAS to the left: at every price level, firms now supply less. The new equilibrium sits higher and further left, so the price level rises while real output falls. Demand-pull inflation is the mirror image: aggregate demand shifts right, and prices and output rise together.

On a cost-push inflation graph, supply shifts left and output falls; on a demand-pull graph, demand shifts right and output rises.

Why Output Falls as Prices Rise

Higher costs make some production unprofitable at the old price, so firms cut output and hiring. Households lose purchasing power too, because the same income buys less.

Cost-Push vs Demand-Pull Inflation

Demand-pull inflation happens when too much demand chases too few goods. Cost-push inflation comes from the other side, as costs push prices up. Demand-pull tends to arrive with a boom; cost-push tends to arrive with a squeeze.

The two often mix, but they leave different fingerprints in the data.

FeatureCost-push inflationDemand-pull inflation
Where it startsSupply side: energy, materials, wages, imports or taxes cost moreDemand side: spending outruns what the economy can produce
AD-AS graphShort-run aggregate supply shifts leftAggregate demand shifts right
PricesRiseRise
Output and jobsOutput falls; unemployment tends to riseOutput rises; unemployment tends to fall
Typical triggersOil shocks, supply chain breakdowns, a weaker currency, tariffsFast credit or money growth, fiscal stimulus, reopening demand
First signsEnergy, import and producer prices jump; core inflation lagsPrice rises spread across goods and services; labour markets tighten
Policy trade-offHard: tightening curbs inflation but deepens the downturnMilder: tightening cools demand and prices together
Examples1973 to 1974 oil embargo; 2026 Strait of Hormuz shockReopening boom of 2021 (in part)

Cost-push and demand-pull inflation compared. Sources: Federal Reserve History, FRBSF, BLS.

Adam Shapiro of the San Francisco Fed separates them statistically. Spending categories count as supply-driven when unexpected changes in price and quantity move in opposite directions, and demand-driven when they move together.

Real Examples of Cost-Push Inflation

Three episodes show the pattern and its limits.

The 1970s Oil Shocks

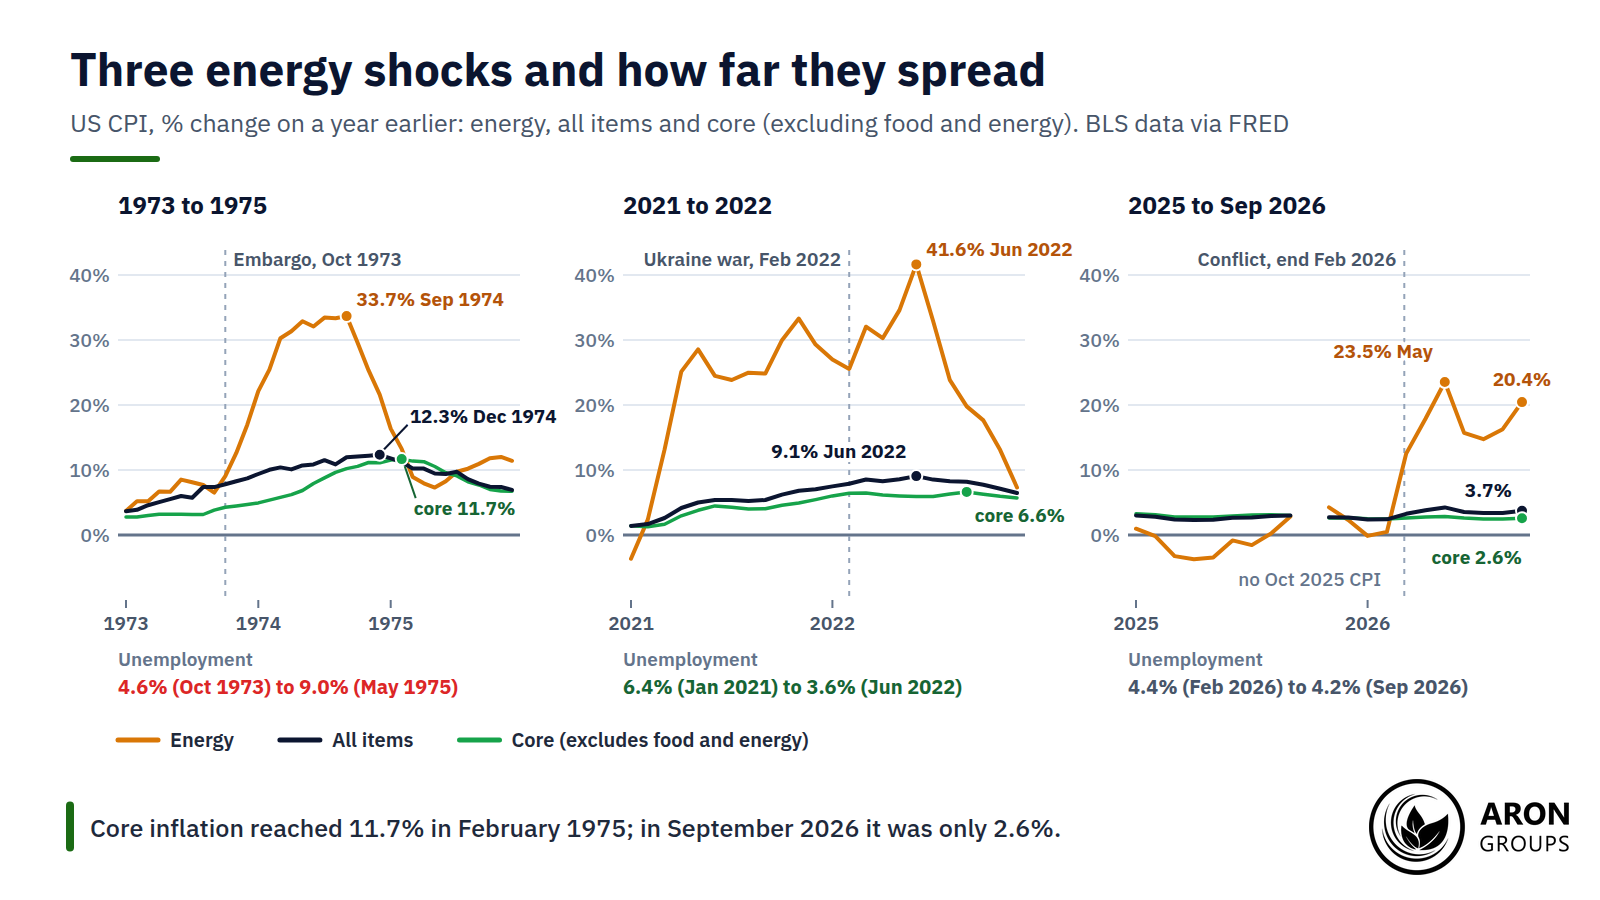
The textbook case began on 19 October 1973, when Arab oil producers in OAPEC imposed an embargo on the United States. Federal Reserve History notes that their production cuts nearly quadrupled the price of oil, from $2.90 a barrel to $11.65 in January 1974. It adds that a growing share of the world oil market gave OPEC much more influence over prices. US consumer energy prices were 33.7% higher in September 1974 than a year earlier, and headline inflation reached 12.3% in December.

Unemployment rose from 4.6% in October 1973 to 9.0% in May 1975. A second shock followed when Iran’s revolution cut its oil output, and oil prices more than doubled between April 1979 and April 1980. US inflation hit 14.8% in March 1980. Yet inflation was already 5.6% in the year to December 1970, and 7.4% in the year to August 1973, before the embargo.

2021 to 2022: Part Cost-Push, Part Demand-Pull

The post-pandemic surge mixed both kinds. Chip shortages, clogged supply chains and Russia’s invasion of Ukraine in February 2022 pushed costs up. US energy inflation peaked at 41.6% in June 2022, when headline inflation reached 9.1%. Demand was strong too: unemployment fell from 6.4% in January 2021 to 3.6% in June 2022.

In June 2022, Shapiro estimated that supply factors explained about half of the run-up in PCE inflation. Demand factors explained about one-third, and the rest was ambiguous. In 2023, Ben Bernanke and Olivier Blanchard found that most of the surge came from shocks that raised prices directly, not from wages. Tight labour markets, they found, mattered more as those shocks faded.

Energy inflation peaked at 33.7% in 1974 and 41.6% in 2022 and reached 23.5% in May 2026; core topped 10% only in the first episode.

2026: The Strait of Hormuz Oil Shock

A BIS bulletin in August ranked the 2026 energy shock among the most significant since the 1990s. Global oil supply fell nearly 15% in the five months after the war began, it found. US energy inflation jumped from 0.5% in February to 23.5% in May and was 20.4% in September, with petrol up 34.2%.

Headline inflation rose from 2.4% to 4.2% over the same months and was 3.7% in September. Core inflation barely moved, from 2.5% in February to 2.6% in September, and unemployment was 4.2%. So far, the shock has lifted energy and headline prices without spreading widely into core consumer prices. But producer prices excluding food, energy and trade services rose 5.0% in the year to September.

How Cost-Push Inflation Can Lead to Stagflation

Stagflation is the mix of high inflation, weak growth and rising unemployment. An adverse supply shock is its usual trigger, because it raises prices and cuts output at the same time.

A supply shock alone rarely explains a decade of stagflation. Federal Reserve History traces the Great Inflation to “policies that allowed for an excessive growth in the supply of money”. The oil shocks then hit an economy whose inflation was already high.

The Central Bank's Dilemma

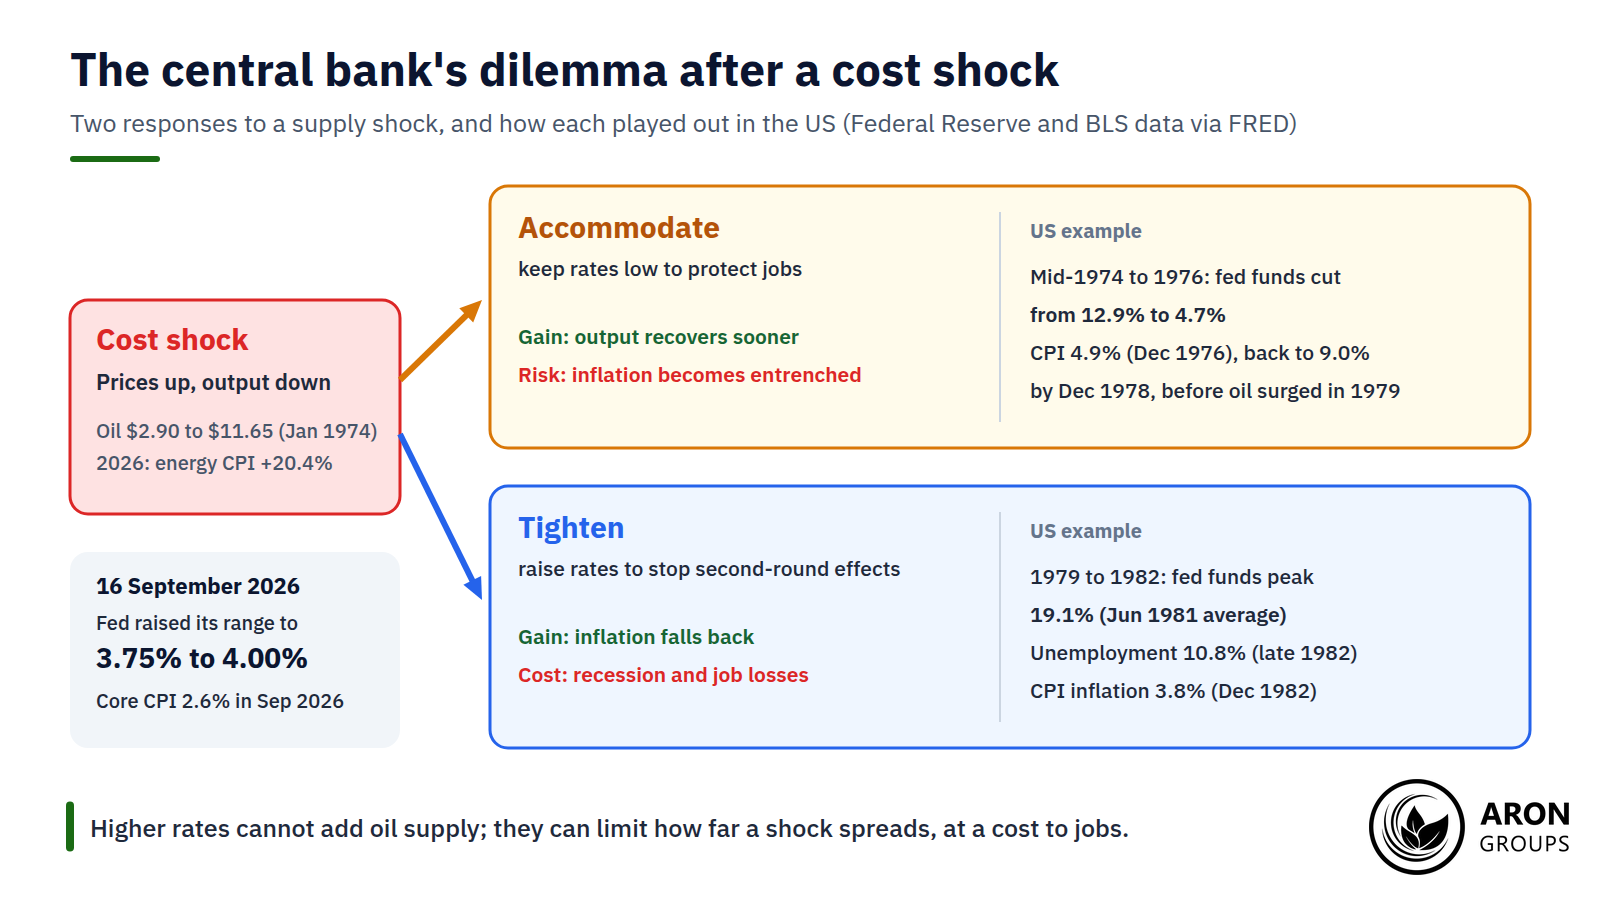
Federal Reserve History describes the 1970s view: oil-driven inflation was “largely beyond the control of monetary policy”, but the rise in unemployment was not. Easing to protect jobs risks entrenching inflation. Tightening can stop second-round effects, in which higher prices feed into wages and other prices, but it costs output and jobs.

On 16 September 2026 the Fed raised its target range for the federal funds rate to 3.75% to 4.00%, saying “Inflation remains elevated”. The statement did not mention oil. Officials meet again on 27 to 28 October, and the December meeting brings a new Fed dot plot.

A reporter asked how rate rises could help when they cannot reopen the Strait of Hormuz. Chair Kevin Warsh replied: “We cannot affect any individual price, whether it be oil prices, whether it be foodstuffs at the grocery store.” The Fed’s aim, he said, is to stop relative price changes from broadening.

After a cost shock, easing risks entrenched inflation and tightening risks recession; US policy from 1974 to 1982 shows both outcomes.

Q: Can higher interest rates bring oil prices down?
A: Not directly, because rates cannot add a single barrel of supply. They cool demand so that an energy shock does not spread into wages and other prices. The price is slower growth and, often, fewer jobs.

What Cost-Push Inflation Means for Gold, Oil and the Dollar

Cost-push episodes tend to move several markets at once. Energy prices lead, and bond yields tend to rise with inflation fears. The dollar’s reaction depends on how hard the shock hits the US compared with other economies.

In September 2026 the EU’s markets regulator described “a climate of persistent inflation and weaker economic growth”. It warned that upbeat valuations, set against worsening conditions, increase the risk of sudden market corrections.

Gold can draw safe-haven demand when a shock has a geopolitical cause, as the history of war and the gold price shows. But it pays no interest, so higher real yields work against it, which is why traders watch CPI and gold together.

The LBMA afternoon gold price was $4,124.50 an ounce on 20 October 2026, down from $4,189.20 on 16 October. A CFTC advisory warns that gold and other precious metals are “highly volatile”, and that leverage can wipe out an investor if prices drop.

The Honest Limits of Cost-Push Inflation

Not every economist accepts cost-push as a source of lasting inflation. Milton Friedman wrote in 1963 that “Inflation is always and everywhere a monetary phenomenon.” In “How Not to Stop Inflation”, a February 1966 speech the Richmond Fed published in 2005, he discussed the “so-called cost-push spiral”. Rising costs, he said, were “the external manifestation of inflation, but not its source.”

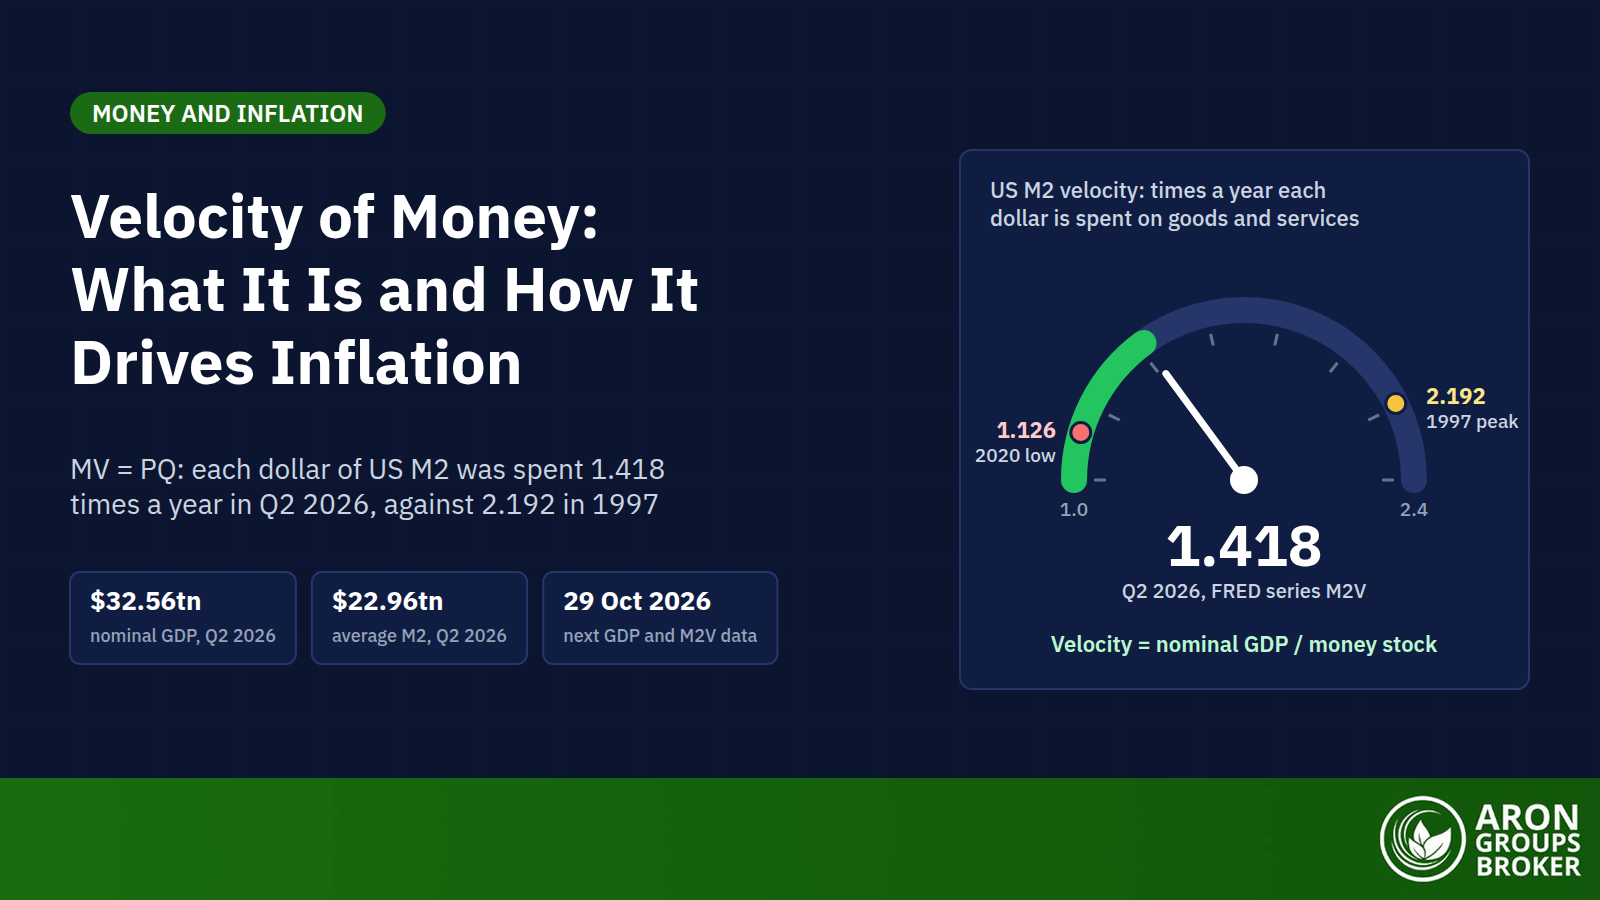
The real dispute is narrower: whether rising costs can keep prices climbing without money and spending growing to pay for them. Friedman’s answer was no: inflation “arises from one and only one reason: an increase in a quantity of money.” In quantity theory terms, sustained inflation needs the money supply and the velocity of money together to grow faster than real output.

The Keynesian Reply

Keynesian economists reply that supply shocks matter in their own right. A leftward shift in SRAS raises prices and cuts output in the short run, and policy chooses between more inflation and less output. The same BIS bulletin found that expectations above target can more than double the inflationary impact of oil supply shocks, compared with anchored expectations.

Attribution is an estimate too. Energy prices can rise on strong demand: the BIS bulletin says the 2021 oil surge was largely driven by reopening demand. Firms can also raise effective prices by cutting quality or service, a form of hidden inflation that indices struggle to capture.

sms-star

Key Point
A cost shock raises the price level once. It tends to become lasting inflation when wages, expectations or easy policy keep prices rising.


Where Aron Groups Fits

Aron Groups does not offer bonds. It does offer CFDs on markets that cost-push episodes tend to move, all on MetaTrader 5. They include forex, gold on XAU/USD, indices, crypto and energy, such as the BRNUSD symbol. Market reactions are tendencies, not rules, and leverage magnifies losses as well as gains.

The Fed decides on 28 October, and October CPI and producer prices follow on 10 and 13 November. The economic calendar lists each release and its time. A Nano account trades from 0.01 nano lots, and a demo account allows practice without real money.

Conclusion

Cost-push inflation is what happens when the supply side of the economy gets more expensive. It raises prices while cutting output, which makes it the usual trigger of stagflation and a hard problem for central banks.

In 2026 the oil shock has lifted energy and headline inflation, while core inflation has stayed between 2.4% and 2.9%. The October CPI report, due on 10 November 2026, will show whether that is still true.

Frequently Asked Questions

Short answers to common questions about cost-push inflation.

What is cost push inflation in simple terms?

It is inflation that starts with rising costs rather than rising demand. When energy, materials or wages get dearer, businesses raise prices to cover them.

What is an example of cost-push inflation?

The 1973 oil embargo is the classic example: oil prices nearly quadrupled and US inflation reached 12.3% in the year to December 1974. In 2026, the Strait of Hormuz shock lifted US consumer energy prices 20.4% in the year to September.

Which is worse, cost-push or demand-pull inflation?

Cost-push is usually harder to handle, because prices rise while output and jobs fall. With demand-pull, higher interest rates cool demand and inflation together, so the trade-off is milder.

Can cost-push inflation become permanent?

A single cost shock raises the price level once, so its effect on the inflation rate fades. It usually becomes persistent when wages, expectations or easy monetary policy keep prices rising, as in the 1970s.

Continue Reading
not-found
calendar 6 November 2026
Rate this article

Leave a Reply

Your email address will not be published. Required fields are marked *

No thanks