
icon icon Home
icon icon Accounts
icon icon Quick start
icon icon Symbols

War and Gold Price: How Conflict and Geopolitical Risk Move the Ultimate Safe Haven

Author
Abe Cofnas
Abe Cofnas
calendar Last update: 9 October 2026
watch Reading time: 9 min

War and gold price describes the link between armed conflict and the price of gold. When fighting starts or looks likely, investors sell risk assets and buy gold, so the price usually jumps. It is a strong tendency rather than a rule, because the first spike often fades once interest rates and the dollar reassert themselves.

It matters now because 2026 has broken the simple story. The Iran war that began on 28 February closed the Strait of Hormuz and pushed Brent crude above $100 a barrel. Yet spot gold closed near $4,140 on 2 October 2026, about 26% below its 28 January record of $5,589. The gap comes from the main drivers of gold beyond fear: a firmer US dollar and a Federal Reserve that raised rates on 16 September.

This guide sets out the four mechanisms linking war to gold, with dated prices from the Gulf War to the 2026 Iran war. It shows why the first move usually fades, when gold falls instead, and how to read rates and the dollar alongside the headlines.

bookmark
Key Takeaways
  • Gold usually rises when a war starts: it gained 10.5% in the 14 days after Iraq invaded Kuwait in 1990 and 7.1% in the 13 days after Russia invaded Ukraine in 2022.
  • The spike tends to fade: by 28 September 2022 gold was 15% below its pre-invasion level, and by 23 March 2026 it was 16% below where it stood when the Iran war began.
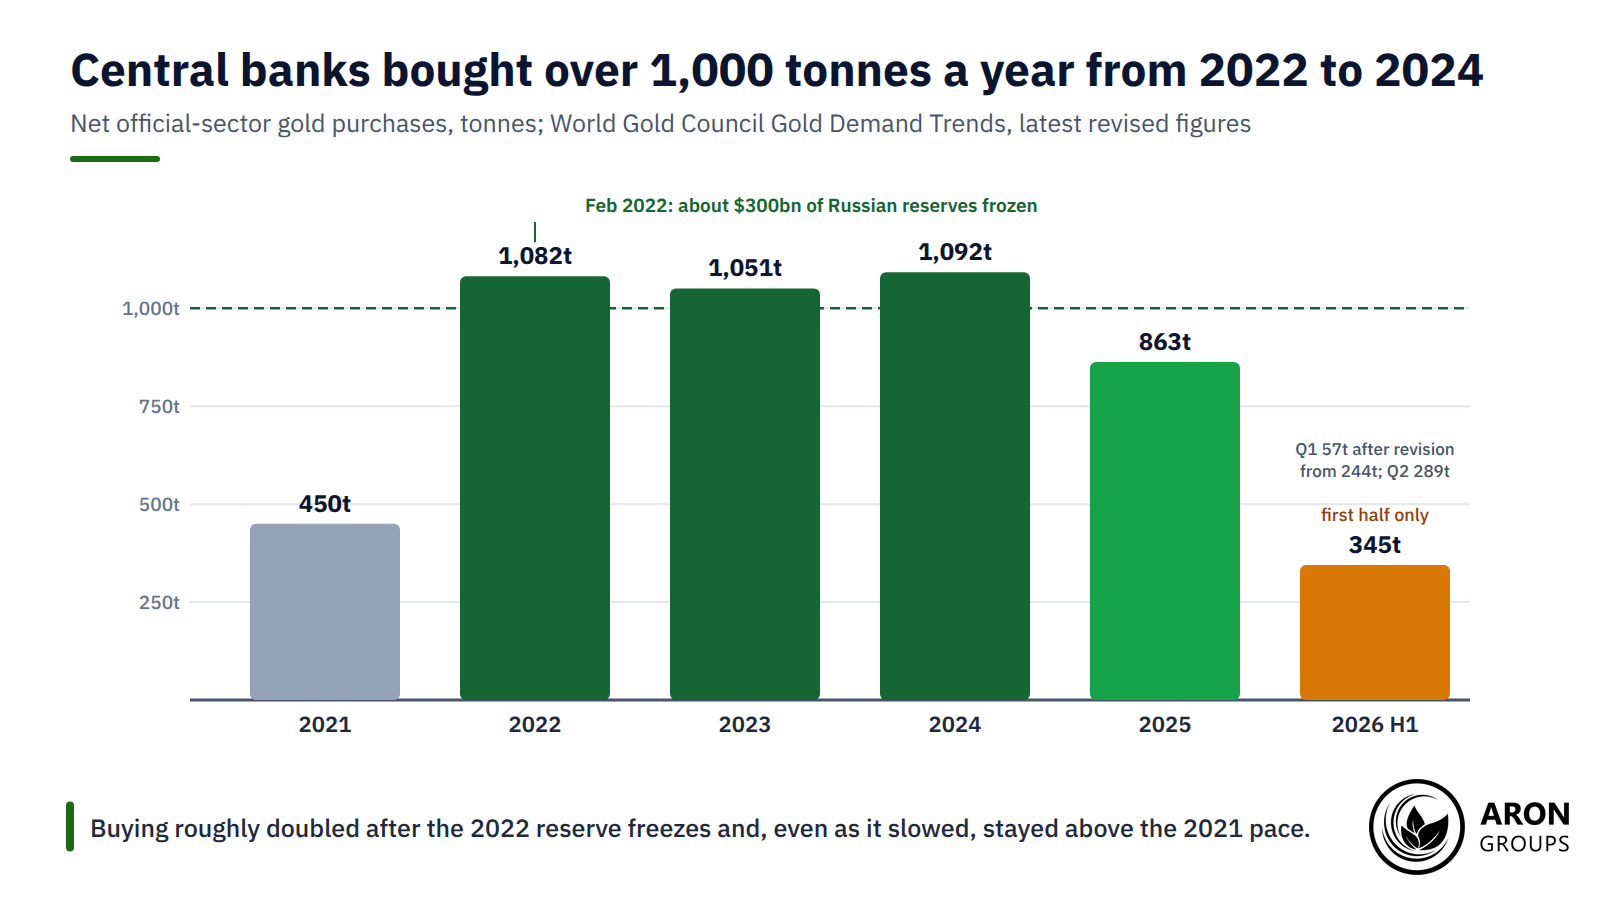
  • Central bank buying is the durable driver: official purchases topped 1,000 tonnes in 2022, 2023 and 2024 and reached 863 tonnes in 2025, roughly double the 2021 pace.
  • In a cash scramble gold falls with everything else: it dropped 12% between 9 and 17 March 2020 while the dollar index climbed from 94.9 to 102.8 by 20 March.
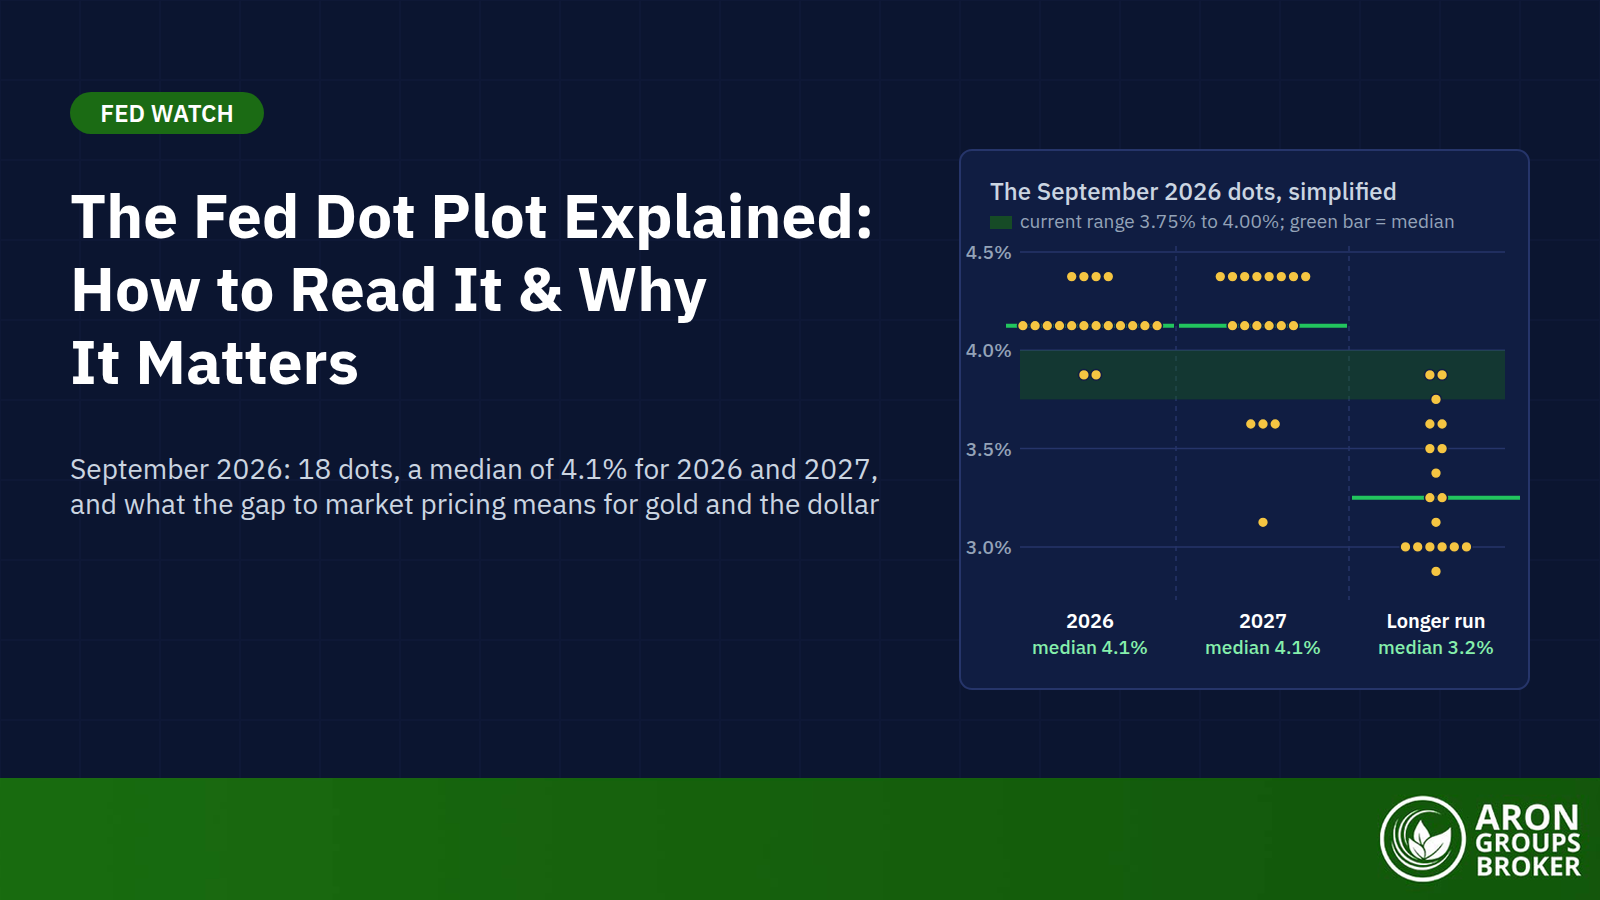
  • The dollar competes with gold as a haven and interest rates pick the winner: the Fed's turn to tightening, confirmed by its 16 September 2026 hike to 3.75% to 4.00%, is the main reason gold has fallen this year despite the war.

Does War Raise the Gold Price?

Yes, usually, and at least at first. In most major conflicts since 1990 gold rose within days of the first shots, typically by 4% to 11%. Traders sold stocks and weaker currencies for an asset with no counterparty. What happens next depends on whether the war changes inflation, interest rates and the dollar, and that is where the simple story breaks down.

sms-star

Risk Disclosure
Trading forex and CFDs carries a high level of risk and can result in the loss of all your capital. This content is educational and is not investment advice. Never risk money you cannot afford to lose.
The usual shape: spike, then fade

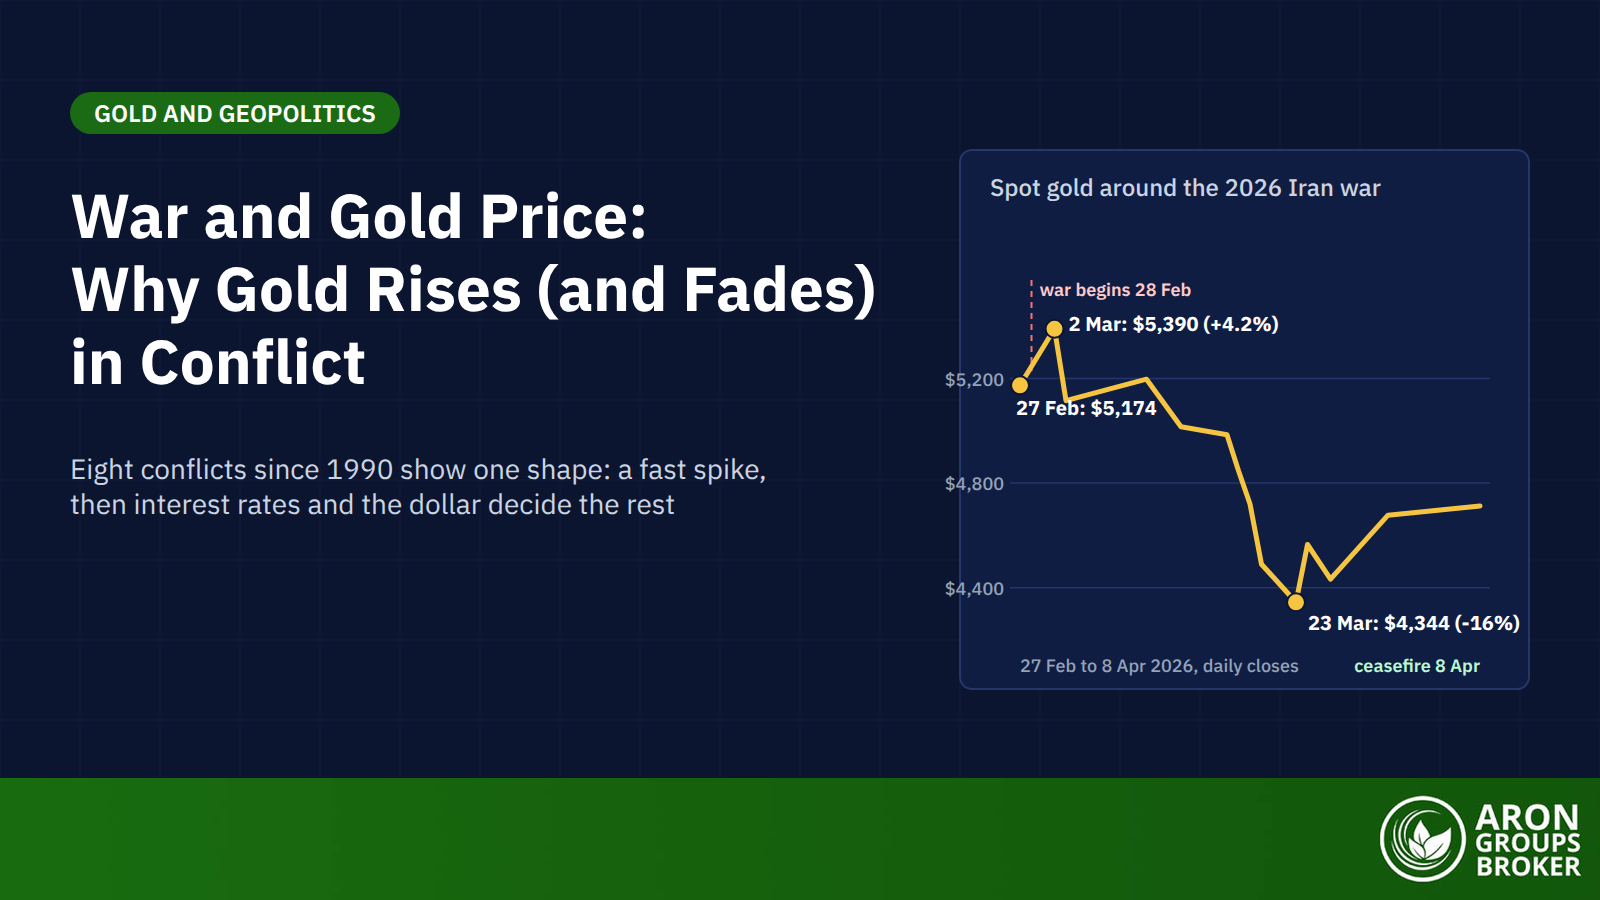
The pattern is consistent enough to have a cliche: “buy the fear, sell the resolution”. Gold peaked 14 days after the 1990 invasion of Kuwait and fell 6% in one session when the air war began on 17 January 1991. In 2026 the whole spike lasted one session: gold closed at about $5,390 on 2 March, 4.2% above its pre-war close, a level it has not regained.

What decides the size of the move

Three things set the scale. First, surprise: a war the market has already priced produces no spike. In 2003 gold fell 17% from its 5 February peak to 7 April as the Iraq invasion began. Second, reach: a conflict that threatens oil supply moves gold more than a contained one. Third, the policy response: if the war pushes central banks towards higher interest rates, the real return on cash rises and gold’s main driver turns against it.

Mechanism 1: Flight to Safety and Risk-Off Flows

The first mechanism is fear. When conflict erupts, investors cut assets that depend on growth and confidence and move into stores of value that hold up whoever wins. Gold qualifies because it is physical and borderless, with no issuer to default and nobody able to print more.

The clearest recent case is October 2023. Spot gold was at $1,809.50 on 6 October, a seven-month low, the day before the Hamas attack on Israel. By 31 October it traded at $2,000.20, up 10.5%, while the dollar index barely moved, from 106.0 to 106.7. The rally held because the Fed was expected to cut rates, not raise them.

Why the first days are the strongest

Risk-off flows are front-loaded. Volatility indices jump and portfolio managers hedge in the first sessions, when uncertainty is highest. As the conflict’s scale becomes clearer, those hedges are unwound and the spike gives way to a fade.

Mechanism 2: Central Bank Buying and De-dollarisation

The second mechanism is slower and more durable. In February 2022 Western governments froze about $300 billion of Russia’s $612 billion in reserves. Reserve managers learned that dollar and euro assets can be switched off. Gold held at home cannot, which puts sanctions risk at the centre of the de-dollarisation debate.

World Gold Council data show the shift. Central banks bought 1,082 tonnes in 2022, 1,051 tonnes in 2023 and 1,092 tonnes in 2024, against 450 tonnes in 2021. Purchases slowed to 863 tonnes in 2025, led by Poland with 102 tonnes, yet that was still almost double the 2021 figure.

Official purchases topped 1,000 tonnes in 2022, 2023 and 2024 and were still 863 tonnes in 2025, roughly double the 2021 pace.

The 2026 wobble in the durable driver

Even this driver is not a straight line. In July the council cut its first-quarter 2026 estimate from 244 tonnes to 57, and Russia sold 22 tonnes in the second quarter. Second-quarter buying still rebounded to 289 tonnes, 62% more than a year earlier. A record 45% of central banks surveyed in June 2026 planned to add gold within a year. The direction is intact; the quarterly numbers are noisy and get revised.

Mechanisms 3 and 4: War Spending, Inflation and the Oil Channel

The third mechanism runs through money. Wars are paid for with deficits and, often, with central banks that tolerate higher inflation. Gold pays no interest, so it does best when inflation outpaces interest rates and the real return on cash turns negative: the debasement trade.

The fourth is oil. Conflict in an energy region lifts crude, which feeds into headline inflation within weeks. After Iran closed the Strait of Hormuz, Brent rose from $72 a barrel at the end of February 2026 to $118 at the end of March. That was the largest monthly rise on record. By August 2026 US consumer energy prices were up 16.3% on the year and headline CPI stood at 3.4%, which is where CPI and gold meet.

Here the mechanism cuts both ways; 2026 is the proof. War inflation helps gold only if central banks let real yields fall. Instead the Fed, with Kevin Warsh as Chair since May, raised its target range to 3.75% to 4.00% on 16 September 2026, its first hike in three years. Gold fell more than 1% on the day. The inflation channel became a rates channel, and the rates channel is bearish for gold.

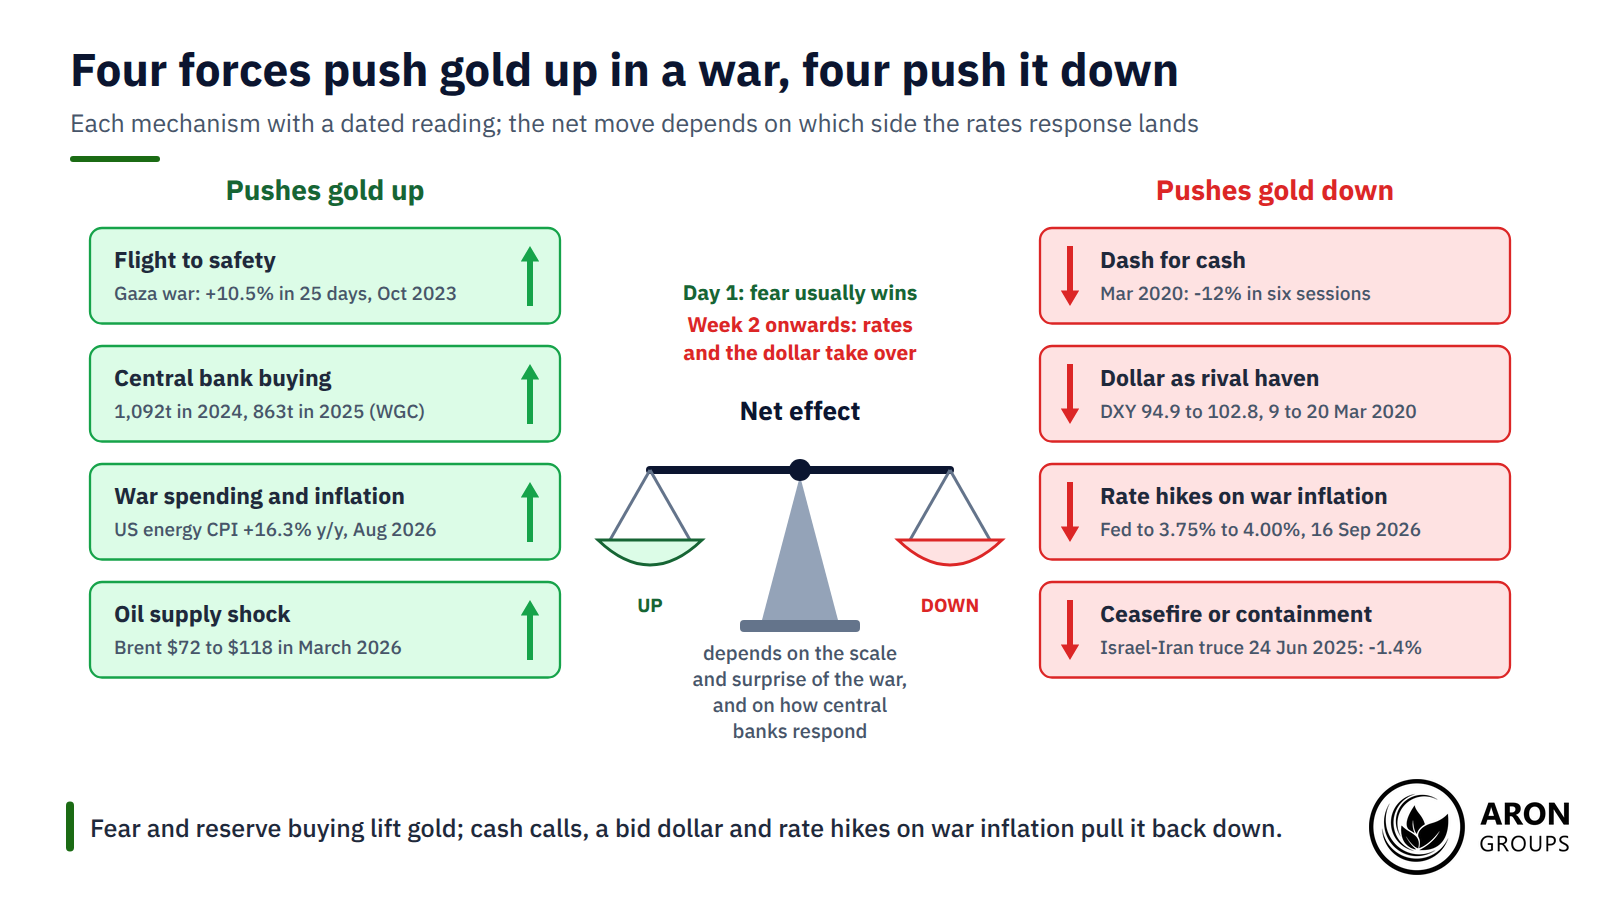
Fear, reserve buying, war inflation and oil push gold up; cash calls, a bid dollar, rate hikes and ceasefires pull it down, and the rates response usually decides.
sms-star

Key Point
A war headline is bullish for gold only until the market prices the central bank's answer to the inflation it causes. Track the next CPI print and Fed meeting as closely as the news from the front.
Eight Conflicts, One Pattern: Gold Price Around Wars Since 1990

The table uses LBMA afternoon prices, with spot closes for 2026, so the moves compare like for like. Each row shows the price before the event, the peak after it, where gold stood later and why the spike ended.

ConflictBefore the eventPeak after itLaterWhat ended the spike
Gulf War, Iraq invades Kuwait, 2 Aug 1990$372 (31 Jul 1990)$412 on 14 Aug (+10.5%)$363 on 28 Feb 1991 (-2.6%)Air war from 17 Jan 1991; quick coalition success
9/11 attacks, 11 Sep 2001$272 (10 Sep)$293 on 21 Sep (+7.7%)$277 on 31 Dec 2001 (+1.8%)Markets steadied after the Fed's 17 Sep rate cut
Iraq War, invasion 20 Mar 2003$344 (2 Jan 2003)$385 on 5 Feb (+12%), before the war$320 on 7 Apr 2003 (-7%)Rally came before the war; fighting started the fall
Russia invades Ukraine, 24 Feb 2022$1,905 (23 Feb)$2,039 on 8 Mar (+7.1%)$1,618 on 28 Sep 2022 (-15%)Fed hikes; dollar index at a 20-year high
Gaza war, 7 Oct 2023$1,810 (6 Oct)$2,000 on 31 Oct (+10.5%)Above $2,000 into 2024No fade: Fed cuts expected, central banks buying
Iran strikes Israel, 13 Apr 2024$2,431 record (12 Apr)No new high$2,305 on 23 Apr (-5.2%)Limited Israeli reply; de-escalation
Israel-Iran war, 13 to 24 Jun 2025$3,402 futures (12 Jun)$3,444 futures on 13 Jun (+1.2%)$3,320 spot on 24 JunCeasefire announced on 24 Jun
Iran war, from 28 Feb 2026$5,174 (27 Feb)$5,390 on 2 Mar (+4.2%)$4,344 on 23 Mar (-16%)Oil shock, hawkish Fed, stronger dollar, forced selling

Gold around eight conflicts. LBMA PM prices unless stated; 2026 figures are spot closes. Sources: LBMA price tables, Reuters, Kitco.

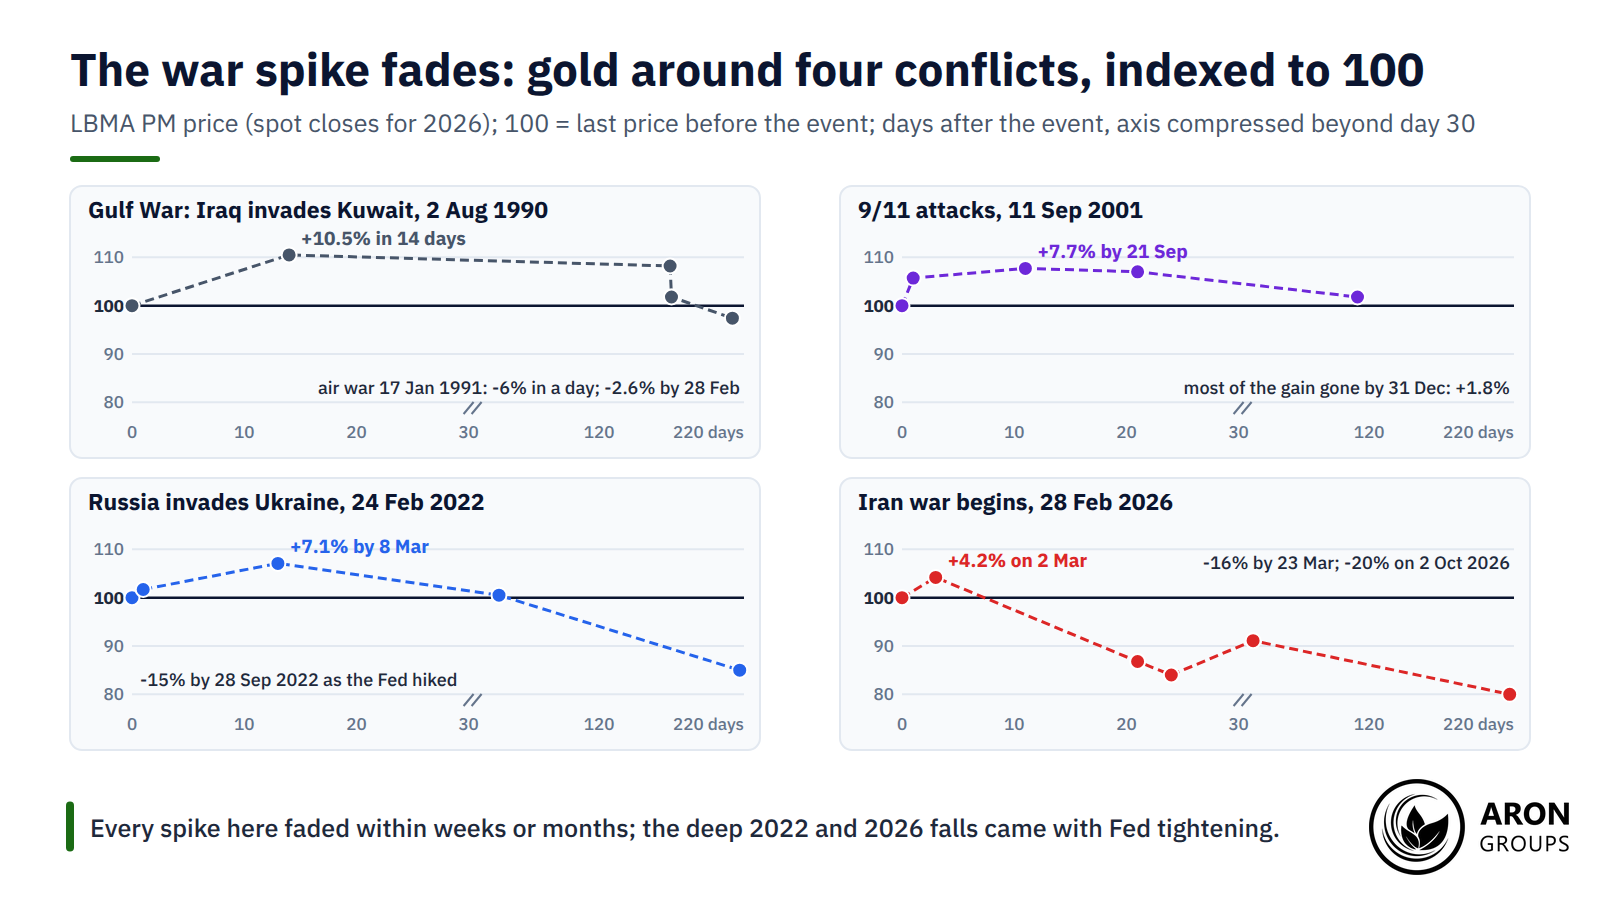
Two features stand out. The rally often starts before the first shot, as in early 2003 and early 2026, so part of the war premium is spent before fighting begins. And the depth of the fade tracks the policy response, not the fighting: the two deepest falls, in 2022 and 2026, came with Fed tightening.

Indexed to 100 on the eve of each conflict, every spike since 1990 faded within months, and the deepest fades, in 2022 and 2026, came with Fed tightening.

What 2026 adds to the record

The 2026 case is the most instructive: the war was large, sudden and energy-related, the type that should favour gold. Gold had rebounded 11% from its 2 February close by the eve of the war, so positioning was crowded. When oil spiked, markets priced rate hikes, the dollar index climbed above 100 by 13 March, and leveraged holders were forced out. Gold lost 10.3% in the week to 20 March, its worst week since 1983, and closed at $4,344 on 23 March.

Gold vs the Dollar: Two Safe Havens Compete

Gold is not the only asset investors run to. The US dollar is the other global safe haven, and in a crisis the two compete for the same flows. A bid dollar is a headwind for gold.

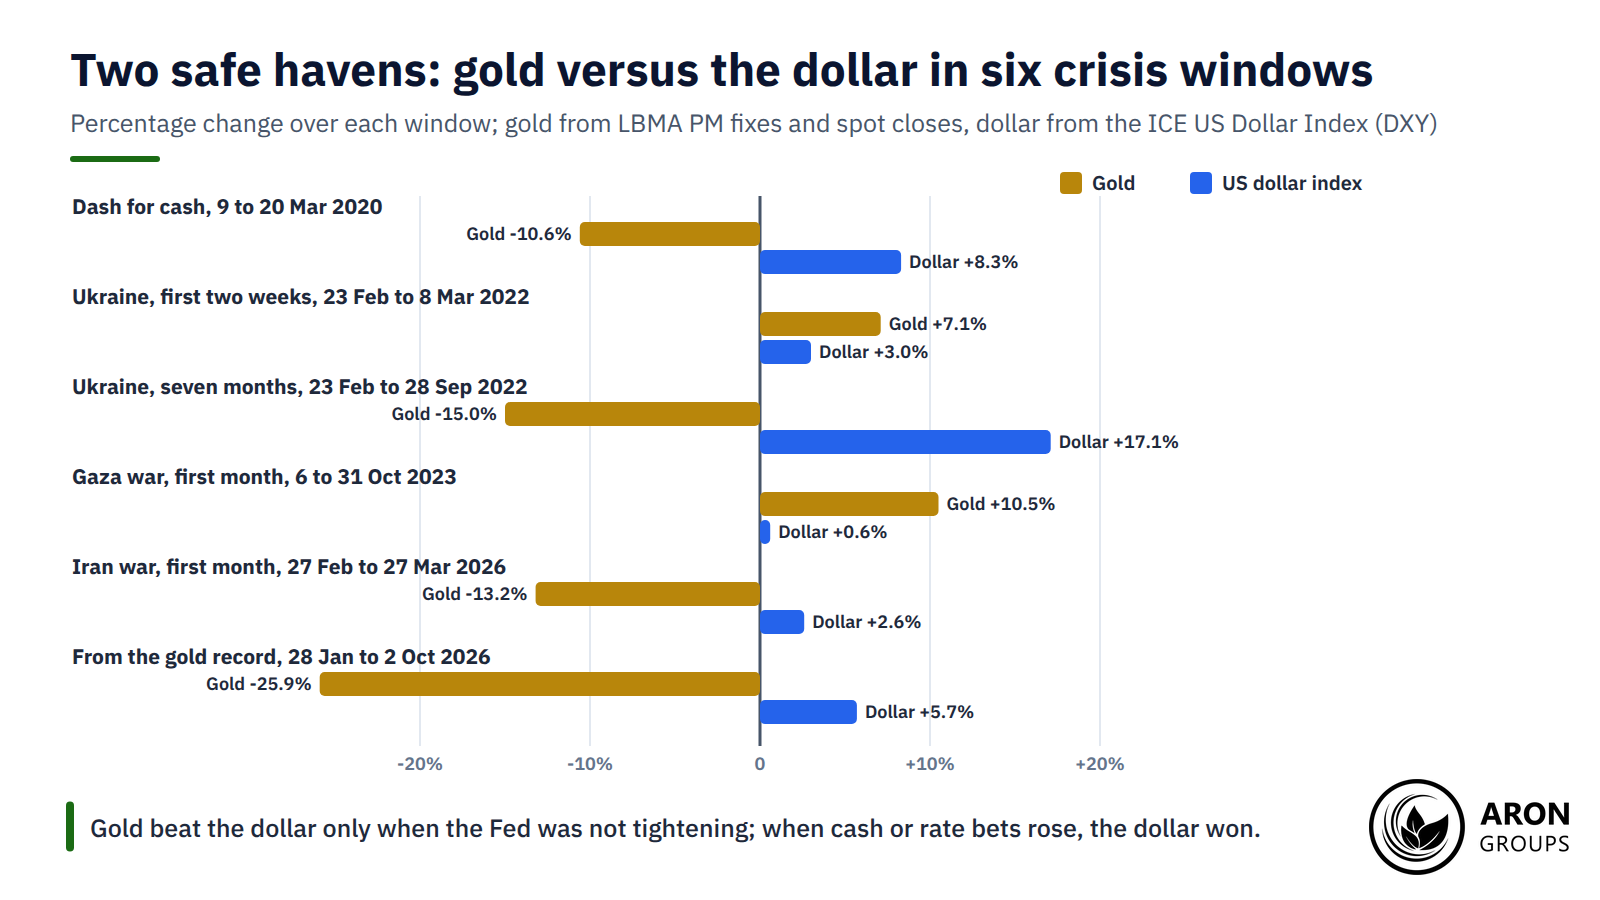
The record is clear. In the March 2020 dash for cash the dollar index rose 8.3% in nine sessions while gold fell 10.6%. In the first two weeks of the Ukraine war both rose, gold by 7.1% and the dollar by 3.0%. Over seven months, though, the dollar gained 17.1% and gold lost 15.0%. Only in October 2023 did gold win outright, up 10.5% against a flat dollar.

Gold beat the dollar only in October 2023, when the Fed was expected to ease; whenever cash demand or rate expectations rose, the dollar won.

The deciding variable is interest rates. A dollar that pays 4% in a crisis is a haven with a yield; gold is a haven without one. In September 2026 gold took its cue from a 10-year Treasury yield near 5% and a hawkish Fed. Even the drone strike on Saudi Arabia’s East-West pipeline on 10 and 11 September did not change that.

Q: Should I buy gold when a war starts?
A: The first-day reaction is usually up, but the edge is small and the fade is common, so a trade based only on the headline has poor odds. The better question is what the war does to inflation and how the central bank is likely to answer. If it pushes rate expectations higher, as in 2022 and 2026, the spike tends to be sold; if it coincides with easing, as in late 2023, the gain can hold.

When Gold Falls in a Crisis: The Liquidity Scramble

Sometimes gold drops first. In a broad panic, investors sell whatever they can to meet a margin call or a redemption, and gold is among the most liquid assets they own. The selling says nothing about gold; it is simply where the cash is.

March 2020 is the textbook case. Between 9 and 17 March 2020 the LBMA price fell 12%, from $1,672.50 to $1,472.35, even though a pandemic is a classic safe-haven event. A Bank of England account of the dash for cash, published by the BIS, records that daily variation margin calls rose from about $25 billion to about $140 billion. Investors sold their most liquid assets, driving safe asset prices down. Gold then recovered and set a record above $2,060 on 6 August 2020.

March 2026 showed the same mechanics on a smaller scale. Leveraged buyers who had entered above $5,100 were flushed out and stop orders accelerated the fall. Dubai dealers sold at a discount over bombing risk near their vaults. Gold’s safe-haven status works over months rather than days; in the first week of a panic, cash usually wins.

Mini Example: Buying the headline on 2 March 2026

Suppose a trader with a $2,000 account bought 0.1 lots of XAU/USD, 10 ounces, at $5,390 on 2 March 2026 with 1:100 leverage. The required margin was 10 x 5,390 / 100 = $539, leaving $1,461 of free margin before spread and swap.

Gold closed at $5,115 the next day, a fall of $275 an ounce. The open loss would have reached 10 x 275 = $2,750, more than the whole account. A stop-out at a 50% margin level would have closed the trade on the way down at roughly $5,217, for a loss of about $1,730.

A 0.01-lot position of one ounce needed $53.90 of margin. It lost $275 by 3 March and $1,046 at the 23 March close of $4,344, all still inside the account. Position size, not direction, decided who survived the first week of the war.

Risk control around headline volatility

Headline moves widen spreads and raise slippage, so a stop-loss placed inside the first hour’s normal range can be filled far from its level. The ESMA retail rules of 2018 capped leverage on gold CFDs at 20:1 and set a 50% margin close-out, a useful benchmark for tolerable exposure. A CFTC customer advisory on precious metals warns that metal prices can be volatile day to day. Leveraged metal accounts, it adds, can be closed out when the value falls. Position sizing that survives a 16% fall, as in March 2026, is the only reliable defence.

The Honest Limits of War and Gold Price

The relationship is a tendency, not a law, and four limits need stating plainly. Gold does not always rise: in 2003 and 2026 it fell once fighting began. The spike is often sold within weeks. In a liquidity scramble gold falls with everything else before it recovers. And the durable move comes from reserve buying, inflation and real yields, which no single headline changes.

The data have limits too. World Gold Council central bank figures are estimates that get revised, as the 2026 first-quarter cut from 244 to 57 tonnes shows. Price series differ by vendor: a record quoted as $5,589 on one feed appears as $5,595 on another. Treat every number here as a dated reading, not a forecast, and for session-level tactics see the guide to day trading gold.

Where Aron Groups Fits

Aron Groups offers gold on XAU/USD as a CFD on MetaTrader 5, with market execution and floating spreads on ECN accounts. The war reaction can therefore be traded long or short without holding bars. Aron does not offer gold ETFs, futures or physical metal, and a CFD carries the leverage risk described above.

Two tools matter around headline volatility. The economic calendar lists the CPI releases and Fed meetings that have decided gold’s direction after every recent war. A demo account lets you rehearse the 2 March 2026 example without capital at risk. A Nano account, with volumes from 0.0001 lots, keeps positions small while you learn how fast a spike can reverse.

Conclusion

War and gold price move together more often than not, but the link is front-loaded. The reliable part is the first reaction: gold rose within days of almost every major conflict since 1990. The unreliable part is everything after. The same war that frightens investors can also raise oil, inflation and interest rates, and higher rates are the one thing gold cannot fight for long.

The year 2026 is the sharpest lesson yet. A large, sudden war in an energy region produced a one-session spike and then a 16% fall. Seven months on, gold sits a quarter below its January record, with the dollar index above 101 and the Fed hiking.

Treat a war headline as the start of three checks: its effect on inflation, the central bank’s likely answer, and which safe haven is drawing the flows.

Frequently Asked Questions

Short answers to common questions about war and the gold price.

Does war increase the gold price?

Usually, at first. Gold rose 10.5% in the two weeks after the 1990 invasion of Kuwait and 7.1% in the two weeks after the 2022 invasion of Ukraine. The gain often fades within months, and in 2003 and 2026 gold fell as the fighting began.

Why did gold fall during the 2026 Iran war?

The oil shock lifted inflation expectations, so markets priced Fed hikes and the dollar strengthened, raising the cost of holding an asset with no yield. Leveraged positions were then liquidated, and gold lost 10.3% in the week to 20 March 2026.

Is gold or the dollar the better safe haven in a war?

It depends on interest rates. When the Fed is easing or on hold, as in October 2023, gold tends to win. When rates or cash demand are rising, as in March 2020, 2022 and 2026, the dollar wins. Both can rise together in the first days, as in early March 2022.

How much gold are central banks buying?

The World Gold Council recorded 863 tonnes of net purchases in 2025, after more than 1,000 tonnes in each of 2022, 2023 and 2024. First-half 2026 purchases were 345 tonnes, with 289 tonnes in the second quarter.

Continue Reading
not-found
calendar 9 October 2026
Rate this article

Leave a Reply

Your email address will not be published. Required fields are marked *

No thanks