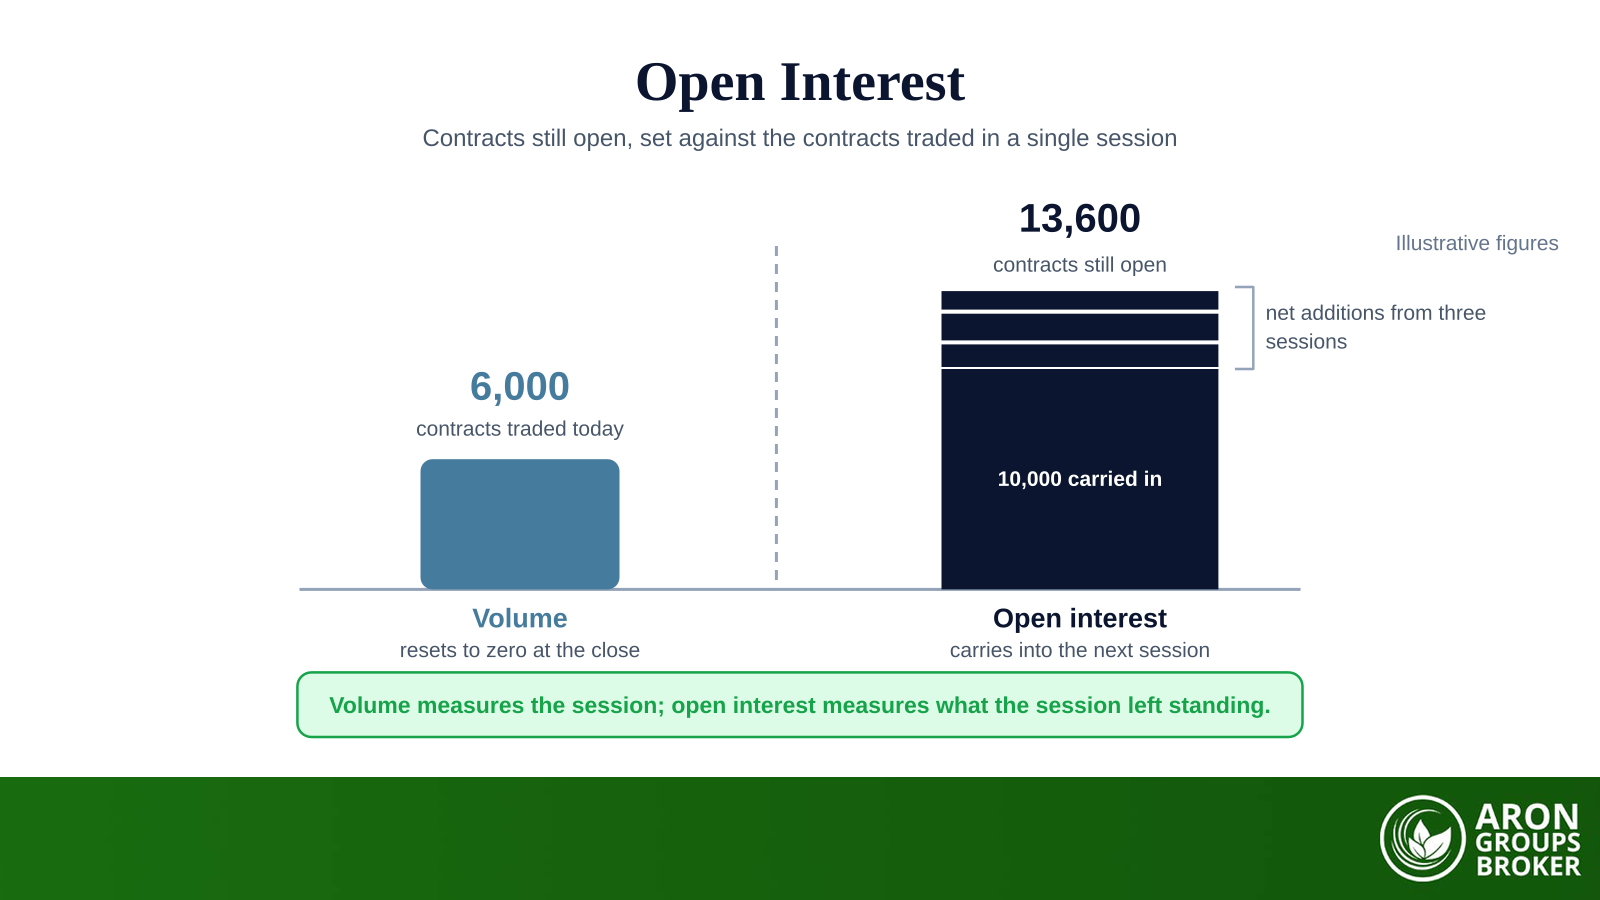

Open interest is the number of derivative contracts that are currently open, meaning contracts that have been entered and not yet closed, exercised or expired. It counts positions still standing, not positions traded. One futures or options contract adds a single unit to the total, and it stays there while both sides keep the position open.
Volume is the other number printed beside it, and the two are confused constantly. Volume counts how many contracts changed hands in a session and resets to zero at the close. Open interest counts how many are still held, and it carries over. Spot markets have no open interest at all, because no contract is left standing once a trade settles.
This guide sets out what the figure counts, the three ways a trade can move it, and how to read it against price. It also covers option strikes, crypto perpetual futures and the limits of the measure, because open interest describes participation rather than direction.
- Open interest counts derivative contracts still open; volume counts contracts traded in the session.
- A trade raises open interest only when both sides are opening, and lowers it only when both are closing.
- When one side opens and the other closes, the contract changes hands and open interest does not move.
- Rising open interest during a trend is treated as confirmation, but that is a convention rather than a law.
- Traditional futures publish the figure once per session; crypto perpetual venues update it continuously.
What open interest actually counts
Open interest counts contracts, not trades and not participants. Each contract binds a buyer and a seller, and the pair is counted once rather than twice. The figure measures how much commitment is still standing in a market, rather than how much trading has taken place. It is the closest thing a derivatives market has to a headcount of live positions.
Risk Disclosure
Trading forex and CFDs carries a high level of risk and can result in the loss of all your capital. This content is educational and is not investment advice. Never risk money you cannot afford to lose.
Contracts outstanding, not contracts traded
The weight of the definition sits in the word outstanding. A contract enters the count when it is created and leaves when it is closed out, exercised or allowed to expire. Trading the same contract repeatedly changes nothing, because the position moves to a new holder rather than disappearing. That is why a frantic session can end with open interest exactly where it started.
Who publishes the number
Open interest comes from the venue itself, not from an estimate. A futures exchange and its clearing house hold every position, so the figure is exact for that venue and is reported for each contract month. Totals aggregated across several venues are only as complete as the venue list behind them. Spot foreign exchange has no such figure, because it trades over the counter with no central record of positions.
How open interest changes: the three cases
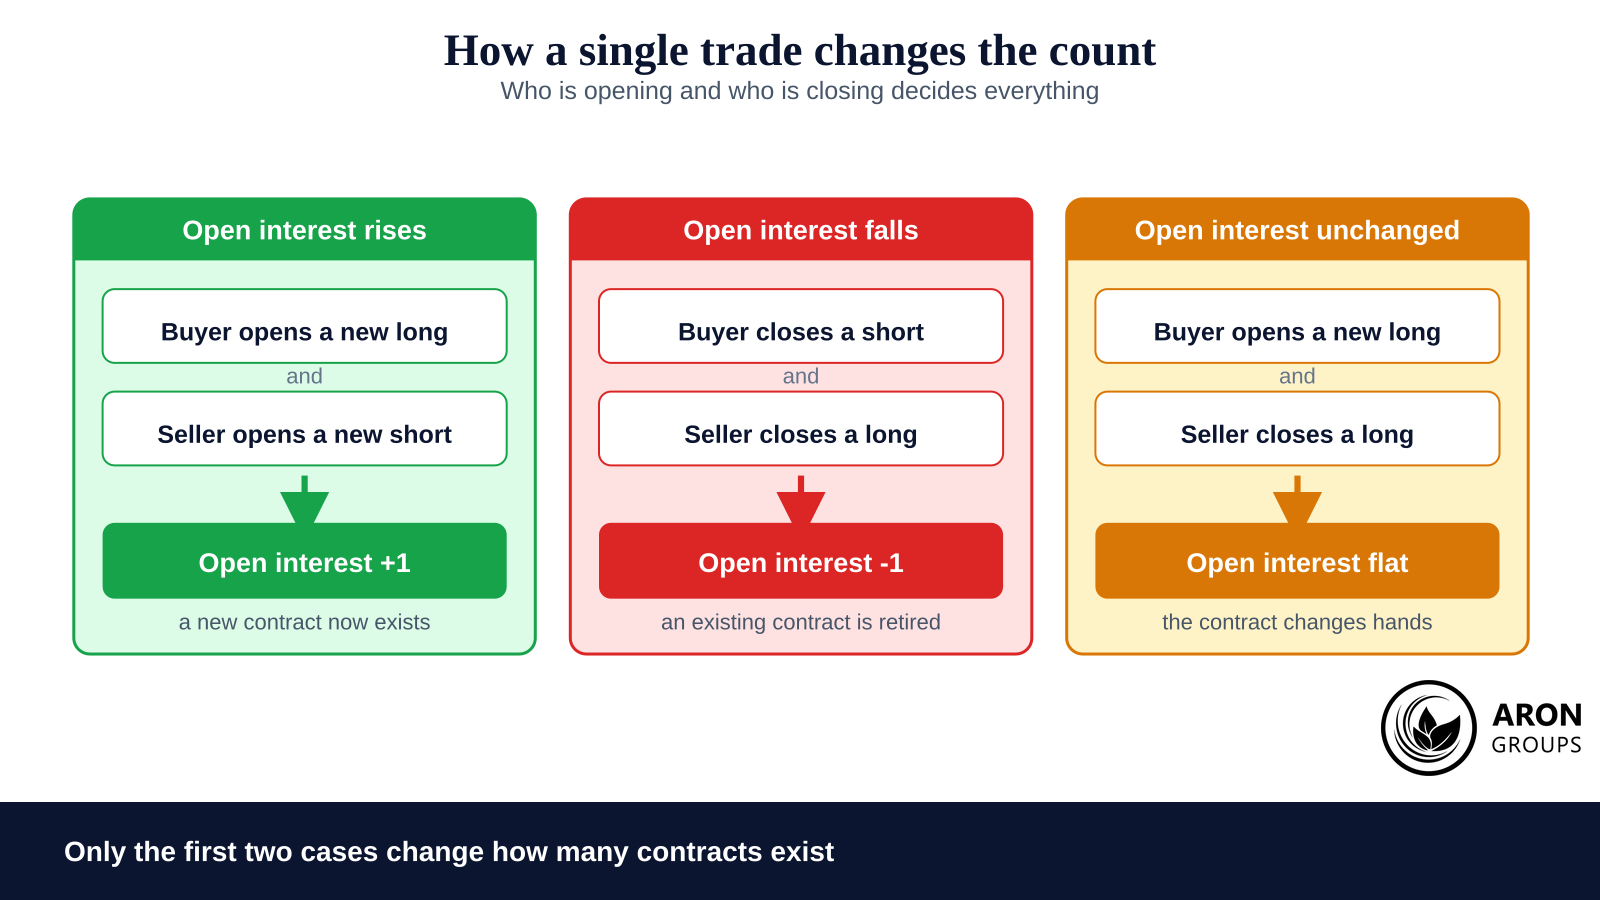
Open interest moves in exactly three ways, and each reduces to who was opening and who was closing. Two participants entering the market together create a contract, so the count rises by one. Two participants leaving together retire a contract, so the count falls by one. One of each leaves the count untouched.
The third case deserves the illustration most explanations skip. Assume Trader A is long one contract and wants out, so she sells. Trader B holds nothing and buys. The contract A owned now belongs to B: one position closed, one opened, nothing created or destroyed. Volume records one contract traded while open interest does not move.
| The trade | What the buyer is doing | What the seller is doing | Effect on open interest |
|---|---|---|---|
| Both sides new | Opening a long | Opening a short | Rises by one contract |
| Both sides closing | Closing a short | Closing a long | Falls by one contract |
| Transfer to a new long | Opening a long | Closing a long | No change |
| Transfer to a new short | Closing a short | Opening a short | No change |
The last two rows are one case seen from either side, and volume records a contract in all four of them.
Key Point
No participant can create open interest alone. Every contract in the total is one long and one short, held in two different accounts.
Open interest versus volume
Volume measures activity over a period, and open interest measures commitment at a point in time. Volume begins at zero each session and counts every contract traded, including contracts that trade several times. Open interest begins where it finished and changes only by the net of contracts created and contracts closed.
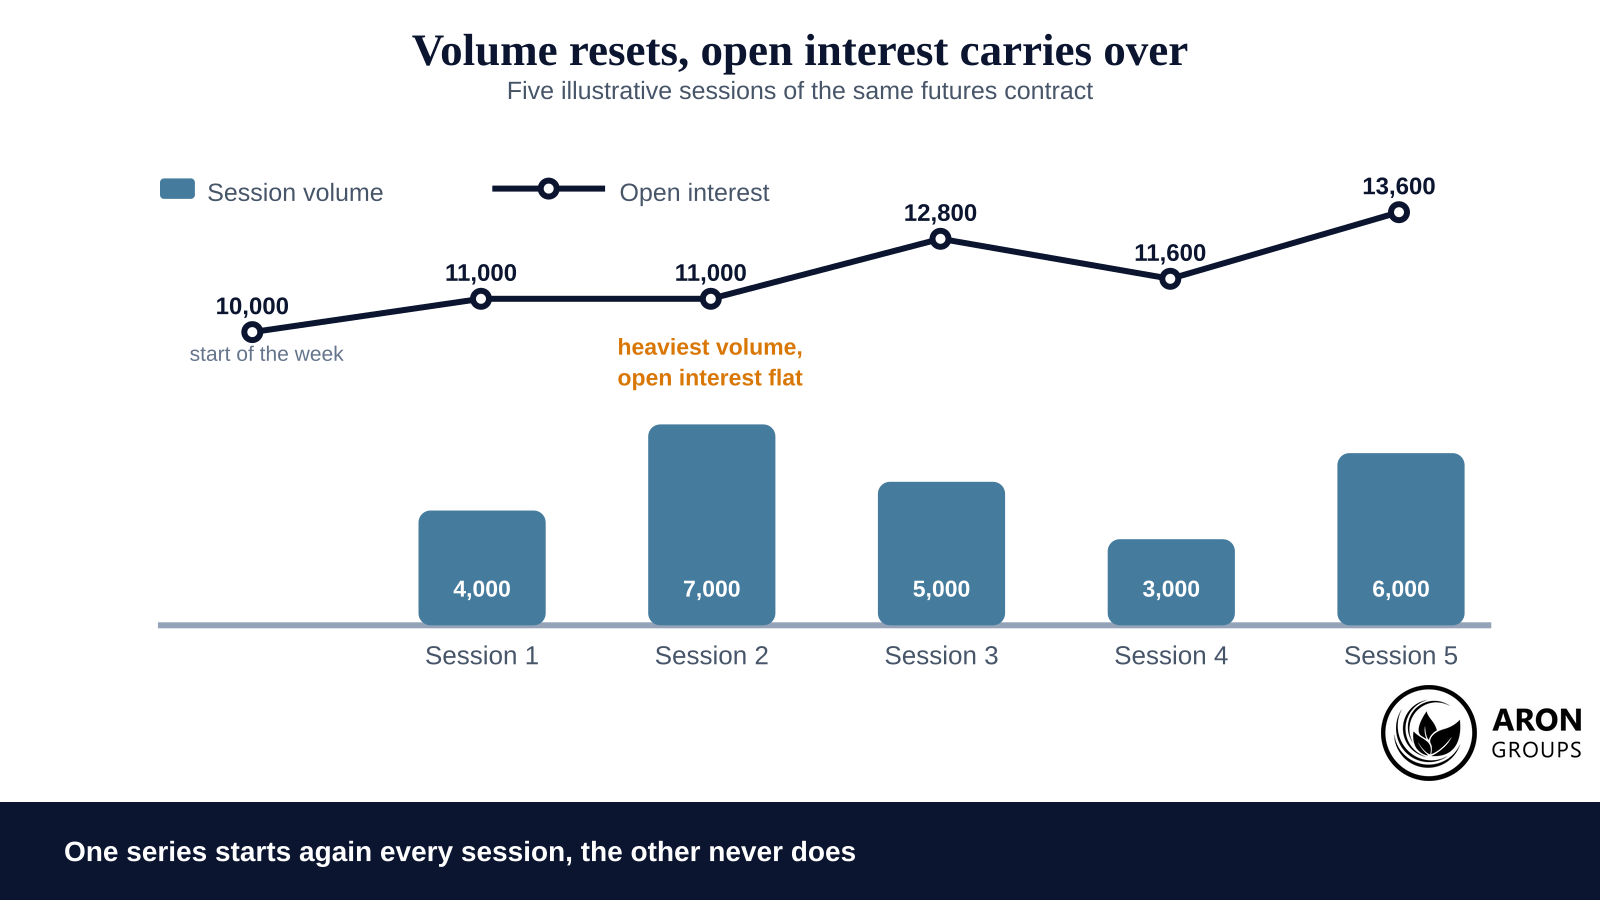
Pairing the two is what carries information. Heavy volume with flat open interest says the day’s activity opened and closed inside the session. Heavy volume with rising open interest says new money took positions and kept them. The same volume figure supports two opposite conclusions depending on what open interest did.
| Property | Volume | Open interest |
|---|---|---|
| What it counts | Contracts traded in the period | Contracts still open |
| At the start of a session | Resets to zero | Carries over from the last close |
| A closing trade | Adds to the total | Reduces the total |
| A transfer between traders | Adds to the total | Leaves the total unchanged |
| What it describes | Activity in the period | Commitment at a moment |
The two answer different questions: how much changed hands, and how much is still exposed to the next move.
A worked week, session by session
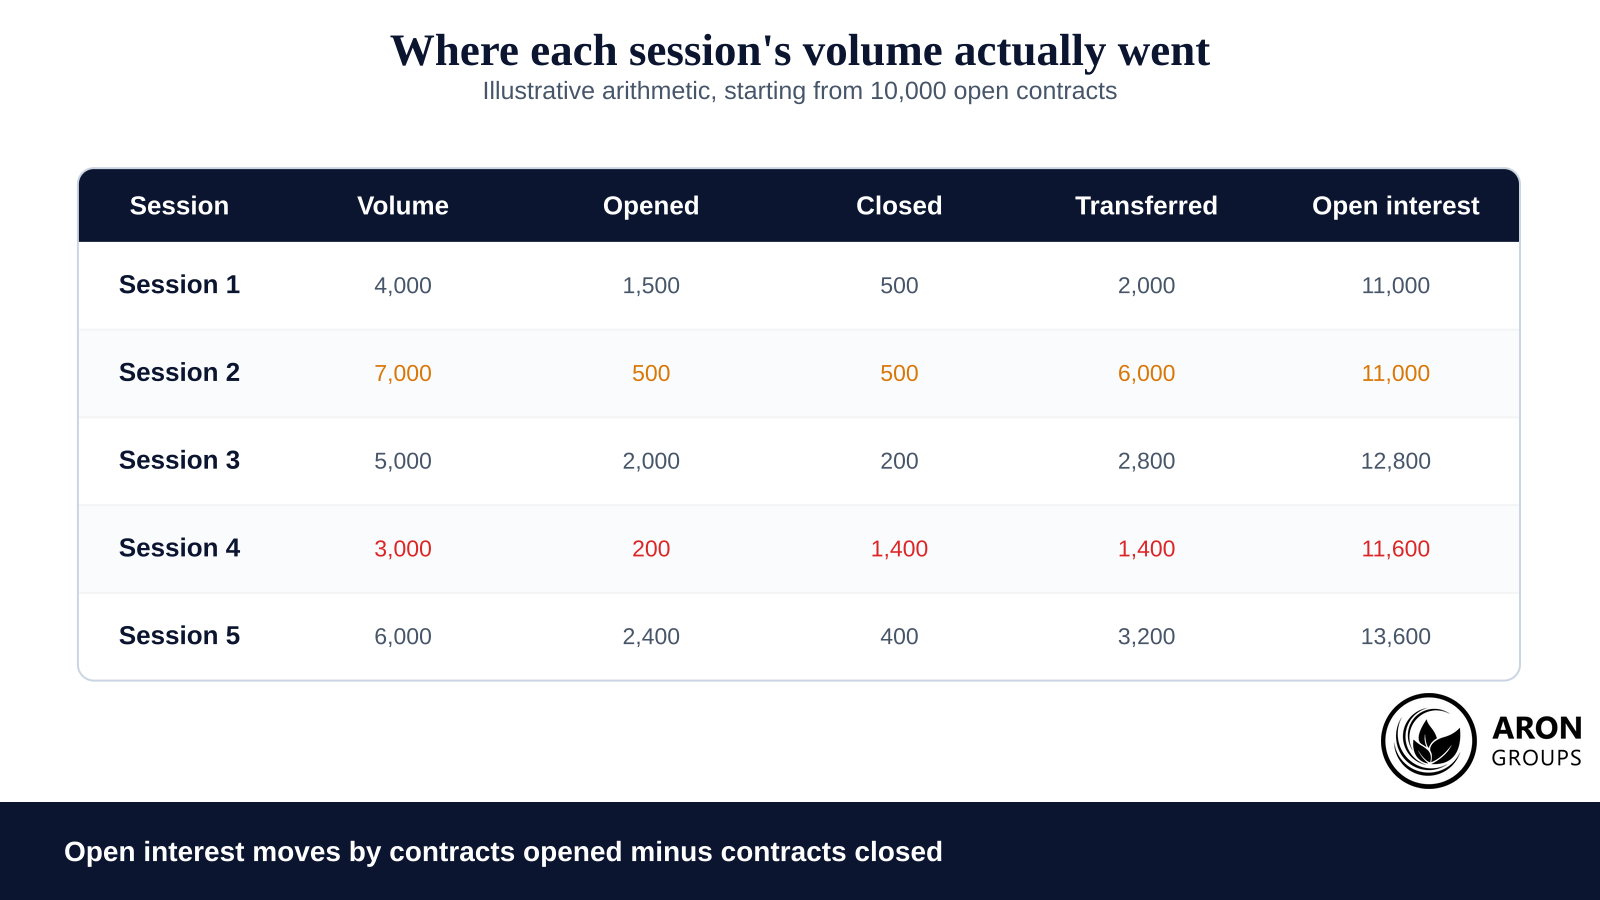
Concrete numbers settle the arithmetic faster than definitions do. The table below follows one illustrative contract across five sessions. It splits each session’s volume into contracts opened, contracts closed and contracts merely transferred. Only the final column carries from one row to the next.
Two readings come out of the week. Session two is churn, a large amount of trading that left no extra commitment behind it. Session four is the reverse, a quiet session in which closing outweighed opening and the total fell by 1,200 contracts. Any rule built on a pattern like this deserves testing out of sample before it carries size.
The standard readings, and what they are worth
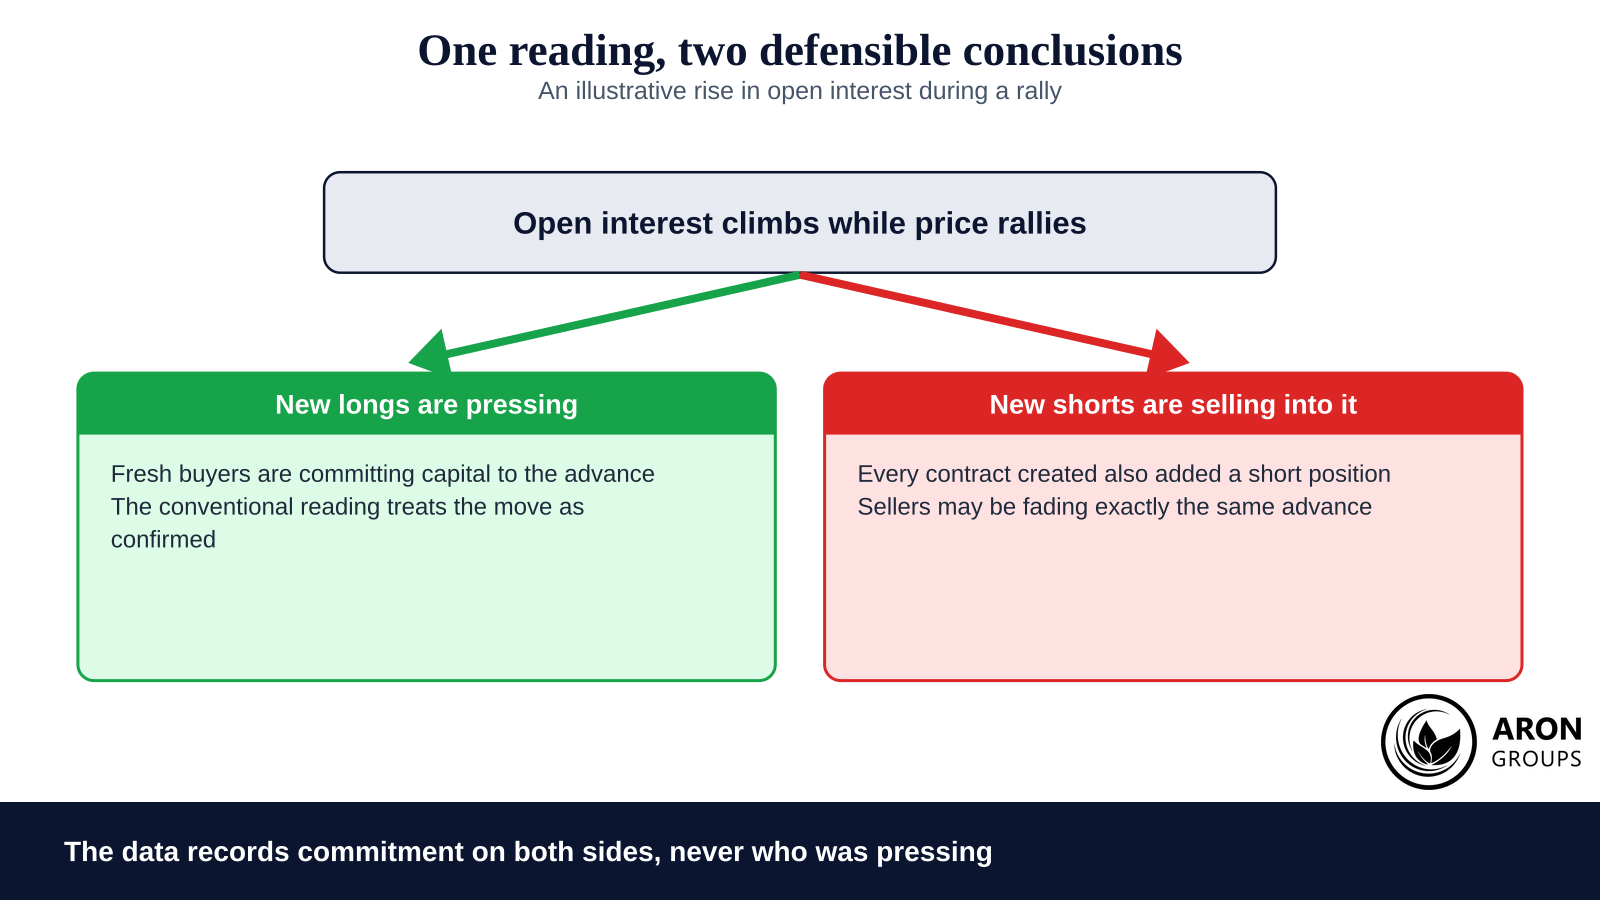
The conventional readings pair the direction of open interest with the direction of price. They are useful shorthand rather than laws. Each one is an inference about who is initiating, drawn from two numbers that record no intent at all. Systematic traders encode them as conditions rather than as entries.
· Rising open interest with a rising price: new longs are entering and the advance is treated as confirmed.
· Rising open interest with a falling price: new shorts are entering and the decline is treated as confirmed.
· Falling open interest with a rising price: shorts are closing, so exits rather than fresh buying drive the move.
· Falling open interest with a falling price: longs are closing, so the decline is liquidation rather than new selling.
· Flat open interest on heavy volume: the session changed ownership without changing commitment.
The practical use is as a filter, not as a trigger. A breakout carrying rising open interest has more of the market committed behind it than one that does not. That is a statement about participation, and it still needs price structure and a defined risk plan before it becomes a trade.
Practical filter
When open interest falls during a move, the fuel is closing positions. A move powered by exits ends when the exits are finished.
Open interest at option strikes
In options, open interest is reported strike by strike, and that breakdown is the raw material behind several familiar tools. A strike carrying heavy open interest marks a concentration of contracts. That is a statement about where liquidity sits, not about where price is going.
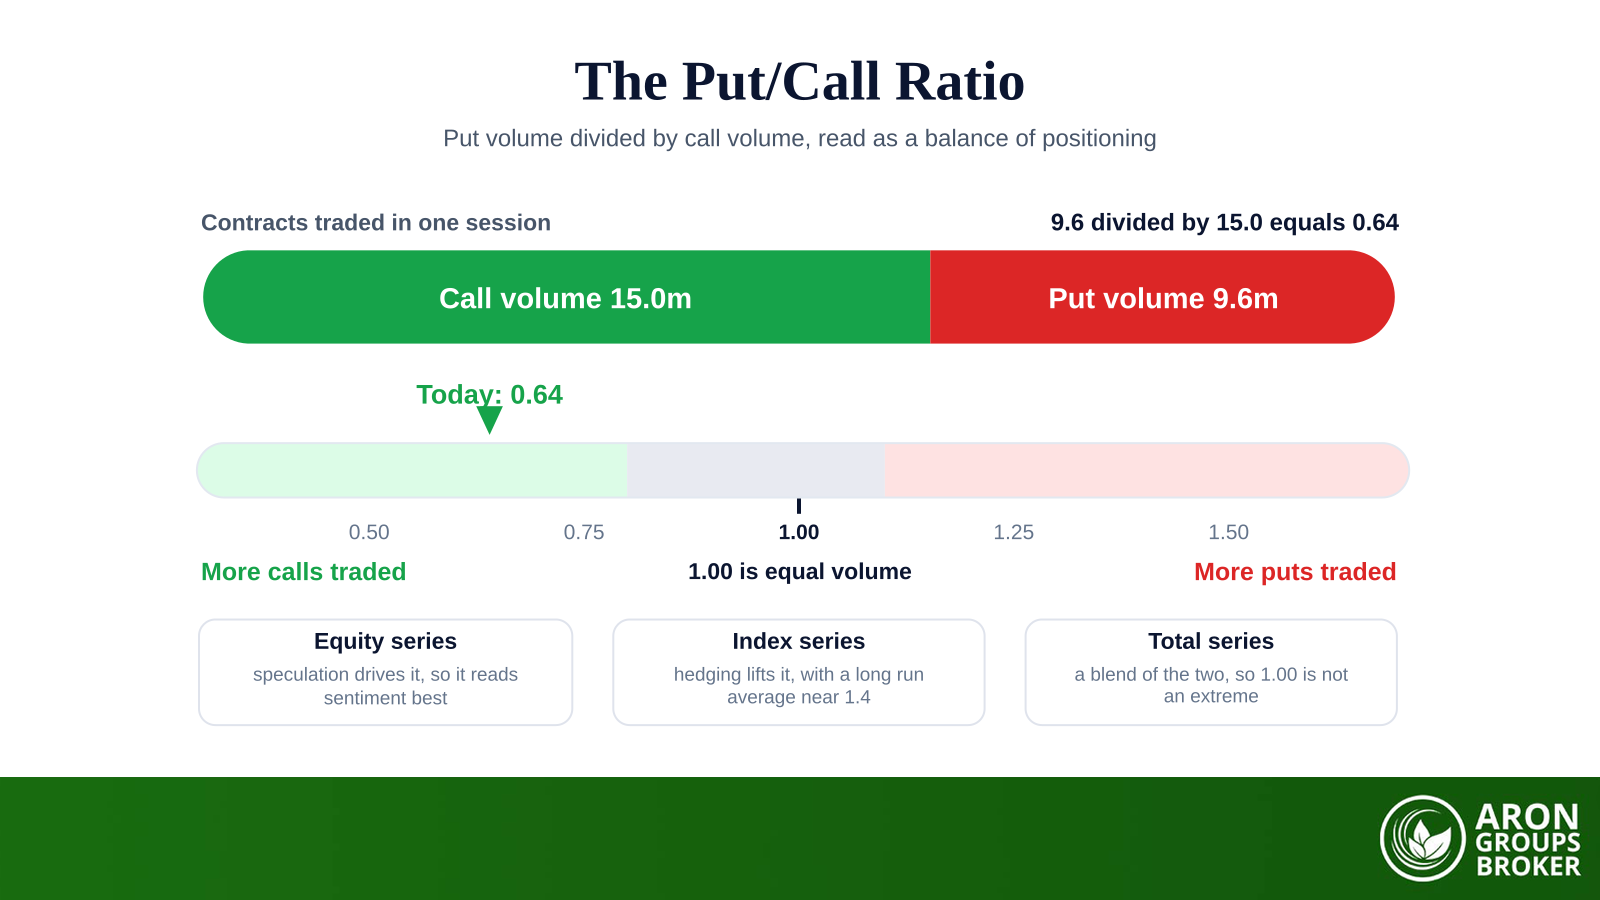
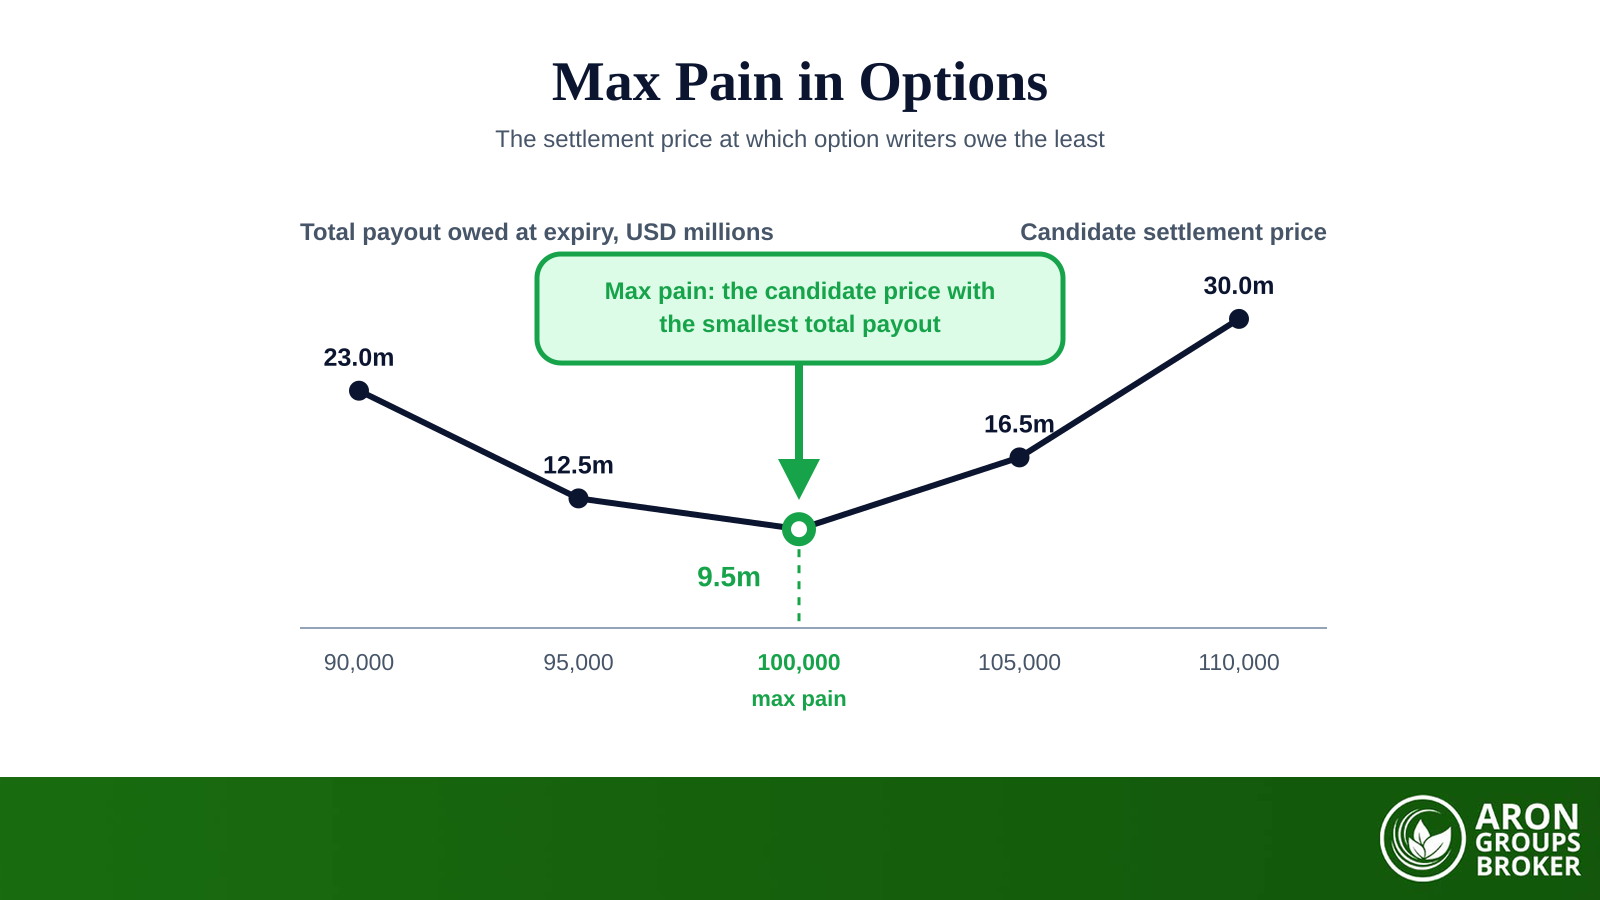
Max pain is calculated directly from open interest by strike. It identifies the price at which the largest quantity of contracts would expire worthless. One version of the put/call ratio is built from open interest rather than volume, so it measures standing positioning rather than the day’s flow. Both tools inherit whatever the underlying open interest data is worth.
Q: Does heavy open interest at a strike pull price towards it?
A: Not by itself. The concentration matters because dealers who are short those contracts hedge them. That hedging flow can dampen or amplify moves near the strike as expiry approaches, so the effect comes from behaviour rather than from the number.
Crypto perpetual futures and the leverage read
Crypto venues publish open interest continuously, and that changes what the figure is for. A traditional futures exchange releases a preliminary figure after the close and a final figure the next morning, so the series lags by a session. Perpetual futures venues update it through the day, so crypto traders read it as a live gauge of leverage rather than a daily statistic.
Rising open interest on a perpetual contract means more leveraged positions are open, which enlarges the pool that can be force closed when price turns. Falling open interest means the market is deleveraging, often after a liquidation run has already cleared positions out. Most perpetual contracts are margined in a stablecoin, so the total is usually quoted in dollars.
The figure is read next to the funding rate and price rather than alone. Persistent positive funding alongside rising open interest describes a crowded long side paying to stay in position. That is a risk profile rather than a forecast, and it says nothing about when the crowd will be wrong.
Mini Example: reading open interest against funding
Price grinds higher for two days. Open interest on the perpetual contract climbs with it and the funding rate turns firmly positive. The straightforward read is that new leveraged longs are paying to hold their positions.
That is a crowded trade, not a sell signal. What it changes is the risk profile. A modest decline now has a large pool of positions to close, and that is the mechanism behind a cascade. The measured response is smaller size and a stop set where a cascade would not reach it, not a contrarian trade on the number.
The honest limits of open interest
Open interest is a participation and confirmation metric, not a direction signal. It reports how many contracts are committed. It cannot report which way price will go. Every contract in the total has a long and a short attached, and those two disagree. A confirmation metric can sharpen a process, but it does not create an edge on its own.
Reporting is the second limit. Traditional futures figures arrive after the close, preliminary first and revised the next morning, so intraday decisions are taken against yesterday’s number. Aggregated crypto figures depend on which venues the aggregator covers, and adding or dropping a venue moves the series without anything changing in the market.
The third limit is practical. The volume shown on a retail forex platform is tick volume, a count of price updates rather than contracts. Spot forex carries no open interest at all, and that absence follows from foreign exchange market structure rather than from a gap in the data.
Did You Know
Exchange traded futures report open interest exactly, because a clearing house holds both sides of every contract. Precision in the number says nothing about the reliability of the interpretation placed on it.

Where Aron Groups fits
Aron Groups offers spot and CFD instruments rather than futures or options, so open interest is context here rather than something you trade. Derivatives positioning still informs a spot or CFD decision, because open contracts in the futures market describe the commitment behind the same price. Orders run through MetaTrader 5 on market execution, filling at the next available price without requotes, and the spread floats with the market.
If you want to use derivatives positioning as context, keep the stake small while you find out what it is worth to you. The Nano account carries no commission, since the cost sits in the spread, and it supports micro volumes from 0.0001 lots. Size each position from a written plan rather than from the strength of a reading, and keep capital preservation ahead of conviction.
Conclusion
Open interest is a simple count with one property that matters: it survives the close. Volume tells you how busy a session was. Open interest tells you how much of that activity left a standing position behind, and the gap between the two is where the information lives.
Treated as confirmation it earns a place in a process. Treated as a forecast it will disappoint, because the total is symmetrical and every contract inside it pairs a long with a short. Build it into risk management as context, and remember that regulators have measured how consistently retail accounts lose money on leveraged products.
Frequently asked questions
Four questions come up repeatedly once traders start watching the figure.
Is high open interest bullish or bearish?
Neither on its own. A high total says many contracts are committed, and each of them has a buyer and a seller behind it. Direction comes from reading the change in open interest alongside the change in price, and even then it is an inference.
How often is open interest updated?
Once per session on traditional futures exchanges, as a preliminary figure after the close and a final figure the following morning. Crypto perpetual venues update it continuously, which is why crypto traders read it as a live number rather than an end of day statistic.
Can open interest be larger than volume?
Yes, and in a heavily held contract it usually is. Volume counts a single session, while open interest accumulates across every session since the contract was listed. A quiet day therefore produces a small volume figure standing next to a very large open interest figure.
Does open interest exist for shares or spot forex?
No. Open interest counts derivative contracts, so it exists for futures and options and not for cash markets. Share trading reports volume and free float, which measure different things. A trader who wants the same read on a currency looks at the futures contract for that currency instead.