


A single candlestick can hint at what the market is feeling, but it takes two candles working together to confirm that sentiment is actually shifting. Dual candlestick patterns, also called two-bar or double-candle formations, use the relationship between consecutive candles to identify moments where buyers wrest control from sellers or sellers overwhelm buyers. That confirmation element is what makes them more dependable than single-candle signals in isolation.
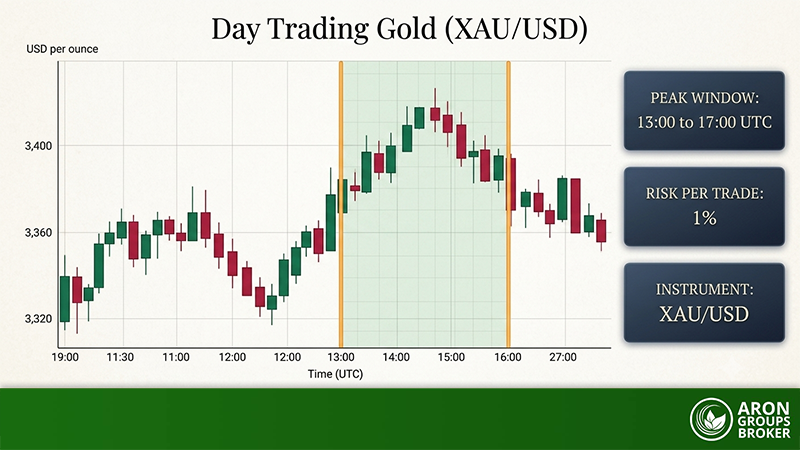
These patterns appear across every liquid market, from forex pairs and gold to equity indices and crypto. They are most effective when they form at structurally significant locations: key support and resistance levels, moving average confluences, or the edges of well-defined ranges. Without that context, even a textbook formation can produce a false signal.
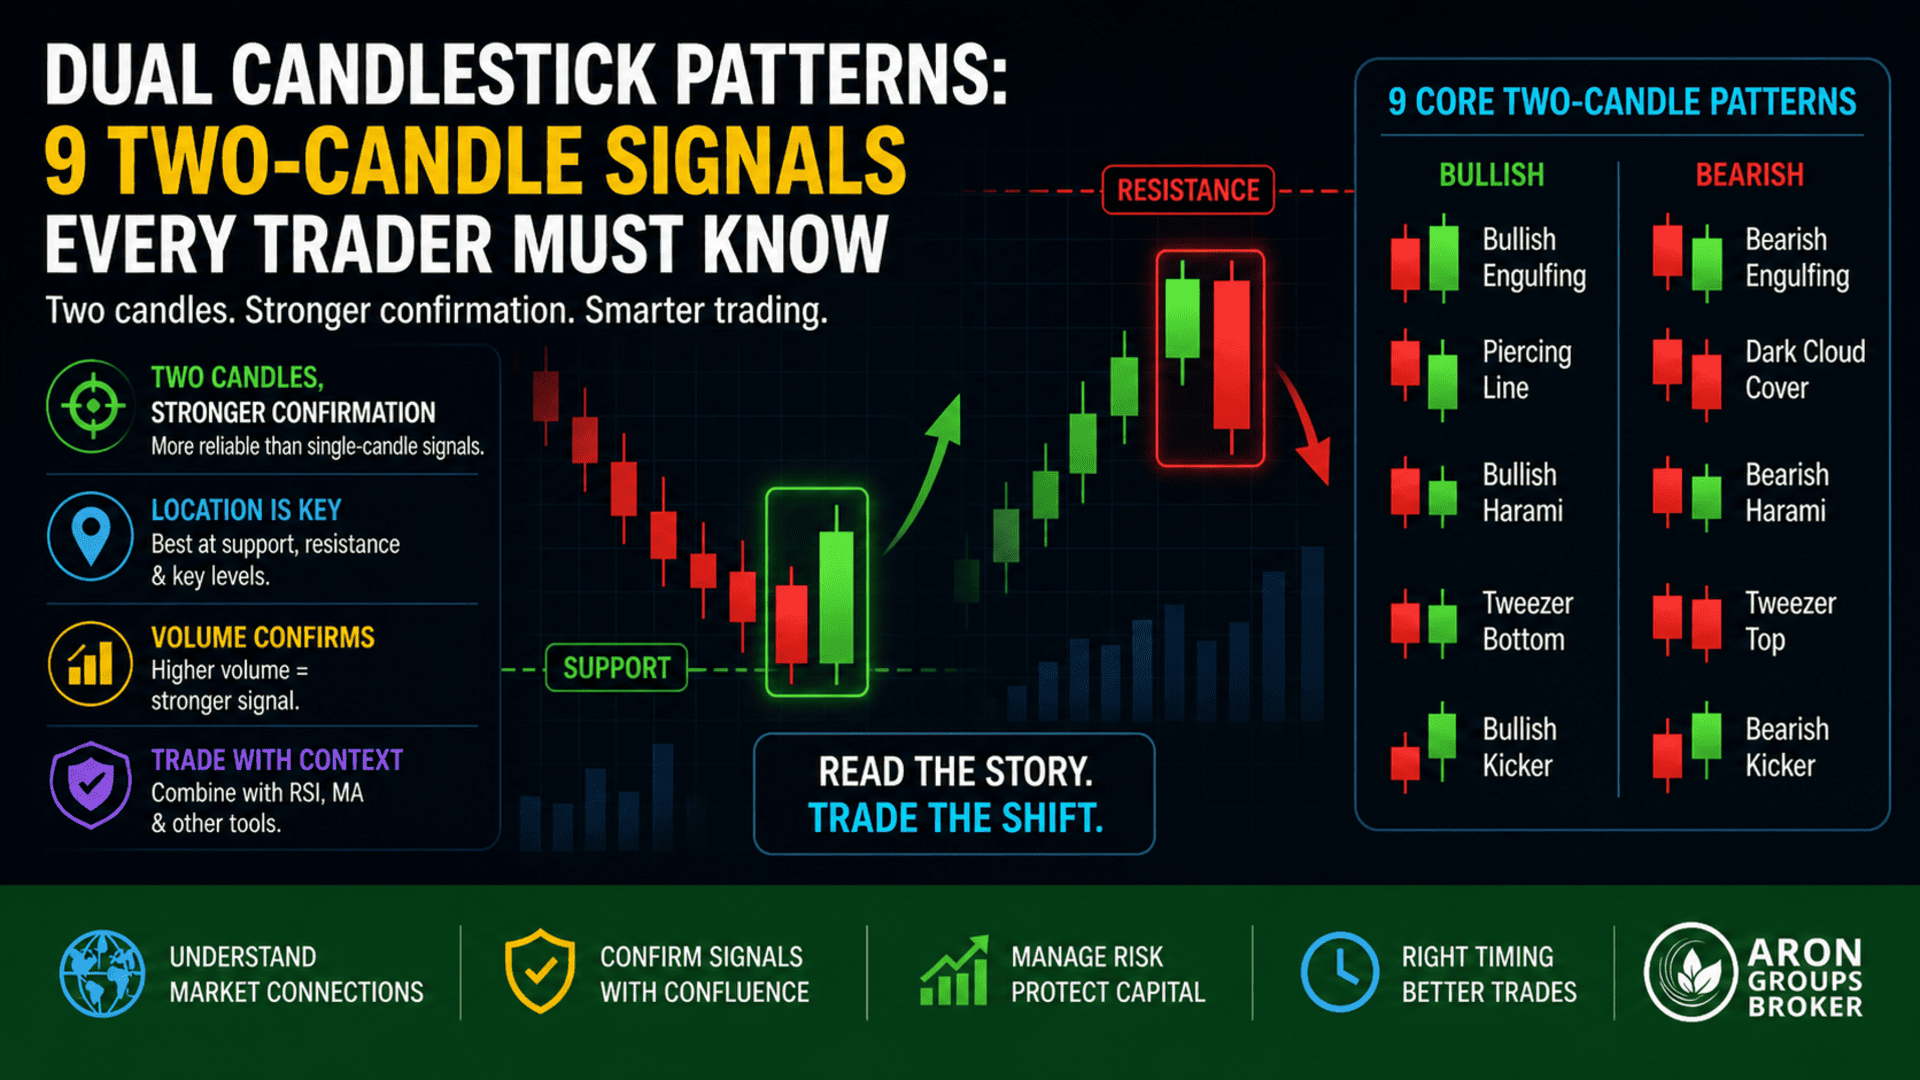
This guide covers nine essential two-candle patterns, explains how each one forms and what it signals, and outlines practical rules for filtering, confirming, and trading them on live charts.

Dual candlestick patterns require two consecutive candles to form, providing stronger confirmation than single-candle signals.
The nine core patterns are: bullish engulfing, bearish engulfing, piercing line, dark cloud cover, bullish harami, bearish harami, tweezer bottom, tweezer top, and the kicker.
Location matters more than shape. A pattern forming at a key support or resistance level carries far greater weight than one appearing mid-range.
Volume confirmation strengthens every two-candle signal. A reversal candle on above-average volume indicates genuine participation.
No pattern works in isolation. Combining dual candlestick formations with indicators such as RSI, moving averages, or volume analysis improves reliability.
What Are Dual Candlestick Patterns?
A dual candlestick pattern is a technical analysis formation created by two adjacent candles on a price chart. The first candle establishes the prevailing sentiment, while the second candle either confirms that sentiment or contradicts it. When contradiction occurs at a meaningful price level, the pattern signals a potential reversal. When the second candle extends the first candle’s direction with conviction, it may confirm continuation.
The structural elements traders examine include body size relative to the first candle, whether the second candle’s body engulfs, contains, or overlaps the first, the direction of shadows, and the gap (or lack of gap) between the two candles’ close and open prices. These relationships define which specific pattern has formed and whether it carries bullish or bearish implications.
Read More: Candlestick Analysis and Trading with Candlestick Patterns

CFDs are complex instruments and come with a high risk of losing money rapidly due to leverage. You should consider whether you understand how CFDs work and whether you can afford to take the high risk of losing your money. Past performance is not indicative of future results. This content is provided for educational purposes only and does not constitute investment advice.
1. Bullish Engulfing
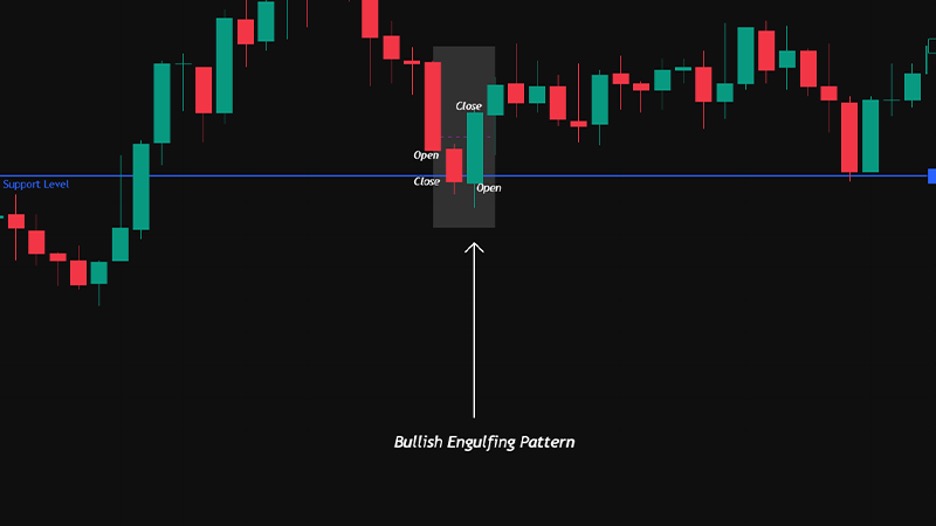
The bullish engulfing is arguably the most widely recognised two-candle reversal pattern. It appears after a decline and signals that buyers have decisively overwhelmed sellers in a single session.
Formation Rules
The first candle is bearish, reflecting the existing downward pressure. The second candle opens at or below the first candle’s close and then rallies to close above the first candle’s open, so that its real body completely engulfs the first candle’s real body. The larger the second candle relative to the first, the stronger the signal.
What It Tells the Trader
The pattern communicates a complete shift in intra-session control. Sellers opened the second candle with confidence, yet buyers absorbed every sell order and pushed price well beyond the prior candle’s opening level. When this occurs at a recognised support zone, a moving average, or the lower boundary of a range, it suggests that demand has returned with force.
2. Bearish Engulfing
The bearish engulfing is the mirror image of its bullish counterpart. It forms after a rally and warns that selling pressure has taken over.
Formation Rules
The first candle is bullish, consistent with the prevailing uptrend. The second candle opens at or above the first candle’s close and sells off to close below the first candle’s open, with its real body fully engulfing the first. Shadows are secondary; the body relationship is what defines the pattern.
What It Tells the Trader
Buyers attempted to extend the move but were overpowered within the same session. The reversal carries more weight when it appears at resistance, beneath a declining moving average, or after an extended rally where momentum indicators such as RSI are in overbought territory. Volume expansion on the second candle adds further conviction.
3. Piercing Line
The piercing line is a bullish reversal pattern that appears after a downtrend. It is structurally similar to the bullish engulfing but slightly less aggressive, because the second candle does not fully engulf the first.
Formation Rules
The first candle is a long bearish candle. The second candle opens below the first candle’s low (a gap down in equity markets, or simply below the prior close in forex) and then rallies to close above the midpoint of the first candle’s body. The critical threshold is that 50% penetration level: if the second candle closes below it, the pattern does not qualify.
What It Tells the Trader
Sellers gapped price lower or pressed it down at the open, yet buyers stepped in aggressively enough to recover more than half of the prior session’s loss. That recovery, whilst not a full engulfing, signals meaningful demand. The pattern is most reliable at established support zones or at the lower Bollinger Band after a period of contraction.
4. Dark Cloud Cover
The dark cloud cover is the bearish counterpart of the piercing line. It forms at the top of a rally and signals that sellers have begun to assert control.
Formation Rules
The first candle is a long bullish candle. The second candle opens above the first candle’s high and then sells off to close below the midpoint of the first candle’s body. As with the piercing line, the 50% penetration threshold is the qualifying criterion.
What It Tells the Trader
Buyers pushed price to a new session high at the open of the second candle, but sellers took over and drove it back through more than half of the prior gains. This pattern is particularly effective near resistance levels or when it appears inside a distribution range identified on a higher timeframe.
Both the piercing line and the dark cloud cover gain reliability when the first candle's body is notably long. A short-bodied first candle reduces the pattern's significance because there is less ground for the second candle to recover or surrender.
5. Bullish Harami
The bullish harami (from the Japanese word for pregnant) is a subtler reversal signal that indicates hesitation rather than outright reversal. It forms after a decline and suggests that bearish momentum is stalling.
Formation Rules
The first candle is a long bearish candle. The second candle is a small-bodied bullish candle whose entire real body fits within the real body of the first candle. The second candle opens above the first candle’s close and closes below the first candle’s open. Shadows may extend beyond the first candle’s body, but the real body must be contained.
What It Tells the Trader
The small second candle signals indecision. Sellers could not extend the move, yet buyers have not demonstrated enough strength to reverse it decisively. For this reason, the bullish harami is best treated as a warning signal rather than a standalone entry trigger. Traders typically wait for a third candle to close above the second candle’s high before entering a long position.
6. Bearish Harami
The bearish harami is the inverse of the bullish version. It appears after a rally and warns that upward momentum may be exhausting.
Formation Rules
The first candle is a long bullish candle. The second candle is a small-bodied bearish candle contained entirely within the first candle’s real body. The second candle opens below the first candle’s close and closes above the first candle’s open.
What It Tells the Trader
The contraction in range from the first candle to the second suggests that buyers have lost their aggressive posture. Like its bullish counterpart, the bearish harami requires confirmation. A close below the second candle’s low on the following session strengthens the case for a reversal. Without that confirmation, the pattern may simply represent a pause before continuation.
Q: What is the difference between a harami and an engulfing pattern?
A: The two patterns are structural opposites. In an engulfing pattern, the second candle’s body is larger than and wraps around the first. In a harami, the second candle’s body is smaller and fits inside the first. Engulfing patterns signal a decisive shift in control; harami patterns signal indecision and require additional confirmation before acting.
Read More: Day Trading Patterns for Forex
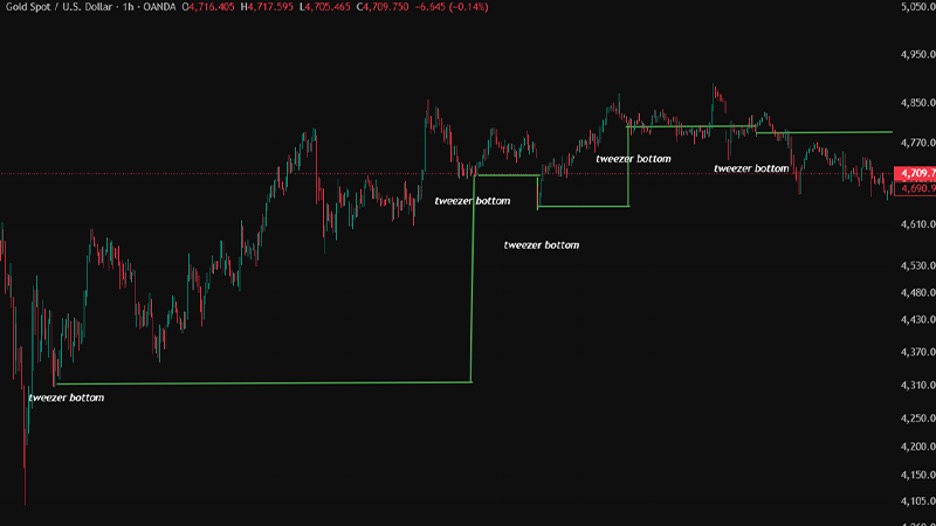
7. Tweezer Bottom
Tweezer bottoms are reversal patterns that appear at the end of a decline. They are defined by two candles that share approximately the same low, suggesting that a specific price level is being defended by buyers.
Formation Rules
The first candle is bearish, in line with the existing downtrend. The second candle is bullish. Both candles print lows that are equal or nearly equal. The matching lows indicate that sellers tested a level twice and failed to push through it, which is a form of double rejection at a micro level.
What It Tells the Trader
The repeated defence of the same low creates a short-term floor. When this floor aligns with a broader support zone, a Fibonacci level, or a demand area, the probability of a bounce increases. Volume analysis adds context: if the second candle’s volume exceeds the first, buyers are not only defending the level but doing so with greater participation.
8. Tweezer Top
The tweezer top is the bearish counterpart of the tweezer bottom. It forms at the peak of a rally when two consecutive candles print approximately the same high.
Formation Rules
The first candle is bullish, consistent with the uptrend. The second candle is bearish. Both candles share matching or near-matching highs. The equal highs indicate that buyers attempted to extend the rally twice but were met with selling pressure at the same level.
What It Tells the Trader
The repeated failure at the same high creates a micro resistance ceiling. This pattern is most effective at established resistance levels, round numbers, or the upper boundary of a consolidation range. A third candle that closes below the second candle’s low provides the confirmation many traders require before entering a short position.
9. The Kicker Pattern
The kicker is one of the most powerful two-candle formations in candlestick analysis. It is characterised by a gap between two candles of opposite colour that signals a violent shift in sentiment, often driven by a fundamental catalyst such as an earnings surprise, a central bank decision, or an unexpected geopolitical event.
Formation Rules
In a bullish kicker, the first candle is bearish. The second candle gaps up and opens above the first candle’s open, then closes higher, forming a strong bullish body. In a bearish kicker, the first candle is bullish. The second candle gaps down and opens below the first candle’s open, then closes lower. The defining feature is the gap: the second candle’s open does not overlap with the first candle’s body at all.
What It Tells the Trader
The gap represents a complete absence of price negotiation between the two sessions. Overnight sentiment shifted so dramatically that the market opened on the opposite side of the prior session’s entire range. This level of displacement makes the kicker one of the highest-conviction two-candle signals. In forex, where true gaps are less common outside of weekend opens, the kicker is rarer but carries extreme significance when it does appear.
The kicker pattern is sometimes called the most reliable candlestick reversal signal. Its rarity is part of what gives it power: because it requires a genuine gap driven by a fundamental catalyst, the resulting move tends to carry strong follow-through. However, its infrequency also means traders cannot build a strategy around it alone.
How to Filter and Confirm Dual Candlestick Patterns
Identifying a pattern is only the first step. Filtering for quality and confirming the signal before execution separates disciplined trading from pattern-chasing.
Location as the Primary Filter
A dual candlestick pattern gains relevance when it forms at a level where the market has previously shown a reaction. This includes horizontal support and resistance zones, dynamic levels such as the 50-period or 200-period moving average, Fibonacci retracement levels, and the boundaries of established ranges. A pattern forming in the middle of a range or in an area with no structural significance should be treated with scepticism.
Volume Confirmation
The second candle in a reversal pattern should ideally form on higher volume than the first. Rising volume on the confirmation candle indicates that the shift in sentiment is backed by genuine participation, not just a thin-market anomaly. On MT4 and MT5, tick volume serves as a practical proxy for participation in liquid forex pairs.
Indicator Alignment
Momentum indicators provide a useful secondary filter. A bullish engulfing at support is more compelling when RSI is below 30 or when MACD histogram is diverging positively. Similarly, a bearish engulfing at resistance carries more weight when RSI is above 70 or when a bearish momentum divergence is already in place.
Q: Should I enter immediately when a dual candlestick pattern completes?
A: Not always. Aggressive traders enter at the close of the second candle if the pattern forms at a high-conviction location with volume confirmation. Conservative traders wait for a third candle to confirm the direction, entering only after it closes beyond the second candle’s high (for bullish patterns) or low (for bearish patterns). The conservative approach sacrifices some price but reduces the frequency of false signals.
Read More: Candlestick Analysis and Trading with Candlestick Patterns
Bullish vs Bearish Two-Candle Patterns at a Glance
The following table summarises each pattern alongside its bearish equivalent for quick reference.
| Bullish Pattern | Bearish Counterpart |
|---|---|
Bullish Engulfing (full body wrap, strong reversal) | Bearish Engulfing (full body wrap, strong reversal) |
Piercing Line (closes above 50% of prior body) | Dark Cloud Cover (closes below 50% of prior body) |
Bullish Harami (small body inside prior, indecision) | Bearish Harami (small body inside prior, indecision) |
| Tweezer Bottom (matching lows, double rejection) | Tweezer Top (matching highs, double rejection) |
| Bullish Kicker (gap up, violent sentiment shift) | Bearish Kicker (gap down, violent sentiment shift) |
Conclusion
Dual candlestick patterns distil the battle between buyers and sellers into a two-session story. Whether the narrative is a violent engulfing reversal, a cautious harami pause, or a gap-driven kicker, each pattern communicates a shift in the balance of power that traders can act on when the context supports it.
The nine patterns covered in this guide form a practical toolkit for any timeframe and any liquid market. Master their formation rules, apply them at structurally significant price levels, confirm with volume and momentum, and protect every entry with a stop referenced to the pattern’s extreme. That disciplined process, repeated consistently, turns candlestick recognition from a visual exercise into a genuine analytical edge.