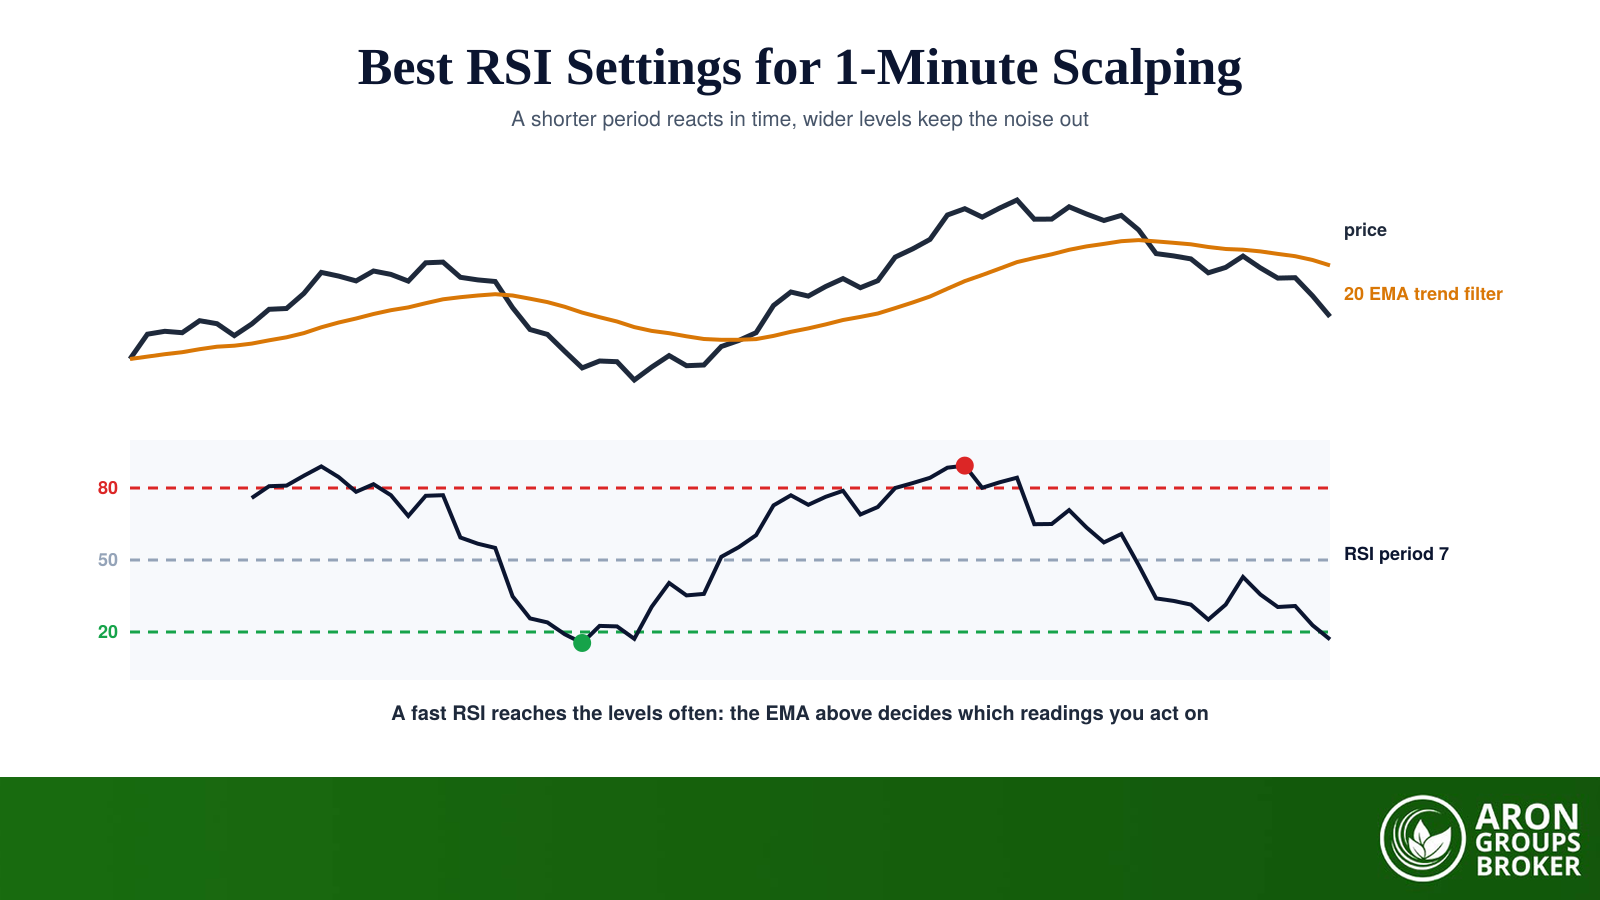

The most widely used RSI settings for 1-minute scalping are a period of 5 to 9 with the levels moved out to 80 and 20, filtered by a 20 period EMA so that only signals in the direction of the prevailing trend are taken. That combination exists because the default configuration, period 14 with 70 and 30, was never designed for a chart where a full trade can open and close inside ninety seconds.
Nothing here is a secret setting. Shortening the lookback makes the oscillator react sooner, widening the levels removes the extra signals that speed creates, and the moving average stops you fading a trend that has no intention of stopping. Each change fixes a problem the previous one caused, which is why they are used together by most people scalping forex on the 1-minute chart.
This guide covers what the period actually changes, why 80 and 20 replace 70 and 30, how to add the trend filter, where the Stochastic RSI fits, exact entry, stop and target rules, and the cost arithmetic that decides whether any of it makes money.
- Use a period of 5 to 9 on the 1-minute chart; 7 is the common compromise between speed and noise.
- Move the levels to 80 and 20, because a short period reaches 70 and 30 far too often to be selective.
- Filter every signal with a 20 period EMA and take oversold readings only above it, overbought readings only below it.
- Stochastic RSI is faster still and suits ranging conditions, but it whipsaws badly in a trending 1-minute market.
- Scalping produces a naturally high win rate with poor risk-reward, so spread and commission, not accuracy, decide the outcome.
Why the Default RSI Settings Fail on a 1-Minute Chart
The Relative Strength Index compares the average size of recent gains with the average size of recent losses and expresses the result on a scale of 0 to 100. With the default 14 period lookback, each new bar is only a small part of that average, so the line moves slowly and deliberately. On a daily chart that is a feature. On a 1-minute chart it means the reading confirms a move that has already finished, and a scalp that lasts four minutes cannot wait for a fourteen bar average to catch up.
Risk Disclosure
Trading forex and CFDs carries a high level of risk and can result in the loss of all your capital. This content is educational and is not investment advice. Never risk money you cannot afford to lose.
Where the Defaults Came From
J. Welles Wilder introduced the RSI in his 1978 book New Concepts in Technical Trading Systems, along with the 14 period default and the 70 and 30 levels. It is worth remembering the context: he was working with hand-calculated daily commodity charts, and 14 was roughly half a monthly cycle. It was a sensible starting point, not an optimum, and treating it as sacred on a timeframe that did not exist in 1978 is behind most complaints that RSI does not work for scalping.
The Fast RSI: Periods 5, 7 and 9
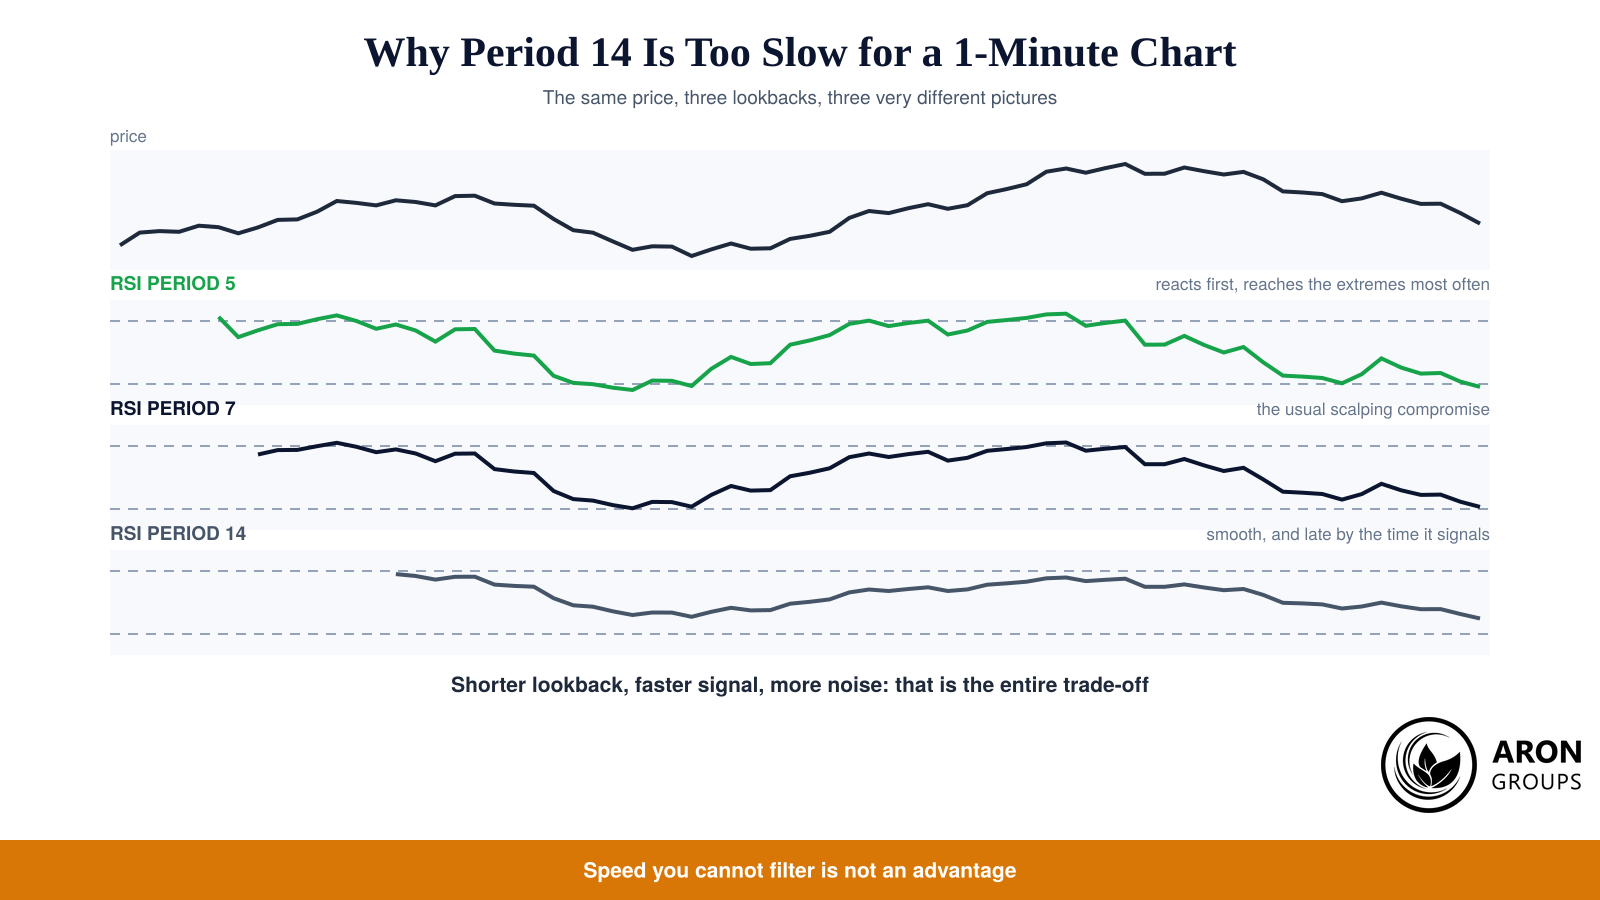
Shortening the lookback changes one thing: how much weight each new bar carries. At period 5, a single strong candle can move the RSI twenty points, so the line reaches its extremes early enough to act on. At period 14 the same candle barely registers. The picture below uses one price series and three lookbacks, which is the clearest way to see what you are buying and what you are giving up.
| Period | Behaviour on the 1-minute chart | Suits |
|---|---|---|
| 5 | Extremely reactive, reaches 80 and 20 many times per hour | Fast scalpers taking many small trades |
| 7 | Reactive but readable, the usual scalping default | Most 1-minute momentum and pullback trading |
| 9 | Slightly smoother, fewer signals, a little later | Traders who want fewer and cleaner setups |
| 14 | Smooth and slow, signals arrive after the move | Higher timeframes, not 1-minute scalping |
Table 1: How the RSI lookback behaves on a 1-minute chart and who each setting suits.
Shortening the period is not a scalping invention. Larry Connors built documented mean reversion systems around a 2 period RSI, buying readings below 10 while price sat above its 200 period average, which is the same architecture recommended here at a different scale: a very fast oscillator, deep levels and a slower trend filter. That precedent matters because it shows the approach has been tested systematically rather than passed around screenshots.
Why Scalpers Move the Levels to 80 and 20
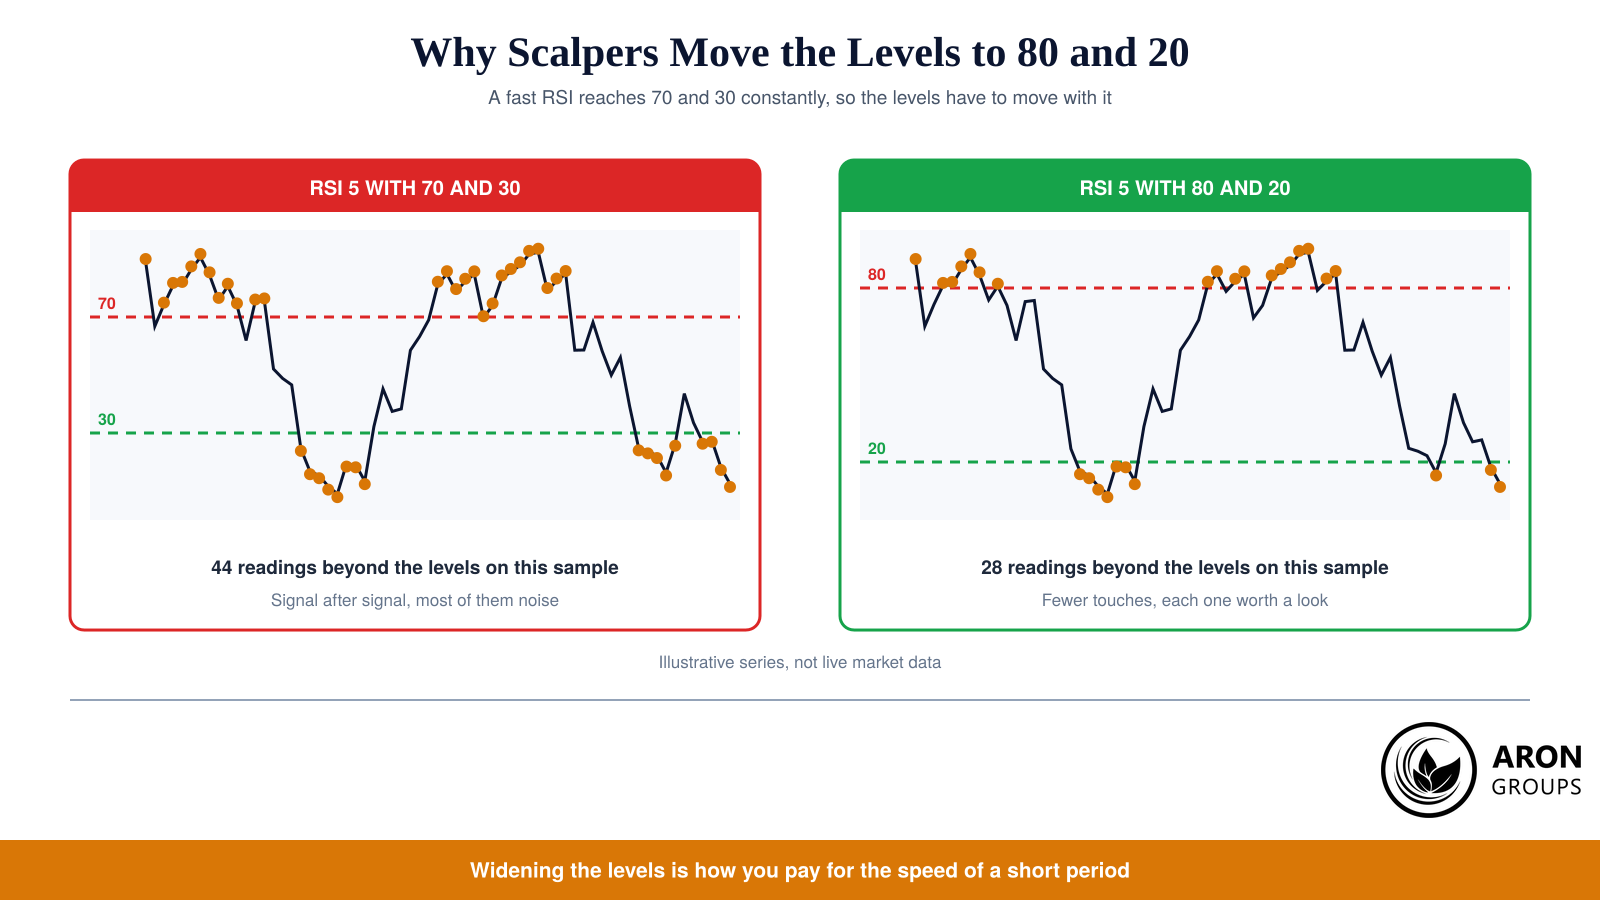
A faster oscillator creates a second problem. Because each bar carries more weight, a period 5 or 7 RSI crosses 70 and 30 constantly, and a level that triggers every few minutes selects nothing. Widening the thresholds to 80 and 20 restores the filter: the reading now requires a genuine run of one-sided candles rather than an ordinary wiggle.
The trade-off is honest and worth stating. Wider levels mean fewer signals, later entries and some missed moves that never reach the extreme. What you gain is a much lower proportion of signals that reverse immediately, which matters more than it sounds when every trade pays a spread. If 80 and 20 feel too quiet on your instrument, 75 and 25 is a reasonable middle setting, but test the change with out-of-sample backtesting rather than adjusting it after a run of losses.
Rule
Levels are not symmetrical in a trend. Constance Brown's range rules note that RSI tends to hold roughly 40 to 80 in an uptrend and 20 to 60 in a downtrend, so in a strong 1-minute run a pullback may bottom near 40 and never reach 20 at all.
The Trend Filter: Fast RSI Plus a 20 EMA
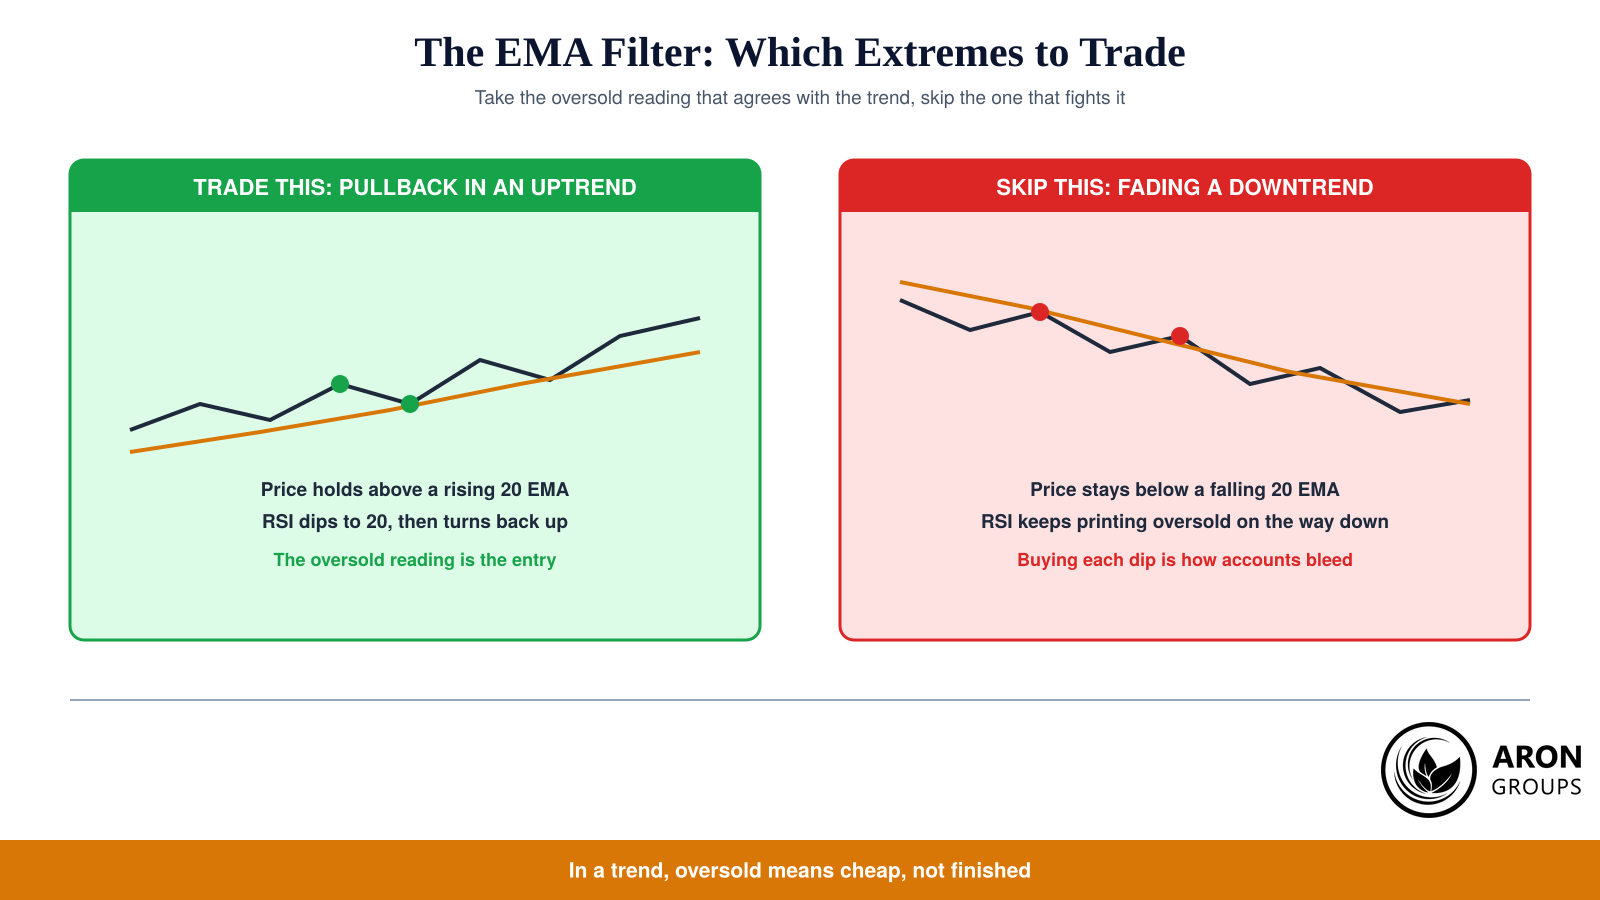
The single biggest improvement to any RSI scalping method is refusing to trade against the trend. An oscillator says a move has gone far relative to recent bars; it does not say the move is finished. In a strong 1-minute trend the RSI can sit above 80 for twenty bars while price keeps climbing, and every fade is a loss. A 20 period exponential moving average on the price chart solves most of this by dividing signals into two piles.
The rule is simple. When price is above a rising 20 EMA, take oversold readings as pullback entries in the direction of the trend and ignore overbought readings entirely. When price is below a falling 20 EMA, take overbought readings as short entries and ignore oversold ones. When the EMA is flat and price is crossing it repeatedly, there is no trend to follow and the cleanest decision is to stop trading until one appears.
What about divergence on a 1-minute chart?
Regular divergence is unreliable at this speed because a fast RSI produces higher lows against lower price lows constantly. Hidden divergence, where price makes a higher low but RSI makes a lower low inside an uptrend, is the more useful version because it points the same way as the trend filter rather than against it.
Stochastic RSI Settings for the 1-Minute Chart
The Stochastic RSI, created by Tushar Chande and Stanley Kroll, applies the stochastic formula to the RSI itself rather than to price. It measures where the current RSI sits within its own recent range, which produces a far more sensitive oscillator that spends much of its time pinned at 0 or 100. On a 1-minute chart that sensitivity cuts both ways.
| Fast RSI | Stochastic RSI | |
|---|---|---|
| Measures | Average gains against average losses | Where RSI sits inside its own recent range |
| Typical scalping settings | Period 5 to 9, levels 80 and 20 | RSI 14, stochastic 8 to 14, %K 3, %D 3 |
| Signal frequency | Moderate once levels are widened | Very high, often pinned at the extremes |
| Best conditions | Trending, with the EMA filter | Ranging or gently oscillating markets |
| Main weakness | Late in violent moves | Whipsaws badly in a strong trend |
Table 2: RSI and Stochastic RSI compared for 1-minute scalping.
In practice most scalpers use one or the other, not both, because two oscillators built from the same input rarely disagree in a useful way. If you prefer the Stochastic RSI, use the crossover of the %K and %D lines out of an extreme rather than the extreme itself, and keep the EMA filter in place. The extra sensitivity makes the trend filter more important, not less.
Execution: Entries, Stops and Targets
Settings are the easy part. What follows is the sequence that turns a reading into a trade with a defined loss, which is the only version of this strategy worth running.
Step 1: Establish the Trend First
Before looking at the oscillator, check the 20 EMA slope and where price sits relative to it. This decides which half of the RSI you are allowed to use for the next several minutes. Most losing 1-minute RSI trades are taken in the wrong half.
Step 2: Wait for the Extreme and the Turn
An RSI reading below 20 is a condition, not a trigger. Wait for the line to turn back up through 20, ideally as a candle closes in the direction of the trend. Entering while the reading is still falling means catching a move that is still accelerating against you.
Step 3: Place the Stop Beyond Structure
Put the stop a few pips beyond the swing low that produced the oversold reading, not at a round number of pips. On the 1-minute chart that distance is typically small, which is exactly why spread matters so much: a 5 pip stop with a 1 pip spread is already a fifth of your risk.
Because those distances are tight, position sizing has to be calculated per trade rather than left fixed, and a risk-reward indicator on the chart keeps the arithmetic visible while the trade is live. A fixed lot size means your risk changes every time volatility does.
Step 4: Take the Target Mechanically
Set the target at the recent swing high for a long, at the EMA if you are fading back to it, or at a fixed multiple of the stop. Whatever you choose, take it without negotiation. The main way 1-minute traders convert a winning method into a losing one is holding for more after the plan said to exit.
Mini Example: A Textbook 1-Minute Pullback
EUR/USD is trending up on the 1-minute chart and price has held above a rising 20 EMA for the last forty bars. A three candle pullback drags the period 7 RSI down to 18, and price stalls one pip above the EMA rather than breaking it.
The next candle closes higher and the RSI turns back up through 20. The long is taken on that close, the stop goes two pips below the pullback low, and the target is the prior swing high roughly nine pips away. The trade either resolves within a few minutes or it does not, and if price closes back below the EMA first the position is cut regardless of what the oscillator says.
The Cost Problem Nobody Advertises
On a 1-minute chart, transaction costs are not a detail, they are the strategy. A scalper taking twenty trades a session pays the spread twenty times, plus commission on an ECN account, while targeting moves of a few pips. Liquidity decides how large that cost is, and the Bank for International Settlements documents how heavily FX turnover concentrates in particular hours, which is why the same strategy behaves differently at the London open and at 3am.
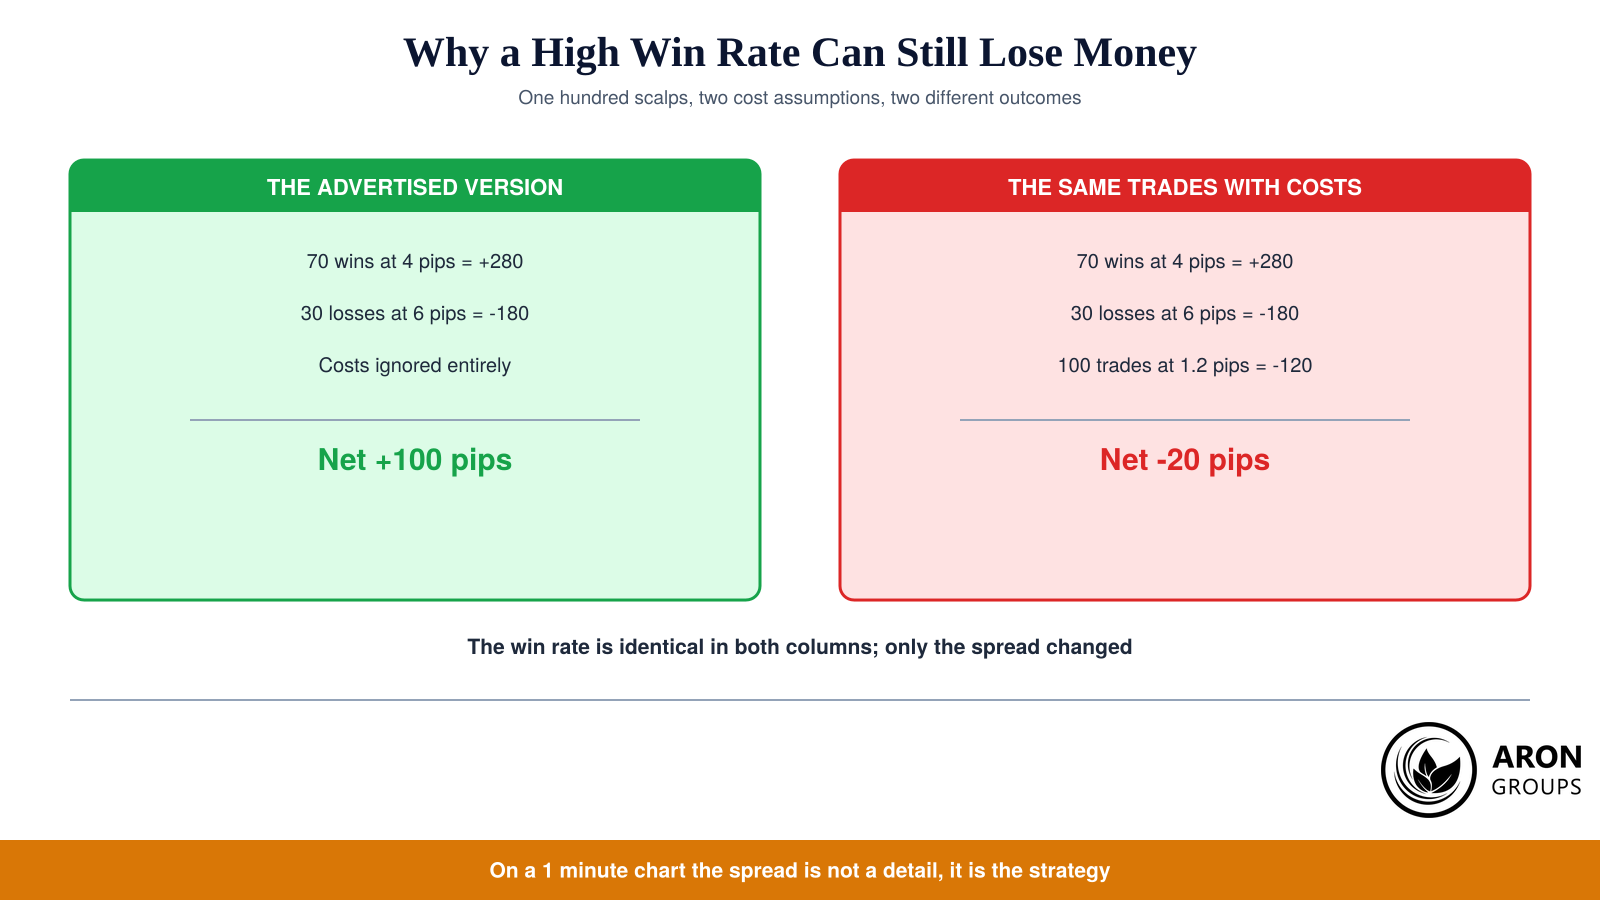
The arithmetic above is the honest version of a scalping track record. Seventy wins at four pips against thirty losses at six pips looks like a profitable system until the spread is charged on all one hundred trades, at which point it is not. Nothing about the RSI settings changed. This is why serious scalpers care more about spread, execution and time of day than about which period they use.
Honest Limits: Why Win Rate Is the Wrong Metric
Mean reversion scalping produces a high win rate almost by construction. Taking a small target and allowing a wider stop means most trades finish green, and a strategy of this shape can easily win seven times out of ten while losing money overall. The number that matters is expectancy, the average result per trade after costs, which combines the win rate with the size of the average win and loss. A published win rate with no risk-reward figure attached tells you nothing at all.
The wider evidence deserves the same honesty. Studies of active day trading have consistently found the majority of participants lose money, and one detailed study of Brazilian futures traders found that of those who persisted for more than three hundred days, 97 per cent lost money and under one per cent earned more than a bank clerk’s starting salary. That is not an argument against learning the technique, but it is an argument for treating high-frequency trading as a skill with a real risk of ruin rather than a shortcut.
Practical consequences follow. Keep a full record so the equity curve, not memory, tells you whether the settings work; test any change on data the settings were not chosen on; and accept that a period that suits EUR/USD at the London open may be wrong for gold in the afternoon. There is no single best RSI setting, only one that fits the instrument, the hour and the trader who has to execute it.
Where Aron Groups Fits
Scalping is the trading style most sensitive to execution quality. Aron Groups runs MetaTrader 5 with market execution on ECN accounts, so entries fill at the next available price rather than being requoted mid-move, and the RSI and Stochastic RSI are both native to the platform, adjustable from the indicator properties in a few seconds.
For testing settings, the commission-free Nano account trades from 0.0001 lots, which lets you run a genuine hundred trade sample on live spreads for a trivial amount of money, and a demo evaluation costs nothing at all while you decide which period and levels suit your instrument. Build the sample first, then decide whether a sound risk management strategy can support scaling it up.
Conclusion
The best RSI settings for 1-minute scalping are the ones that acknowledge what the timeframe actually is. A period of 5 to 9 gives you a reading in time to act on, levels at 80 and 20 stop that speed from drowning you in signals, and a 20 EMA decides which half of the oscillator you are allowed to use. Those three adjustments fix the default configuration for a chart it was never designed for.
What settings cannot fix is the arithmetic underneath. Costs are charged on every trade, the win rate flatters a strategy with a small target and a wider stop, and a genuine trading edge on this timeframe comes from execution and discipline far more than from a number in a settings box. Keep the size small, measure the drawdown honestly, put capital preservation ahead of trade count, and the fast RSI becomes a useful timing tool rather than another promise.
Frequently Asked Questions
Short answers to the questions traders ask most about RSI scalping settings.
What is the best RSI period for 1-minute scalping?
Most 1-minute scalpers use a period between 5 and 9, with 7 the common default. Period 5 gives the earliest signals and the most noise, period 9 gives fewer and cleaner ones slightly later. Test both on your own instrument and session before committing, because volatility differs sharply between pairs and hours.
Should I use 80/20 or 70/30 for scalping?
Use 80 and 20 with a short period. At period 5 or 7 the oscillator crosses 70 and 30 so frequently that those levels stop being selective, and most of the extra signals reverse immediately. If your instrument is unusually quiet, 75 and 25 is a fair compromise.
Is RSI the best indicator for a 1-minute chart?
It is a strong choice for timing entries within a trend, but no oscillator is complete on its own. RSI tells you a move has stretched relative to recent bars; it cannot tell you whether the trend is over. Pairing it with a moving average or with market structure matters more than choosing between RSI, Stochastic RSI or anything else.
Can RSI scalping be automated?
The rules are mechanical enough to code, and automating them removes the hesitation that hurts manual scalpers most. The difficulty moves to execution: a backtest that assumes perfect fills and a fixed spread will overstate results substantially on a 1-minute timeframe, so model realistic costs and slippage before trusting any automated version.