


In trading, judging whether a move is a strong breakout or a temporary pullback is one of the most vital skills. Many new traders treat them as opposites, but good analysis shows pullbacks often follow breakouts as the next phase in markets.
Understanding their differences and how they connect helps you make better trading decisions, spot cleaner entries, and manage risk over time. Stay with us as we break down both patterns and show how to choose the approach that fits you best today.

- Pullbacks and breakouts complement each other: a breakout is the initial thrust, and the pullback acts as confirmation for the move.
- Entering on the breakout is more aggressive and higher risk, while entering on a pullback is usually more conservative for traders.
- Signal confirmation prevents errors: breakout validity is judged by trading volume, while pullback strength is assessed with candlestick patterns in practice.
- Choosing between the two depends on your personality and risk tolerance, and neither approach has an absolute advantage over the other.
What is a breakout, and why does it matter to traders?
A breakout happens when an asset’s price moves beyond a key level, such as support or resistance, and escapes its prior tight range. This move often signals the start of a new trend, so many traders treat it as a potential entry point.
A breakout matters to traders because it can:
- Signal the early start of a new uptrend or downtrend.
- Let you enter the market in the first stages of a major move.
- Gain more credibility when trading volume rises, helping you make more confident decisions.
- Act as an aggressive entry for traders seeking faster profits.
What is a pullback, and how is it different from a price correction?
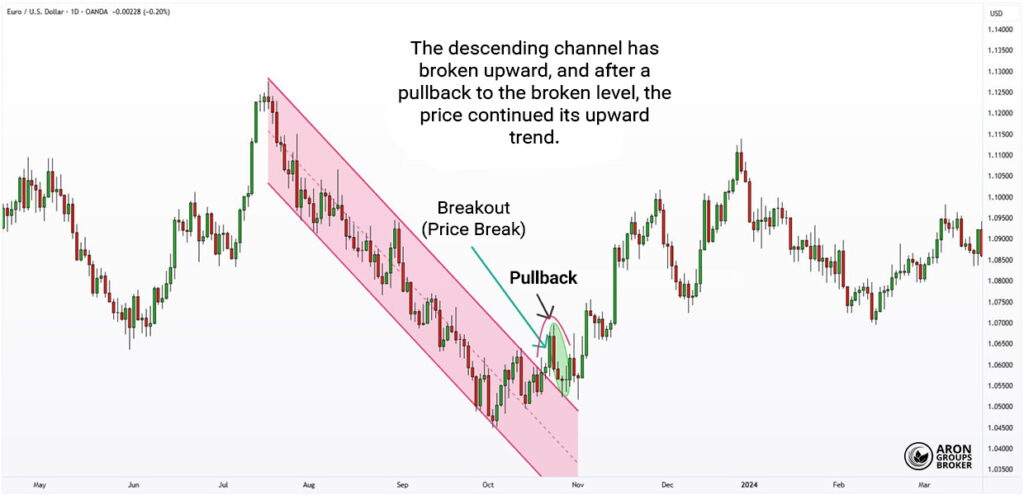
A pullback is a temporary return to a level that was previously broken, such as resistance or support that now flips roles. Put simply, a pullback is a second entry opportunity after a breakout and usually happens in the direction of the main trend.
By contrast, a price correction is a temporary move against the prevailing trend, either down or up, that helps rebalance the market. Corrections often occur to ease overbought or oversold conditions, and they can last longer and run deeper than pullbacks.
A correction does not always mean the trend has changed, and it can end with the original trend continuing.
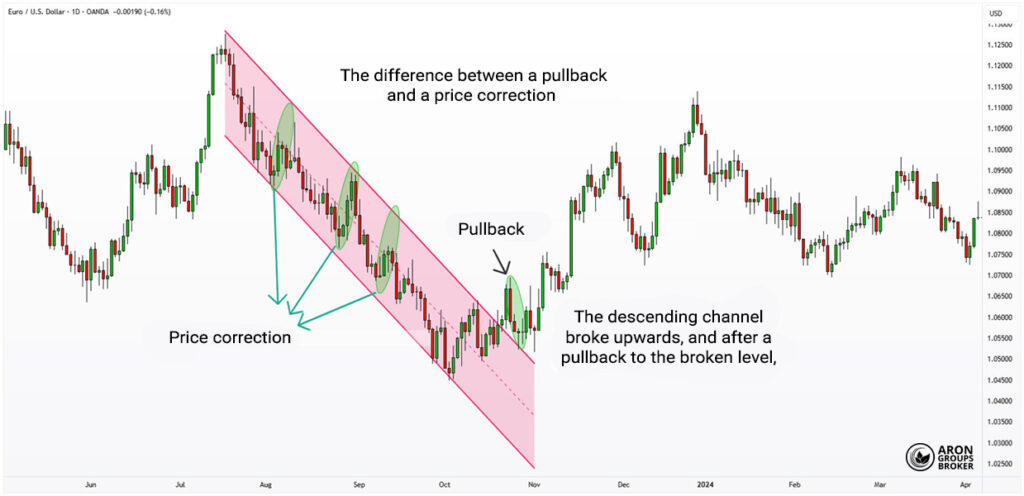

Professional traders use pullbacks to enter with lower risk, while price corrections are more useful for long-term analysis and position management.
Breakout vs pullback: which offers a stronger entry signal?
Breakouts and pullbacks are two key phases in technical analysis, and traders often use both as entry triggers. Which one is stronger depends on your strategy, risk tolerance, and the confirmations you require before committing capital.
With a breakout, the trader enters immediately after the price breaks through support or resistance. This entry is faster, but it carries more risk if the move is a false breakout.
With a pullback, the entry happens later, after the price returns to the broken level.
This approach is more conservative and usually comes with stronger confirmation.
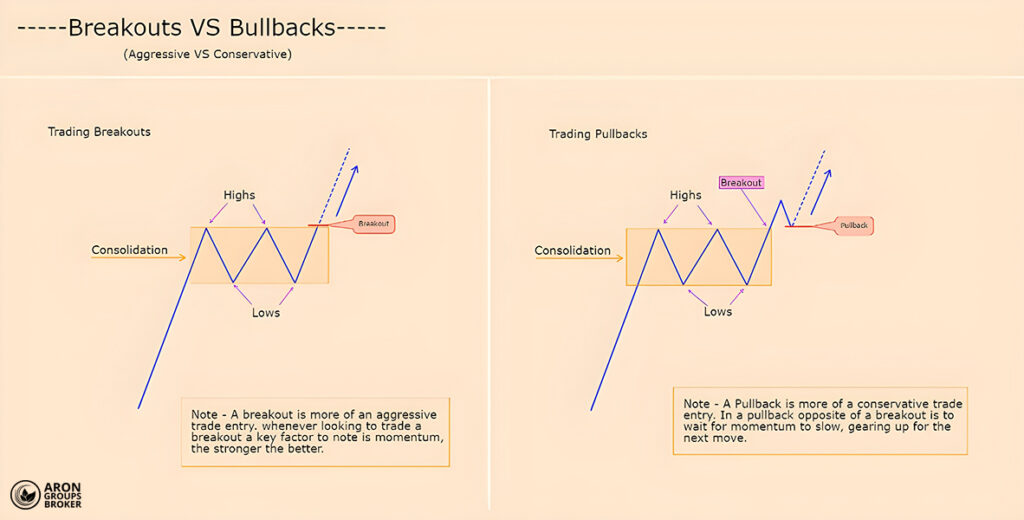
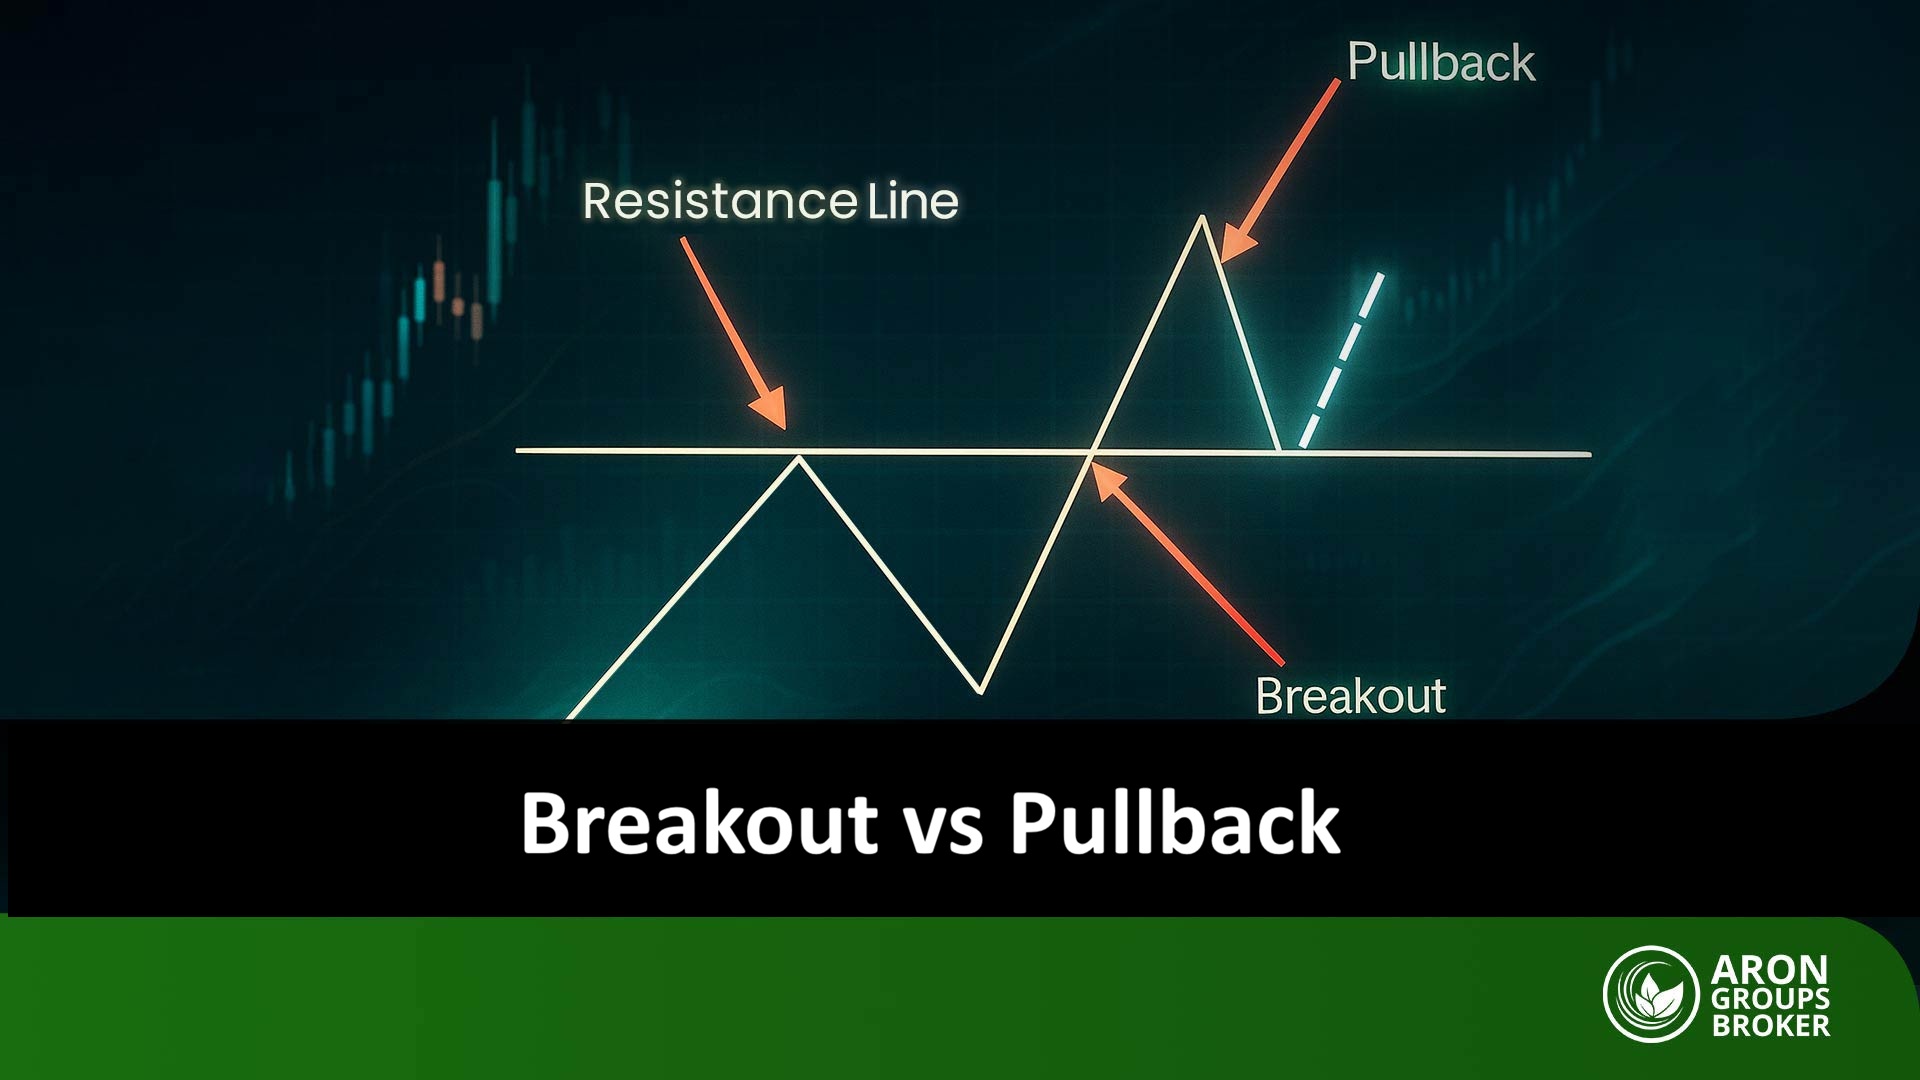
What the image shows about these two entry styles:
- In a breakout, entry happens right after the level breaks, suiting traders chasing quicker gains with higher risk.
- In a pullback, entry happens after price retests the broken level, offering a more conservative entry with fewer errors.
- These methods reflect two very different trading styles: aggressive with breakouts, and conservative with pullbacks.
For a clearer visual comparison, see “Pullback vs Breakout Trading Pros and +Cons” on TradingView.
Key insight:
Breakouts driven by major institutional liquidity shifts can start strong, aligned trends across multiple markets, even in low volume.
Comparing risk and returns in breakouts vs pullbacks
Risk and return can differ sharply between breakouts and pullbacks.
In this section, we compare both strategies through the lens of risk management and profit potential.
Breakout vs pullback from a risk perspective
Entering a breakout usually carries a higher risk because false breakouts can happen, and confirmation is often limited.
A pullback is typically lower risk because it forms a confirming structure and allows a tighter stop-loss placement.
Breakout vs pullback from a return perspective
Valid breakouts can deliver fast, large gains, but they often come with a weaker risk-to-reward profile.
Pullback entries usually offer a cleaner risk-to-reward (R/R) setup and support steadier gains as the trend continues.
| Criterion | Breakout | Pullback |
|---|---|---|
| Risk | Higher, in fakeouts, the price can reverse quickly and cause losses. | Lower entry follows a retracement and confirmation of the broken level. |
| Potential return | Higher, early entry near the trend start can capture the biggest move. | Lower; part of the move has already happened, and entry is later in the path. |
| Stop-loss placement | Often just below or above the breakout level, close stops exist, but risk is higher. | Often, behind the retest zone (e.g., prior support or Fibonacci), there is more breathing room. |
| Suitable trading style | Suit aggressive traders seeking quick profits and accepting higher risk. | Suits conservative traders who prefer confirmed, higher-probability entries. |
To choose between them, consider your position sizing plan, your experience, and the market context.
Price behaviour and entry confirmation at breakout and pullback points
In technical analysis, seeing a level break is not enough on its own to enter a trade. You need price-action confirmation and other technical signals to avoid bad entries and costly mistakes.
Price behaviour during a breakout
- When price clears an important support or resistance level, a noticeable rise in volume increases breakout credibility.
- Candle structure matters too, and marubozu-style candles with long bodies and little wicks show strong directional pressure.
- Final confirmation comes when the breakout candle closes above resistance (or below support) with volume above its average.
- Without these confirmations, the risk of a fake breakout increases sharply.
Price behaviour during a pullback
For safer pullback entries, it helps to wait for reversal candlestick patterns, such as:
- A hammer pattern in an uptrend.
- A bullish or bearish engulfing candle, depending on the trend direction.
You can also use indicators for additional confirmation:
- RSI, if it rebounds from the oversold zone.
- A moving average (MA) strengthens the validity of a pullback if the retest level aligns with it.
In both breakouts and pullbacks, confirming price action and volume helps filter false signals. Entering without confirmation turns trading into gambling, not a repeatable process.
Combining breakouts and pullbacks for a better entry
For more precise and lower-risk entries, you can use breakouts and pullbacks as complementary signals. This approach avoids choosing one method and instead uses the strengths of both.
- First, identify the break of a key level.
- Instead of entering immediately, wait for the price to return to the broken level.
- If you see confirmation, such as rising volume or reversal candles, enter the position.
This combined method lets you use the breakout signal with a smart delay, while reducing exposure to fakeouts.
Trade entry strategy after a pullback
Entering a trade after a pullback is one of the most reliable ways to reduce risk and improve technical precision.
Defining the PRZ entry zone
A PRZ, or Potential Reversal Zone, is the area where you expect the price to turn after the pullback. To identify this zone, traders often use the following tools:
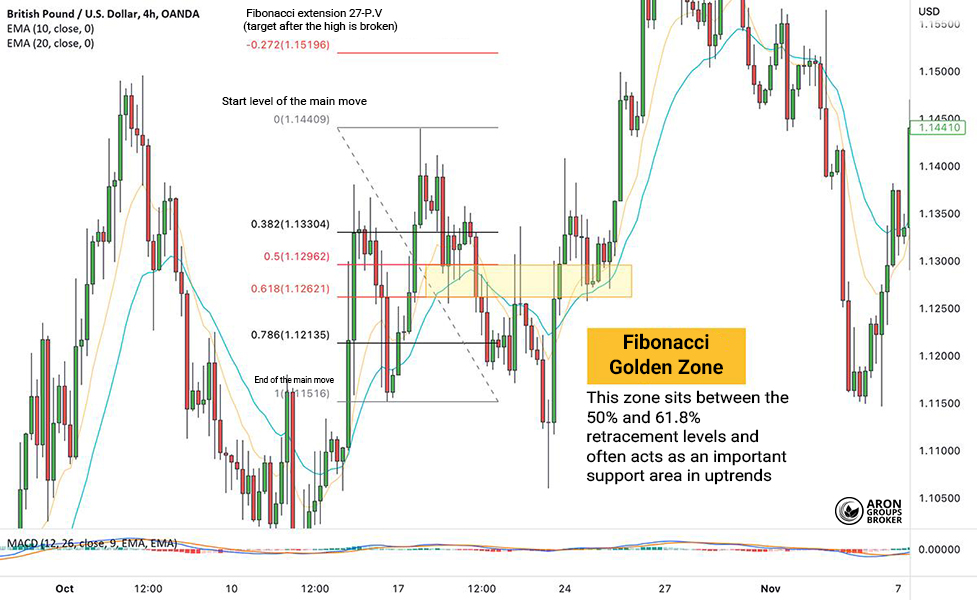
- Fibonacci retracement (38.2% to 61.8%): one of the most common ranges for a price reversal.
- A broken support or resistance level.
- A trendline or a moving average.
When several technical tools align, the PRZ becomes more credible and easier to trade with confidence. On successful charts, the PRZ is often where the pullback ends and a new bullish or bearish structure begins.
Confirming a pullback with candlestick patterns and indicators
After the price enters the PRZ, it is best to wait for a confirmation signal before taking the trade. Common confirmation tools include:- Reversal candlestick patterns: such as a hammer, bullish engulfing, or a pin bar.
- Indicators:
- RSI: a rebound from overbought or oversold territory.
- MACD: a bullish crossover in the direction of the trend.
- Moving averages: when the price touches MA20 or MA50 and then rejects back into the trend.

Setting stop-loss and take-profit in pullback trades
In pullback trading, risk management is decisive because even strong PRZ zones can fail without warning. That is why precise stop-loss and take-profit placement are core to the trading process.
Stop-loss
Your stop-loss should sit where an invalid pullback cannot turn into a large, uncontrolled loss.
- In an uptrend: place it slightly below the pullback low, because breaking that low hints at further downside.
- In a downtrend: place it above the pullback high, because breaking that high suggests the drop is failing.
Many professionals place the stop slightly beyond the PRZ to avoid noise, while still protecting against reversal risk.
Take-profit
Your take-profit should be set using market structure and a sensible risk-to-reward ratio.
- First target: the nearest previous swing high or low, or the 100% Fibonacci level matching the pre-pullback wave.
- Second target: aim for at least a 1:2 risk-to-reward ratio, or more, based on trend strength. If your stop is 20 pips, your take-profit should be at least 40 pips to keep the trade mathematically sound.
Professional breakout trading strategies
Breakout trading is one of the most popular ways to enter strong trends, but without confirmation and a plan, it can trigger costly fakeouts. Below are three professional approaches that can improve accuracy when trading breakouts.
Confirming breakouts with trading volume
Rising volume is one of the most important indicators of whether a breakout is genuinely strong. When price breaks a key level, a simultaneous increase in volume suggests buyers or sellers are stepping in with real conviction.
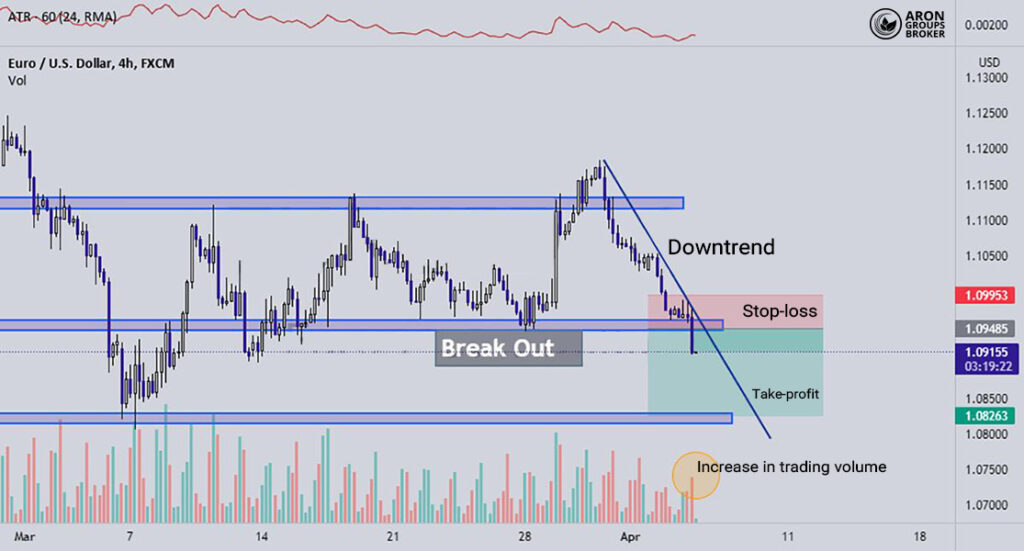
This four-hour EUR/USD chart shows a valid bearish breakout, where a strong candle breaks support and starts a downtrend. At the same time, a clear rise in trading volume (marked by the orange circle) confirms the breakout’s credibility.
Fast breakout entry or waiting for confirmation?
In breakout trading, a key decision is whether to enter immediately after the break or wait for confirmation. That choice depends on your trading style, experience, and how much risk you are willing to accept.
In general, there are two main entry approaches:
Fast entry
Fast entry is usually preferred by aggressive traders who want to capture the market’s first impulse move. They enter as soon as price clears a key level, aiming to maximise early momentum in the breakout.
This can work well in fast markets or when major news hits, but it carries meaningfully higher risk. Many breakouts turn into fakeouts, and price can snap back quickly, stopping traders out. In this style, placing a precise stop-loss is harder because the entry is often further from the breakout level.
Confirmed entry
By contrast, entering after confirmation is a more cautious approach that reduces the chance of a failed trade. Confirmations also allow a tighter, more logical stop-loss, which improves overall risk control.
However, confirmation may never appear, or you may miss part of the initial move. For that reason, this approach suits conservative traders and anyone focused on stricter risk management.
Key insight:
Professional traders sometimes combine both approaches, entering small on the break and adding after confirmation.
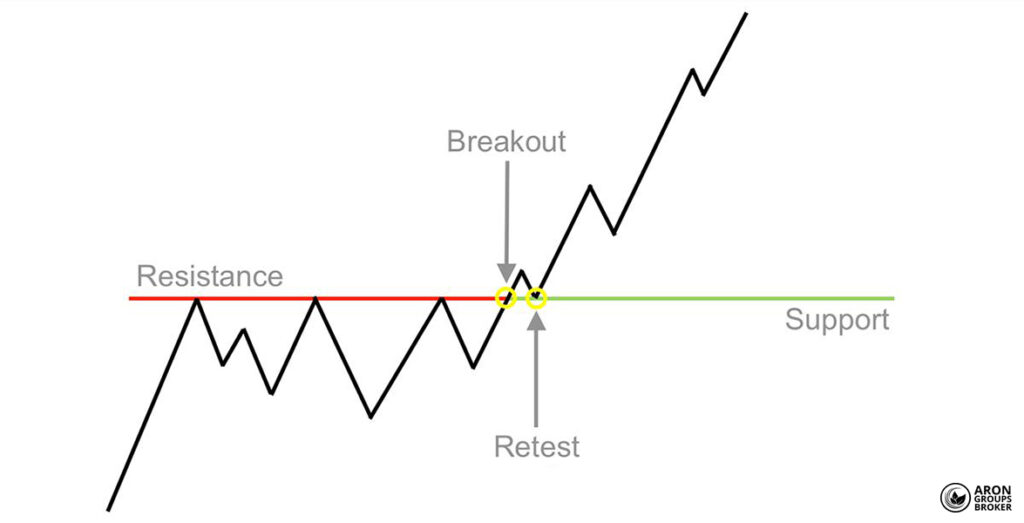
Using a breakout retest for a safer entry
In many cases, price returns to the broken level after a breakout, which traders call a retest. If that level flips into new support or resistance, it can create a lower-risk, confirmed entry opportunity.
For example:
On the Bitcoin chart, after breaking the $30,000 resistance, the price returned to that level and then rallied strongly after the pullback. This move shows strong buyer control and confirms the broken level as new support.
Entering on the retest, after a reversal candle and confirmation from volume or the RSI indicator, is a reliable breakout strategy.
Common mistakes traders make when identifying pullbacks and breakouts
Misunderstanding breakouts and pullbacks can lead to poor entries and unnecessary losses. Many traders make these errors due to haste, excitement, or the lack of a clear, tested strategy.
Below are three common and important mistakes.
Trusting the first level break without checking volume
Many traders see a support or resistance level break and assume a breakout has occurred, then enter immediately. Without volume confirmation, that break may be a fakeout rather than a genuine shift in order flow.
Entering fake pullbacks without a confirmation filter
A common mistake is entering simply because the price returns to a broken level, without any technical confirmation. This can trap you in fake pullbacks that fail to follow through and quickly reverse.
To validate a pullback, use reversal candlestick patterns, volume-based signals, and moving averages as confirmation filters. Only enter when you see real evidence that the price is actually turning, not just wobbling around a level.
Ignoring the broader trend structure and adopting the wrong bias
Another common error is ignoring the market’s overall trend structure and trading purely on short-term signals. If you trade against the dominant direction, failure odds rise sharply, even when the initial setup looks convincing.
Conclusion
Breakouts and pullbacks are not opposites; they are partners within the same powerful market move. The breakout sparks the initial shift, and the pullback helps confirm that the move is genuine.
- If you trade aggressively and can handle higher risk, fast breakout entries, confirmed by volume, may suit you.
- If you trade conservatively and prioritise capital protection, waiting for a pullback plus confirmation is usually the better route.
In the end, the right strategy depends on your personality, risk tolerance, and your trading plan. With practice and experience, you can learn which approach fits your style and use both to pursue steadier market profits.