Experienced traders know that trend strength is just as important as direction. A strong trend can offer high-probability trading opportunities, while a weak trend often leads to false signals and sudden reversals.
Among trend strength indicators, many professionals consider ADX to be the best trend strength indicator, especially in Forex markets.
In this guide, we will explore how the best forex trend strength indicator works and how traders can apply it effectively on platforms like TradingView.

- ADX is widely considered the best trend strength indicator because it directly measures how strong a trend is.
- ADX above 25 usually signals strong trending conditions, while readings below 20 often indicate a choppy or range-bound market.
- Combining ADX with price action, RSI, or MACD helps confirm momentum and improve trade reliability.
- ADX should not be used alone, since it measures trend strength but does not indicate market direction.
Understanding Trend Strength Indicators
Trend strength indicators help traders measure how powerful a market trend is, rather than simply identifying its direction.
These indicators evaluate the intensity of buying and selling pressure behind price movements. When momentum is strong, trends tend to continue. When momentum weakens, markets often enter a consolidation or choppy phase.
Differentiating Trend Strength from Trend Direction
Many beginner traders confuse trend direction with trend strength, but these are two distinct concepts in technical analysis.
- Trend direction shows whether the price is moving upward, downward, or sideways.
- Trend strength measures how powerful and sustainable the movement is.
A market can move upward while still having weak trend strength. In this case, the price may rise slowly with frequent pullbacks. Such conditions often lead to false breakouts or sudden reversals.
Q: Can a market trend upward while still being weak?
A: Yes. If buyers are not entering aggressively, the trend may lack the strength needed to continue.
Evaluating Market Momentum in Trend Analysis
Trend strength indicators are closely linked to market momentum, which reflects how quickly and aggressively the price is moving. Momentum helps traders determine whether a trend is accelerating, slowing down, or losing energy.
In strong trending environments:
- Price moves consistently in one direction
- Pullbacks remain shallow
- Momentum indicators continue rising
In contrast, weak momentum often signals that the market may soon enter a range-bound or choppy market.

Pro tip:
Strong momentum increases the probability that the trend will continue rather than reverse.
Applying Trend Strength Indicators in Trading
Trend strength indicators serve as filters, helping traders avoid low-probability setups and focus on markets with clear momentum.
Professional traders rarely rely on a single indicator. Instead, they combine trend strength indicators, price action analysis, and support and resistance levels to make more informed trading decisions.
Improving Price Action Analysis with Trend Strength Indicators
Price action analysis focuses on how prices move on the chart, including candlestick patterns, support and resistance levels, and breakout structures. However, price action alone can sometimes produce ambiguous signals, especially in volatile markets.
Trend strength indicators help traders validate price-action signals before entering trades.
Pro tip:
If the breakout is supported by an increasing trend, the probability of continuation increases.
Practical ways traders combine trend strength with price action include:
- Confirming trend continuation after pullbacks
- Validating breakout signals
- Avoiding trades during weak market momentum
- Identifying trend exhaustion
Identifying Choppy Markets and Filtering False Breakouts
One of the most valuable uses of trend strength indicators is detecting choppy markets. A choppy market occurs when prices move sideways with frequent reversals and no clear trend.
These conditions often produce false breakouts, where price briefly breaks a level before quickly reversing.
By filtering trades using trend strength indicators, traders can avoid many low-quality setups and focus on markets where trend momentum is clearly developing.
Comparing the Best Trend Strength Indicators
While many tools can identify market direction, fewer indicators are designed to measure the quality and strength of that movement. Among the most widely used are the Average Directional Index (ADX), Moving Average Convergence Divergence (MACD), and the Relative Strength Index (RSI).
Each indicator evaluates the market from a slightly different perspective. Some focus on trend intensity, while others analyse momentum and price acceleration.
Understanding the strengths of each indicator allows traders to choose the right tool for different market environments.
Measuring Trend Strength with the Average Directional Index (ADX)
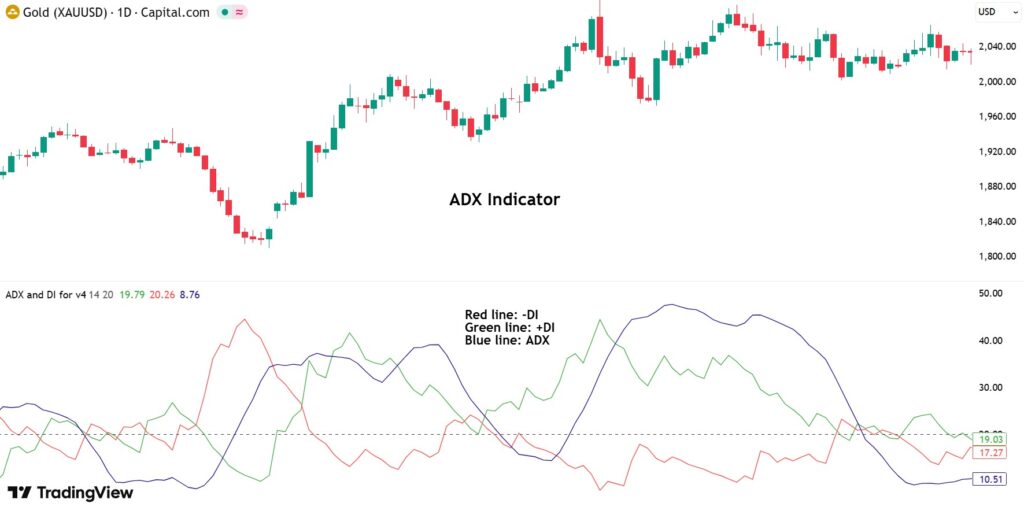
The Average Directional Index (ADX) is one of the most widely used tools for evaluating trend strength in technical analysis. According to Thinkmarkets, ADX focuses specifically on the strength of a trend, regardless of whether the market is moving up or down.
The ADX line is derived from the smoothed average of the difference between positive and negative directional indicators(土DI), producing a value between 0 and 100.
The ADX value reveals whether the trend is strong or weak, regardless of direction.
Key insight:
Because ADX focuses solely on trend intensity, many traders consider it the best forex trend strength indicator, especially for trend-following strategies and breakout trading.
Assessing Momentum Using Moving Average Convergence Divergence (MACD)
The Moving Average Convergence Divergence (MACD) indicator measures momentum and trend development by analysing the relationship between two exponential moving averages (EMAs).
The difference between the two EMAs forms the MACD line, which shows how quickly price momentum is changing.
Trend strength is evaluated through several MACD signals:
- Distance between EMAs
When the fast EMA moves far above the slow EMA, momentum increases, and the trend strengthens. - MACD histogram expansion
A growing histogram indicates increasing buying or selling pressure. - MACD crossovers
When the MACD line crosses above (below) the signal line, bullish (bearish) momentum may strengthen.
Key insight:
While MACD does not measure trend strength as directly as ADX, it is highly effective at identifying momentum acceleration, which frequently accompanies powerful market trends.
Confirming Trend Strength with the Relative Strength Index (RSI)
The Relative Strength Index (RSI) is a momentum indicator developed by J. Welles Wilder that measures the speed and magnitude of recent price changes. It is plotted on a scale from 0 to 100 and is commonly calculated using a 14-period timeframe.
While RSI is often used to identify overbought (above 70) and oversold (below 30) conditions, traders also use it to evaluate trend strength by observing how the indicator behaves during trending markets:
- In strong uptrends: RSI typically moves between 40 and 90, with the 40–50 area acting as support. This indicates that buying pressure remains strong even during pullbacks.
- In strong downtrends: RSI usually fluctuates between 10 and 60, where the 50–60 range acts as resistance, reflecting persistent selling pressure.
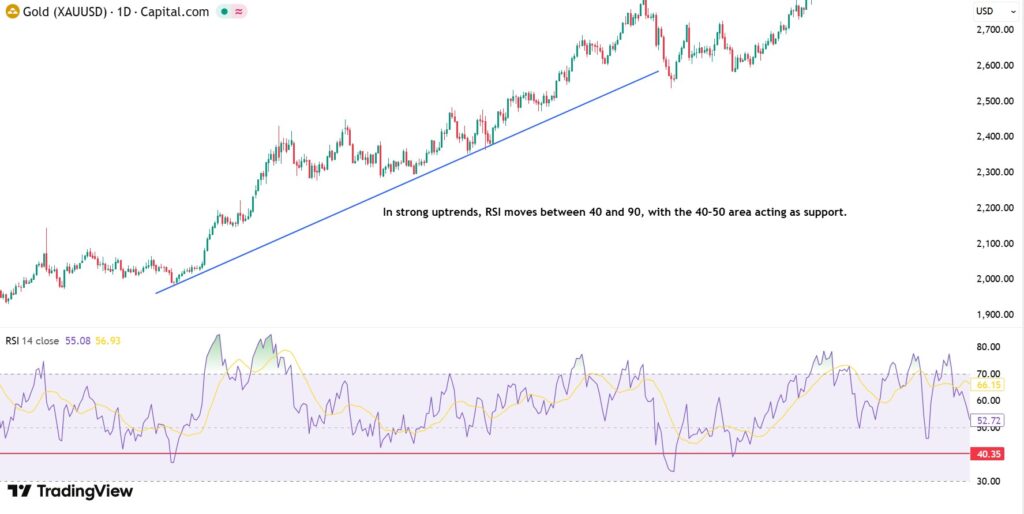
According to Schwab, traders also watch for divergences, which occur when prices move in one direction while the RSI moves in the opposite direction. This can indicate that momentum is weakening, potentially signalling a slowdown in the current trend.
Table: Comparison of the Best Trend Strength Indicators
| Indicator | Primary Function | How It Evaluates Trend Strength | Key Advantage | Typical Use Case |
|---|---|---|---|---|
| ADX | Measures trend intensity | Calculates the difference between directional price movements using DMI | Direct measurement of trend strength | Identifying strong trending markets |
| MACD | Measures momentum and trend development | Compares two exponential moving averages and evaluates histogram expansion | Detects momentum acceleration | Confirming trend development and breakouts |
| RSI | Measures price momentum and buying/selling pressure | Evaluates the speed and magnitude of price changes | Shows momentum persistence and exhaustion | Confirming trend continuation or potential reversal |
Understanding How ADX Works
Unlike many technical indicators, ADX does not attempt to predict whether the market will move up or down. Instead, it focuses on quantifying the trend’s intensity.
Explaining the Directional Movement Index (DMI) Components
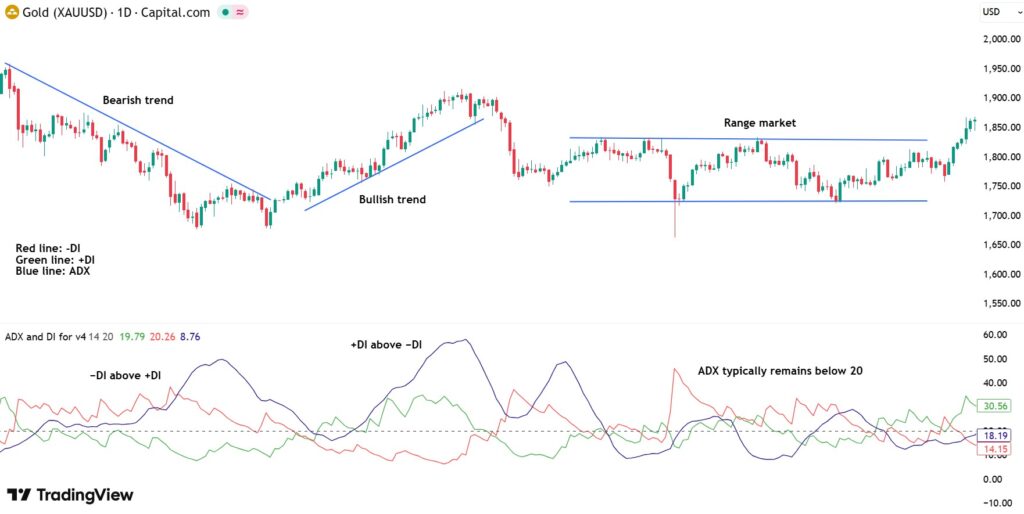
The Directional Movement Index (DMI) is the underlying structure that allows ADX to measure trend strength.
According to Investopedia, this system consists of three main lines, each representing a different aspect of market behaviour:
- +DI (Positive Directional Indicator): Measures upward price pressure.
- −DI (Negative Directional Indicator): Measures downward price pressure.
- ADX line: Measures the overall strength of the trend.
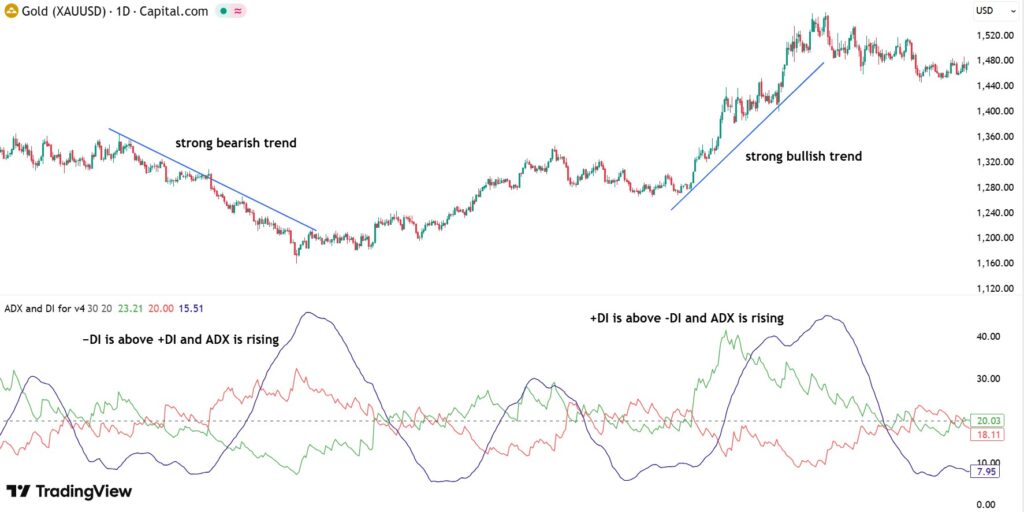
When +DI rises above −DI, it suggests bullish pressure, while −DI above +DI indicates bearish pressure.
A rising ADX confirms that the trend is gaining strength.
Interpreting ADX Values to Measure Trend Strength
Because the indicator ranges from 0 to 100, traders use specific thresholds to interpret trend conditions. Common ADX interpretations include:
- 0–20: Weak trend or sideways market
- 20–25: Trend may be forming
- 25–40: Strong trend
- Above 40: Very strong trend momentum
For example, suppose EUR/USD breaks above the 1.1000 resistance level. If ADX rises from 18 to 30, it suggests that the breakout is supported by increasing market momentum, making the trend more reliable.
Evaluating Market Conditions with ADX
Financial markets frequently alternate between strong directional trends and range-bound consolidation phases. Using ADX allows traders to adapt their strategies to these changing environments.
Identifying Strong Trending Markets
ADX is particularly useful for detecting strong trending markets, where price moves consistently in one direction with increasing momentum.
When ADX rises above 25, it signals that the market is gaining trend strength.
Traders may also observe the relationship between +DI and −DI:
- +DI above −DI → Bullish trend gaining strength
- −DI above +DI → Bearish trend strengthening
When these directional signals occur alongside a rising ADX, it often confirms that a sustained trend is developing.
Recognising Range-Bound and Choppy Markets
Many market periods are characterised by sideways movement, where the price fluctuates between support and resistance without a clear direction. These conditions are commonly referred to as range-bound or choppy markets.
In such environments, ADX typically remains below 20, signalling weak momentum and a lack of sustained directional movement.
Setting Up the Best Trend Strength Indicator on TradingView
Many traders consider ADX one of the best trend strength indicators on TradingView.
Before using ADX in a trading strategy, traders should understand how to add the indicator to their chart and adjust its parameters based on the timeframe they trade. Proper configuration helps ensure the indicator responds appropriately to market movements.
Adding and Configuring ADX on TradingView
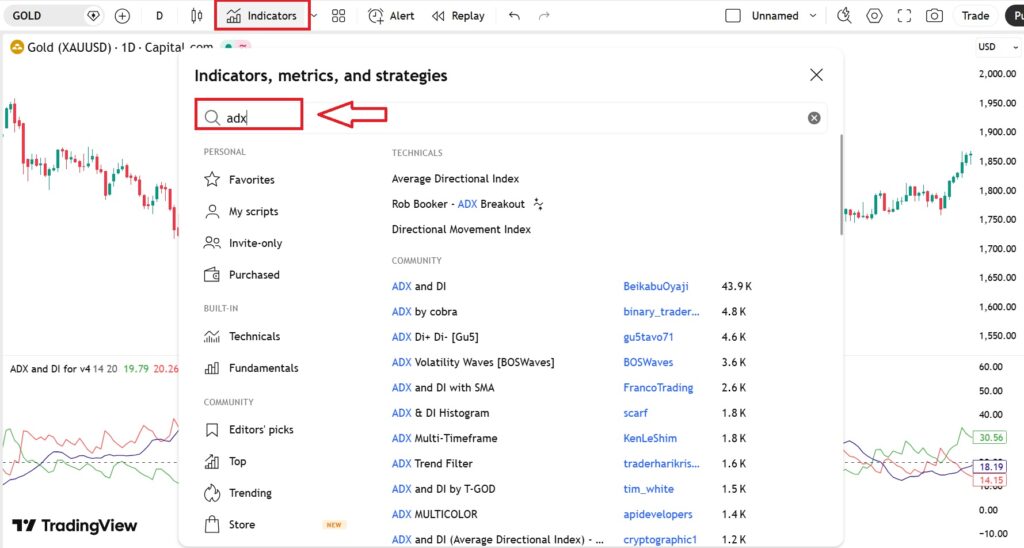
Adding ADX to a TradingView chart is straightforward. The platform includes the indicator as part of its default technical analysis tools.
Steps to add ADX on TradingView:
- Open a chart for the asset you want to analyse.
- Click the “Indicators” button at the top of the chart.
- Search for “Average Directional Index (ADX)”.
- Select the indicator from the list.
Once added, the indicator appears in a separate panel below the price chart.
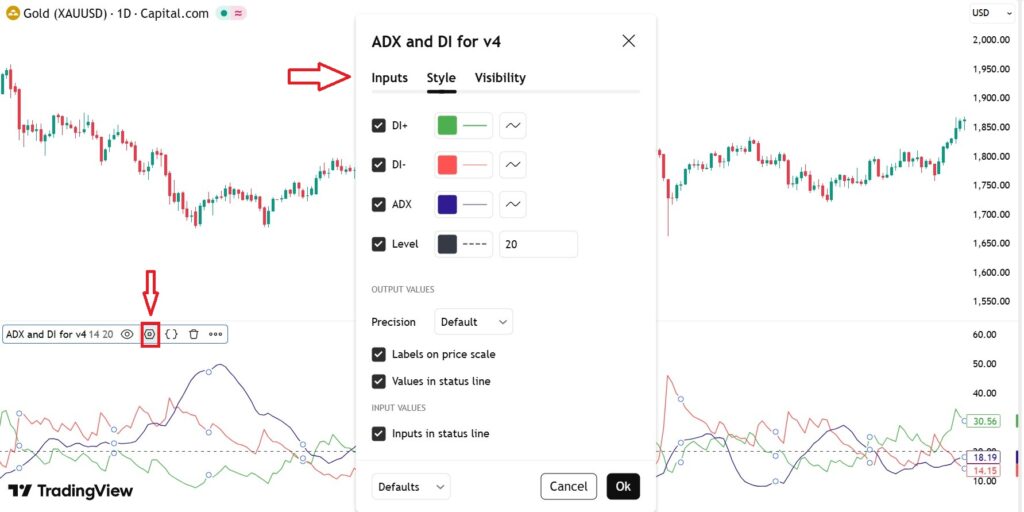
To apply your preferred changes:
- Click the gear icon to open the settings panel.
- Adjust the desired settings and click OK.
Adjusting ADX Parameters for Different Timeframes
The ADX period determines how sensitive the indicator is to price movements.
Shorter periods (7–10)
- More sensitive to recent price changes
- Reacts faster to emerging trends
- Suitable for scalping and intraday trading
Example:
A day trader using the 5-minute chart may reduce the ADX period to 10 to detect momentum shifts earlier.
Standard period (14)
- Balanced sensitivity and smoothing
- Works well for swing trading and medium-term analysis
Longer periods (20–30)
- Produces smoother signals
- Reduces noise from short-term price fluctuations
- Often used for long-term trend analysis
Example:
A trader analysing gold on the daily chart may use ADX(20) to identify sustained trends while filtering short-term volatility.
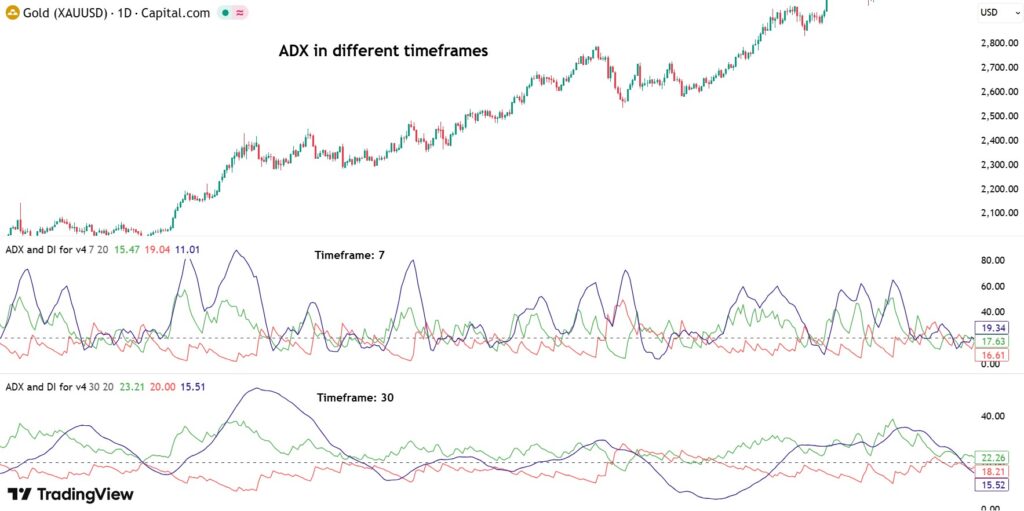
Table: Adjusting ADX Parameters for Different Timeframes
| Trading Style / Timeframe | Suggested ADX Period | Indicator Behaviour | Typical Use Case |
|---|---|---|---|
| Scalping (1–5 minute charts) | 7–10 | Very sensitive to price changes; detects trends quickly but may produce more noise | Short-term momentum trades and quick intraday setups |
| Day Trading (5–30 minute charts) | 10–14 | Balanced responsiveness; captures emerging trends without excessive signals | Intraday trend-following and breakout strategies |
| Swing Trading (1H–4H charts) | 14 | Standard setting; smooth signals with reliable trend strength measurement | Identifying medium-term trends and pullback entries |
| Position Trading (Daily charts) | 20–25 | Smoother indicator that filters short-term volatility | Tracking sustained market trends over several days or weeks |
| Long-Term Analysis (Weekly charts) | 25–30 | Very smooth signals; focuses only on major trends | Evaluating long-term market cycles and macro trends |
Integrating ADX into a Trading System
The Average Directional Index (ADX) becomes far more powerful when it is integrated into a complete trading system. In this framework, ADX acts as a market filter. It helps traders decide whether the market environment supports trend-following strategies or range trading.
Filtering Trades with ADX in Trend-Following Strategies
One of the most common uses of ADX is filtering trades in trend-following strategies. Trend-following systems aim to capture sustained price movements, but they perform poorly in sideways or choppy markets. ADX helps traders avoid these weak market conditions.
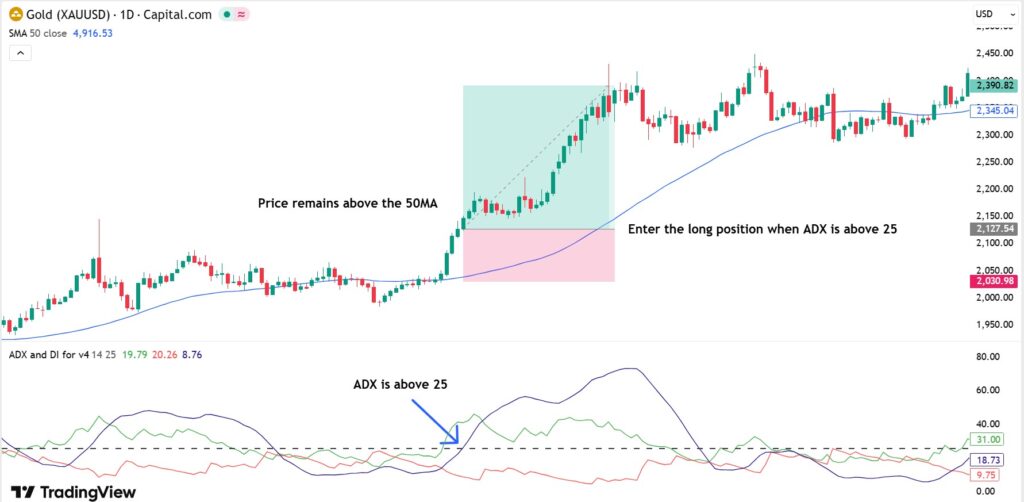
A simple trend-following filter might work like this:
Step 1 – Identify the trend
- Use a moving average, trendline, or market structure.
- Example: Price remains above the 50-period moving average.
Step 2 – Confirm trend strength
- Check whether ADX is above 25.
- Rising ADX suggests the trend is gaining momentum.
Step 3 – Look for entry signals
- Pullbacks to support
- Bullish candlestick patterns
- Continuation setups
Confirming Breakouts Using ADX with Price Action, RSI, or MACD
Breakouts occur when the price moves beyond support or resistance levels, but not all breakouts lead to strong trends. Many result in false breakouts. The increase in ADX suggests the breakout may have real momentum.
Traders often combine ADX with other indicators to strengthen confirmation.
ADX + Price Action
- Breakout candle closes beyond support/ resistance levels
- ADX rises above 25
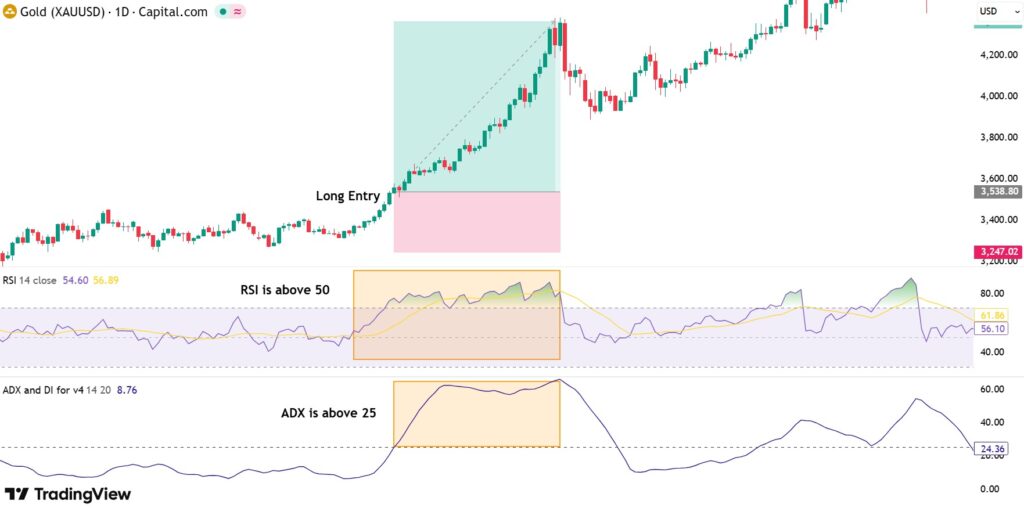
ADX + RSI
- RSI moves above 55–60
- ADX confirms increasing trend strength
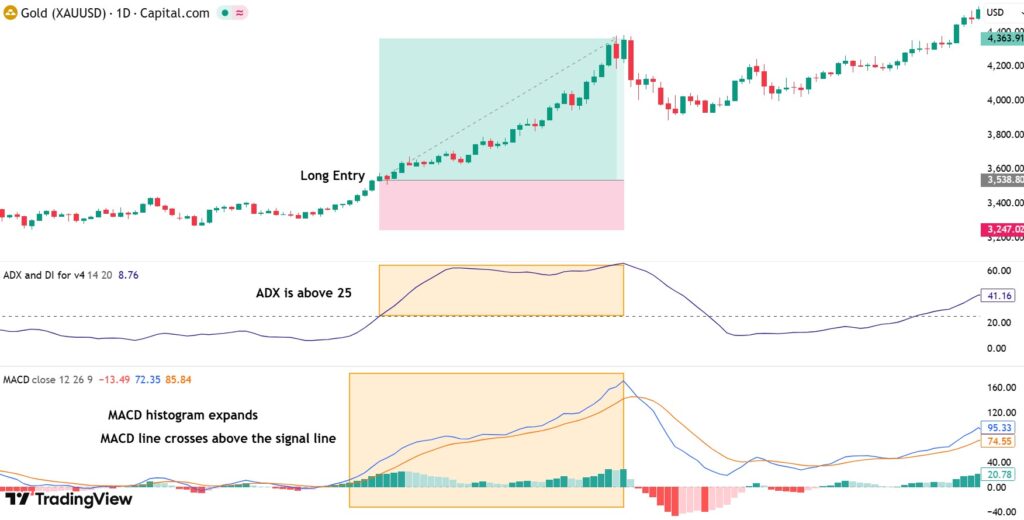
ADX + MACD
- MACD histogram expands
- ADX begins rising
Highlighting ADX Limitations
Although ADX is widely regarded as one of the best trend strength indicators, it is not a perfect tool. Like all technical indicators, ADX has certain limitations that traders must understand before incorporating it into a trading system.
Understanding Why ADX Does Not Indicate Market Direction
One of the most common misunderstandings among beginner traders is the belief that the ADX indicates whether the market will move up or down. In reality, ADX measures how strong the current trend is, regardless of direction.
The ADX line itself does not reveal whether buyers or sellers control the market. Instead, direction is determined by the Directional Movement Index (DMI) components:
- If +DI is above −DI and ADX is rising: the market may be in a strong bullish trend.
- If −DI is above +DI, and ADX is rising: the market may be in a strong bearish trend.
- If ADX is falling: the trend is weakening, or the market is moving sideways.
Recognising Situations Where ADX Signals Are Less Reliable
Although ADX is effective for identifying strong trends, its signals can be less reliable in certain market conditions.
- One limitation appears during the early stages of a trend. Because ADX uses smoothed historical data, it often rises above key levels, such as 20 or 25, only after the trend has already begun.
- ADX can also produce misleading signals during volatile consolidation periods. In these situations, price may fluctuate quickly within a narrow range, leading to temporary spikes in ADX even though a stable trend has not yet formed.
- ADX may also become less reliable during news-driven volatility, such as major economic announcements in Forex markets.
Conclusion
Understanding trend strength is crucial for making better trading decisions. The Average Directional Index (ADX) helps traders gauge the strength of a trend, enabling them to avoid weak markets and focus on high-probability setups.
When combined with price action, RSI, or MACD, ADX can confirm breakouts, support trend-following strategies, and improve trade timing. However, since the ADX measures trend strength rather than direction, it should always be used in conjunction with other analysis tools.