
icon icon Home
icon icon Accounts
icon icon Quick start
icon icon Symbols

The Ultimate Guide to the Best Fair Value Gap Indicator on TradingView

Author
Abe Cofnas
Abe Cofnas
calendar Last update: 26 July 2026
watch Reading time: 8 min

A fair value gap indicator finds and draws price imbalances on your TradingView chart automatically: zones created when the market moved so fast in one direction, over a strict three-candle sequence, that a slice of prices never properly traded. The best FVG indicators on TradingView are free, open-source community scripts, and the difference between a cluttered chart and a useful one is not which script you pick but how you configure its filters.

The concept matters because rapid, one-sided moves are usually the footprint of institutional orders too large to fill patiently, and markets have a documented habit of revisiting the inefficiencies those moves leave behind. Research into market microstructure shows how uneven liquidity provision shapes short-term price behaviour, and an FVG is that unevenness made visible on a chart.

This guide defines the fair value gap precisely, walks through the exact TradingView setup, explains bullish and bearish anatomy, covers the filters that separate signal from noise, introduces the strength score and multi-timeframe projection, and finishes with how to actually trade the zones without treating any indicator as a promise.

bookmark
Key Takeaways
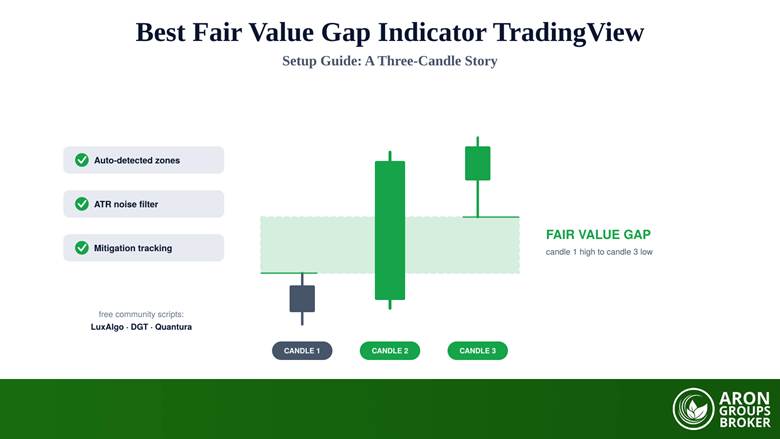
  • A fair value gap is a price imbalance formed over exactly three candles, when the outer candles' wicks fail to overlap around a fast displacement candle.
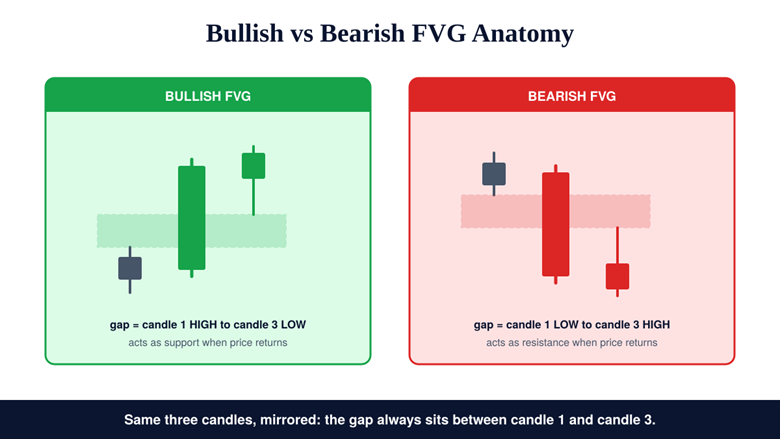
  • Bullish FVGs span candle one's high to candle three's low; bearish FVGs span candle one's low to candle three's high.
  • On TradingView, free community scripts such as LuxAlgo, DGT, and Quantura detect FVGs, track fill progress, and remove mitigated zones automatically.
  • ATR-based filters and a 0-100 strength score, combining gap size with relative volume, keep only high-probability zones on the chart.
  • Multi-timeframe mode projects 4H or daily FVGs onto a 15-minute chart, turning higher-timeframe imbalances into intraday targets.

What Is a Fair Value Gap?

A fair value gap, or FVG, is a market inefficiency created during a rapid one-sided move, defined over a strict three-candle sequence. When the middle candle is so large that the first candle’s wick and the third candle’s wick do not overlap, the untouched space between them is the gap: a band of prices where buyers and sellers never properly met. Because auctions dislike unfinished business, price frequently returns to these zones later, which is why traders treat them as magnets, targets, and reaction areas.

sms-star

Risk Disclosure

CFDs are complex instruments and come with a high risk of losing money rapidly due to leverage. You should consider whether you understand how CFDs work and whether you can afford to take the high risk of losing your money. Past performance is not indicative of future results. This content is provided for educational purposes only and does not constitute investment advice.
Why the Gaps Exist at All

Ordinary trading fills the book layer by layer. Institutional-sized orders cannot afford that patience, so they sweep through available liquidity in seconds, and the chart records the sweep as one long displacement candle flanked by two ordinary ones. The gap is the receipt. Reading such footprints is one way traders build a genuine trading edge, but a footprint is evidence of past urgency, never a guarantee of future direction.

FVGs, Liquidity, and Institutional Zones

In the smart money vocabulary, FVGs sit alongside order blocks and liquidity pools as institutional zones: places where large players acted or are assumed to have unfinished interest. The three ideas chain together naturally. A liquidity sweep supplies the fuel, the displacement candle spends it, and the FVG records where the spending outran the order book. Traders who map all three are really asking one question from three angles: where did size act, and where might it defend or revisit that action?

Bullish and Bearish FVGs: The Anatomy

The two variants are exact mirrors, and the boundaries always come from candles one and three, never from the big candle in the middle. A bullish FVG forms in an upward burst: the zone runs from candle one’s high up to candle three’s low, and when price later dips back into it, the zone tends to act as support. A bearish FVG forms in a downward burst: the zone runs from candle one’s low down to candle three’s high, and a later rally into it tends to meet resistance. If the wicks of candles one and three overlap, there is no gap and nothing to draw, which is exactly the ambiguity an automated indicator removes.

Bullish and Bearish FVGs: The Anatomy

Q: Is a fair value gap the same as support and resistance?

A: They rhyme but differ in origin. Classic support and resistance come from prices where the market repeatedly traded; an FVG marks prices where the market barely traded at all. In practice a bullish FVG behaves like dynamic support and a bearish one like dynamic resistance, which is why the two concepts combine so naturally on one chart.

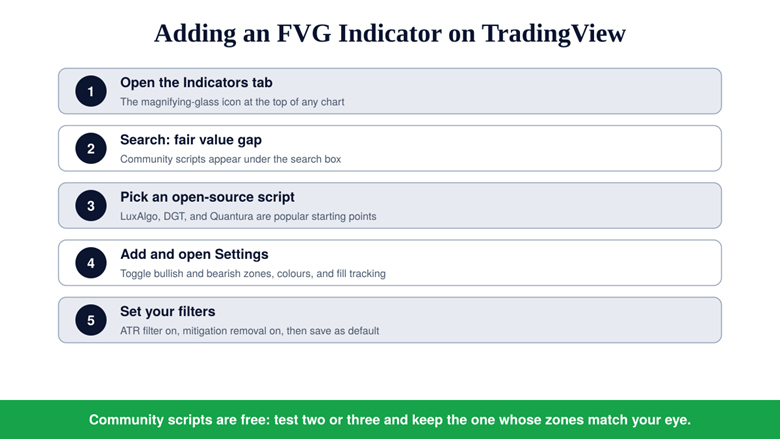
Setting Up an FVG Indicator on TradingView, Step by Step

Step 1: Open the Indicators Tab

On any TradingView chart, click the Indicators button at the top of the screen. The search dialogue that opens covers both built-in tools and the community script library.

Step 2: Search for Fair Value Gap

Type fair value gap or FVG. The Community Scripts section lists dozens of free, open-source implementations, ranked by popularity and likes.

Step 3: Choose a Well-Maintained Script

Popular open-source options include LuxAlgo’s Fair Value Gap, DGT’s implementation, and Quantura’s version. All three detect the three-candle pattern automatically; they differ mainly in filtering options and visual style.

Step 4: Add It and Open Settings

Click the script once to add it to the chart, then open its settings gear. Enable bullish and bearish zones, choose colours that match your template, and turn on fill tracking if the script offers it.

Step 5: Configure the Filters and Save

Switch on the ATR or percentage filter, enable automatic mitigation removal, and save the configuration as your default so every new chart loads it identically.

Setting Up an FVG Indicator on TradingView, Step by Step

Because every script mentioned here is open source, the Pine Script code is one click away, and small edits, colours, alert conditions, a different ATR multiple, need no programming background. Alerts deserve special mention: TradingView can notify you the moment price re-enters a chosen zone, which converts the indicator from a drawing tool into a patient scout that watches the chart so you do not have to.

sms-star

Rule: Treat indicator selection like any tool choice: test two or three scripts on the same week of data and keep the one whose zones match what your own eye and your backtests consider meaningful.

Filtering the Noise: ATR, Mitigation, and the Strength Score

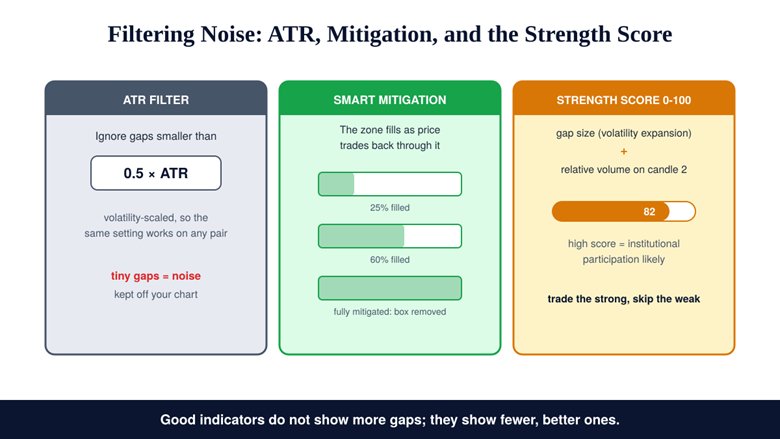
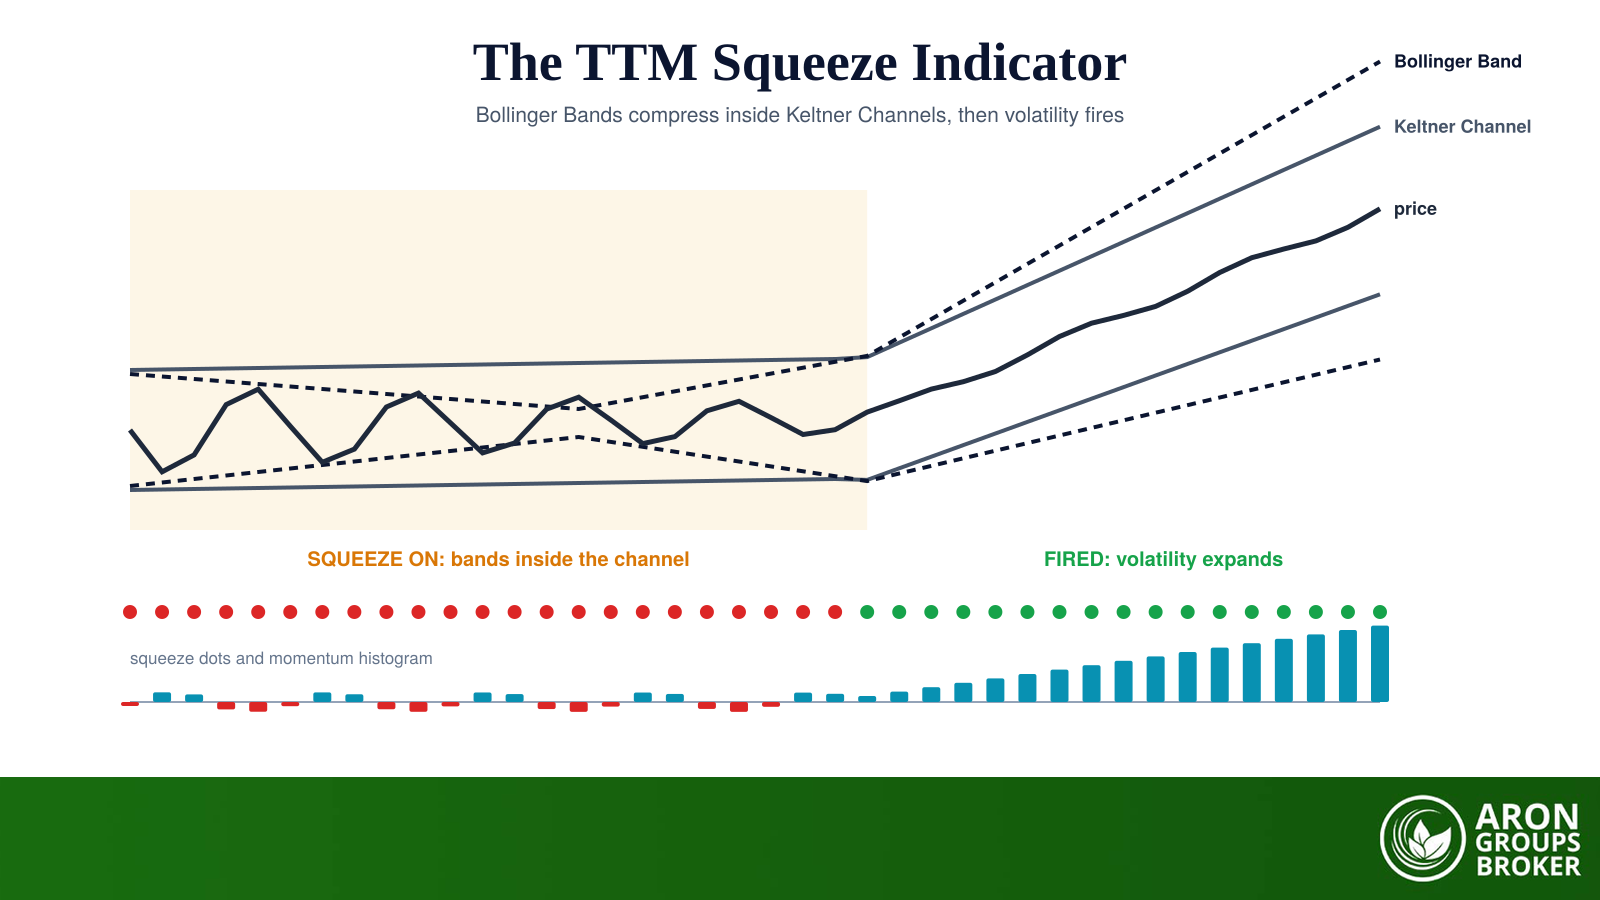
Raw FVG detection marks every three-candle imbalance, and on a five-minute chart that is dozens a day, most meaningless. Quality indicators solve this with an ATR filter: gaps smaller than a multiple of the Average True Range are ignored, which scales the threshold to each market’s volatility automatically, the same volatility logic that powers tools like Keltner Bands. A percentage-of-price filter achieves the same on assets where ATR behaves oddly.

Filtering the Noise: ATR, Mitigation, and the Strength Score

Smart fill tracking is the second essential feature. As price trades back into a zone, the indicator shades the filled portion, and once the gap is fully mitigated the box is removed from the chart entirely. This keeps charts clean and, more importantly, stops you trading zones that have already done their work.

The most advanced scripts add a strength score from 0 to 100, combining the size of the gap, read as volatility expansion, with the relative volume on the displacement candle. A large gap on heavy volume scores high and suggests genuine institutional participation; a wide but thin gap scores low. Scoring converts a wall of boxes into a shortlist.

Mini Example: Two Gaps, One Worth Trading (text-only scenario)

On a gold 15-minute chart, the London open prints a bullish FVG spanning $4 with volume three times the 20-bar average: strength score 84. An hour later, a drifting market prints a $0.60 gap on below-average volume: score 22.

The first zone is a candidate: displacement with participation. The second is noise that an ATR filter would never have drawn. Trading only high-scored zones cuts signals dramatically and improves the quality of every remaining decision.

Multi-Timeframe FVGs: Higher-Timeframe Zones on Lower-Timeframe Charts

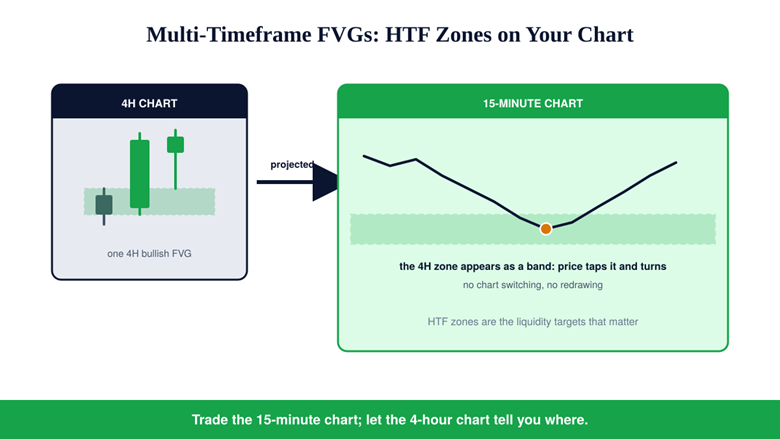
The strongest use of an FVG indicator is multi-timeframe projection. A gap on the 4-hour or daily chart represents a serious institutional imbalance, and MTF-capable scripts draw those higher- timeframe zones directly onto your 15-minute execution chart, without switching charts or redrawing by hand. Higher-timeframe gaps function as the major liquidity targets that intraday moves gravitate toward, so the projection turns your execution chart into a map: trade the small chart, aim at the big chart’s zones. A practical pairing: allow the 4H and daily zones to define your directional bias and profit targets, and let fresh 15-minute gaps in the same direction time the entries. When both timeframes agree, the trade has structure behind it; when they conflict, standing aside is a position. It is the same discipline of testing ideas across regimes that makes out-of-sample backtesting meaningful, applied to structure instead of statistics.

Multi-Timeframe FVGs: Higher-Timeframe Zones on Lower-Timeframe Charts

How to Actually Trade the Zones

The indicator finds the zones; a strategy decides what to do there, and the honest version is unexciting. Use bullish FVGs as dynamic support for long entries and bearish FVGs as dynamic resistance for shorts, and filter every setup by trend, a simple moving average is enough, so you buy gaps only in uptrends and sell them only in downtrends. Place the stop beyond the far edge of the zone, demand a defined risk-to-reward ratio before entry, and size the position by fixed rules rather than conviction.

An FVG marks where a reaction is likelier than usual, nothing more. European regulators’ finding that the large majority of retail accounts lose money on leveraged products is a reminder that zone-drawing tools do not change the arithmetic of risk, and US investor-education guidance on leveraged strategies makes the same point in plainer words: magnified exposure magnifies both outcomes, whatever indicator drew the entry.

Q: Should beginners trade every FVG the indicator draws?

A: No. Beginners do best trading only high-strength zones that agree with the trend on a higher timeframe, one setup type, repeated. Leverage magnifies both outcomes, so the discipline of skipping most zones matters more than the cleverness of any single entry.

Where Aron Groups Fits

TradingView is the analysis layer; execution needs a broker platform, and the workflow pairs naturally with MetaTrader 5 at Aron Groups: mark your FVG zones on TradingView, then execute with hard stops and alerts on MT5, where a risk-to-reward indicator can enforce the same discipline the strategy demands.

If the concept is new to you, rehearse it with effective risk management on a small account first, and treat the mechanics in our guide on how to trade forex as the foundation the indicator sits on.

Conclusion

The best fair value gap indicator on TradingView is less a single script than a configuration: an open-source detector, an ATR filter that deletes noise, mitigation tracking that cleans up after price, a strength score that ranks what remains, and multi-timeframe projection that keeps the higher-timeframe map on your execution chart. LuxAlgo, DGT, and Quantura all reach that standard; pick by feel and keep your settings constant.

Then remember what the tool is. An FVG indicator observes where the market moved too fast to be fair; it does not predict, promise, or size positions. Combined with trend alignment, defined risk, and the patient process of a professional trader, it is a genuine edge-finder. Used as a signal machine, it is just a prettier way to overtrade.

Frequently Asked Questions

What is the best fair value gap indicator on TradingView?

The most popular free options are the open-source community scripts by LuxAlgo, DGT, and Quantura. All three detect the three-candle pattern automatically; the best one for you is the one whose filtering, mitigation tracking, and visuals fit your workflow after a side-by-side test.

How is a fair value gap calculated?

Over three candles: a bullish FVG is the space between candle one’s high and candle three’s low when they do not overlap around a strong up candle; a bearish FVG is the space between candle one’s low and candle three’s high around a strong down candle.

Do fair value gaps always get filled?

No. Many are revisited because auctions tend to repair inefficiencies, but there is no rule that obliges price to return, and strong trends can leave gaps unfilled for a long time. Treat a gap as a zone of elevated reaction probability, never as a guarantee.

Can I use FVG indicators on MetaTrader 5?

Yes. Equivalent FVG tools exist for MT5, and a common workflow is analysing on TradingView while executing on MT5 with alerts and hard stops. The pattern is platform-independent because it is pure price geometry.

Continue Reading
not-found
calendar 26 July 2026
Rate this article

Leave a Reply

Your email address will not be published. Required fields are marked *

No thanks