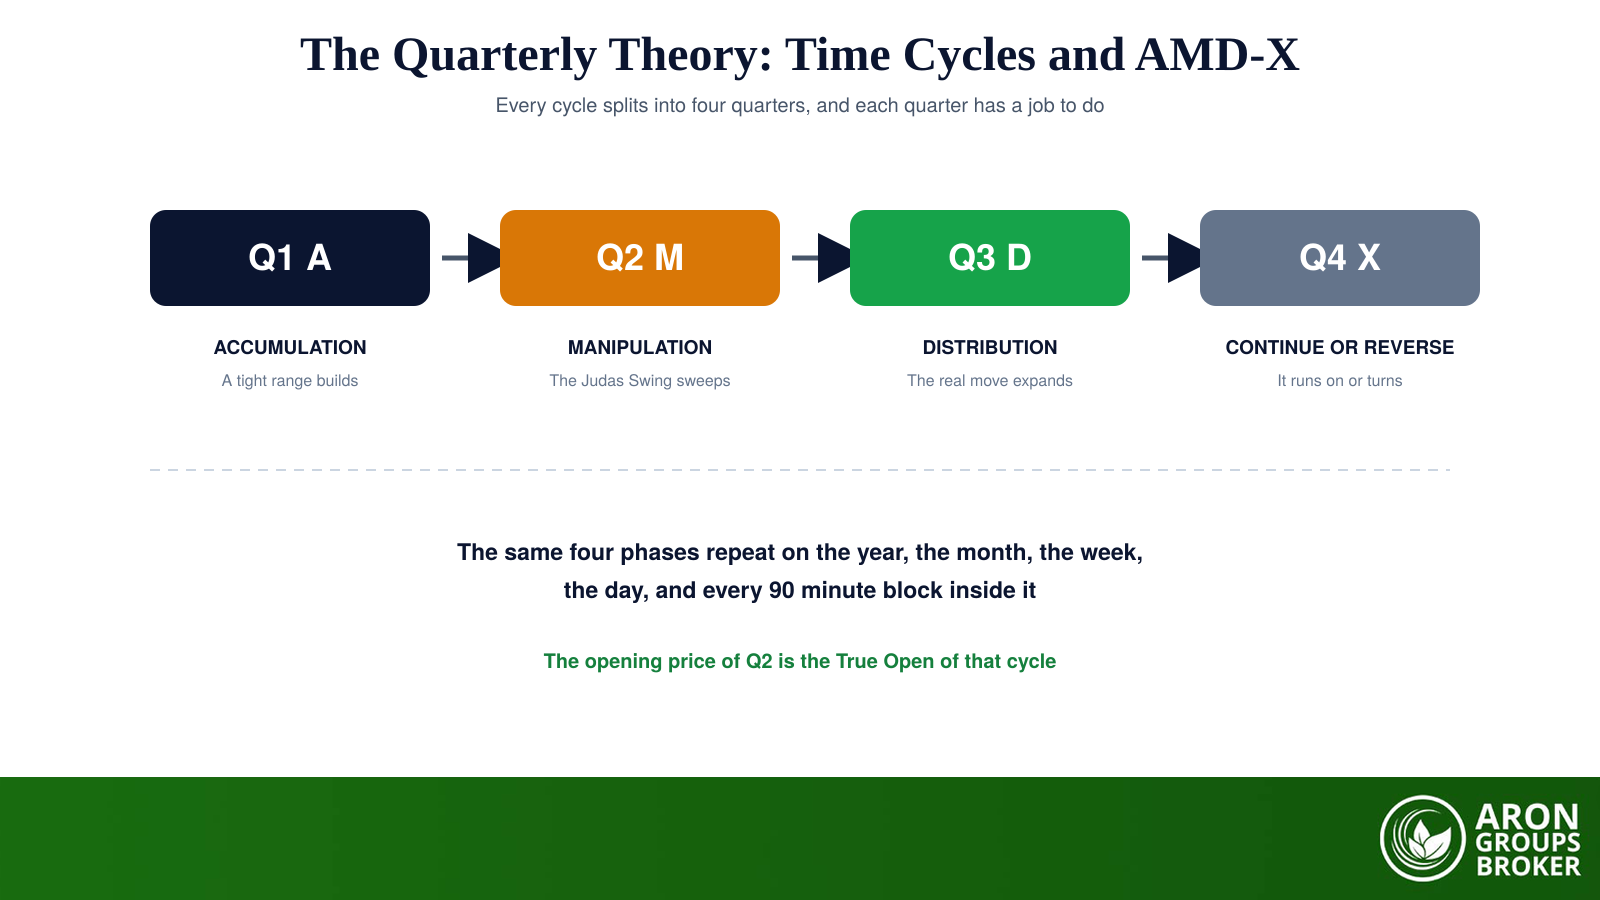

The Quarterly Theory is a time-based trading framework that divides every cycle into four quarters and expects each cycle to run through the same four phases: accumulation, manipulation, distribution, then continuation or reversal. Traders shorten that sequence to AMD-X. The claim is not that price must obey a clock, but that market delivery is organised in repeating time blocks, and that knowing which block you are in tells you what to expect next.
The framework was assembled by Jevaunie Daye, known as Traderdaye, who published it in 2023 after studying the time-based material of Michael Huddleston, the Inner Circle Trader. It takes familiar ICT ideas, killzones, the midnight open and the Judas Swing, and arranges them into one recursive schedule that runs from the year down to the 90 minute block. For anyone already trading forex on session timing, it is a way to make that timing explicit.
This guide covers the four phases, the fractal time divisions with exact New York session hours, the True Opens that anchor each cycle, how higher and lower cycles are meant to be combined, and an honest account of what the framework can and cannot do.
- Quarterly Theory splits every timeframe into four quarters running accumulation, manipulation, distribution and continuation or reversal.
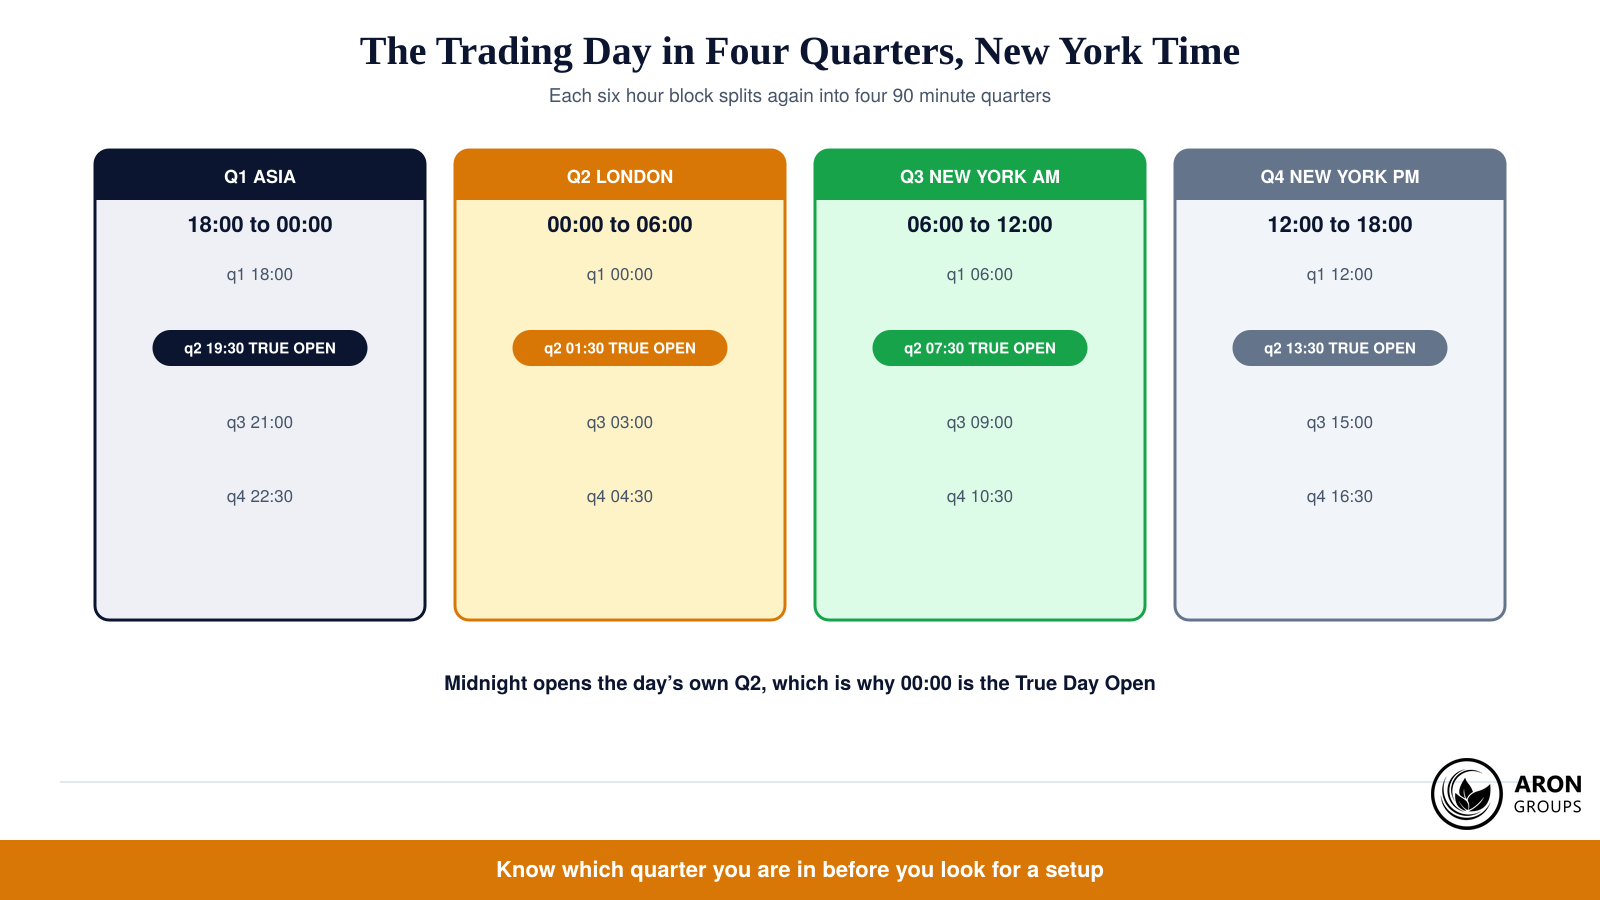
- The opening price of Q2 is the True Open: midnight New York time for the day, 01:30 for London, 07:30 for New York and 13:30 for the afternoon.
- The trading day divides into four six hour blocks, and each block divides again into four 90 minute quarters.
- The intended workflow is to let a higher cycle set direction and a lower cycle time the entry, usually after Q2 has swept liquidity.
- It is a community framework built on ICT concepts, developed on futures and never formally tested, so treat it as a schedule rather than a signal.
What Is the Quarterly Theory?
Quarterly Theory says that any unit of time can be split into four parts, and that those parts tend to play defined roles. A year contains four three month quarters, a month contains four weeks, a week contains four trading days, a day contains four six hour blocks, and each block contains four 90 minute quarters. The same phase template is then applied at every level, which is what makes the framework fractal rather than merely a session guide.
Explore the Top Forex Indicators.
Risk Disclosure
Trading forex and CFDs carries a high level of risk and can result in the loss of all your capital. This content is educational and is not investment advice. Never risk money you cannot afford to lose.
The appeal is organisational. Instead of watching a chart continuously and reacting, a trader using this framework knows in advance which window is likely to be noise, which is likely to trap, and which is likely to deliver the day’s expansion. That is the same instinct behind any systematic trading approach: replace improvisation with a rule about when to act.
The Four Phases: Accumulation, Manipulation, Distribution, X
The four phases are ICT’s Power of 3 with a fourth stage added for what happens after the move. The sequence always runs in the same order, although practitioners allow a cycle to begin at X when delivery front-runs the schedule. Each phase describes behaviour, not a fixed candle pattern, so recognition still depends on reading structure.
Learn more about Bitcoin Halving.
Q1: Accumulation
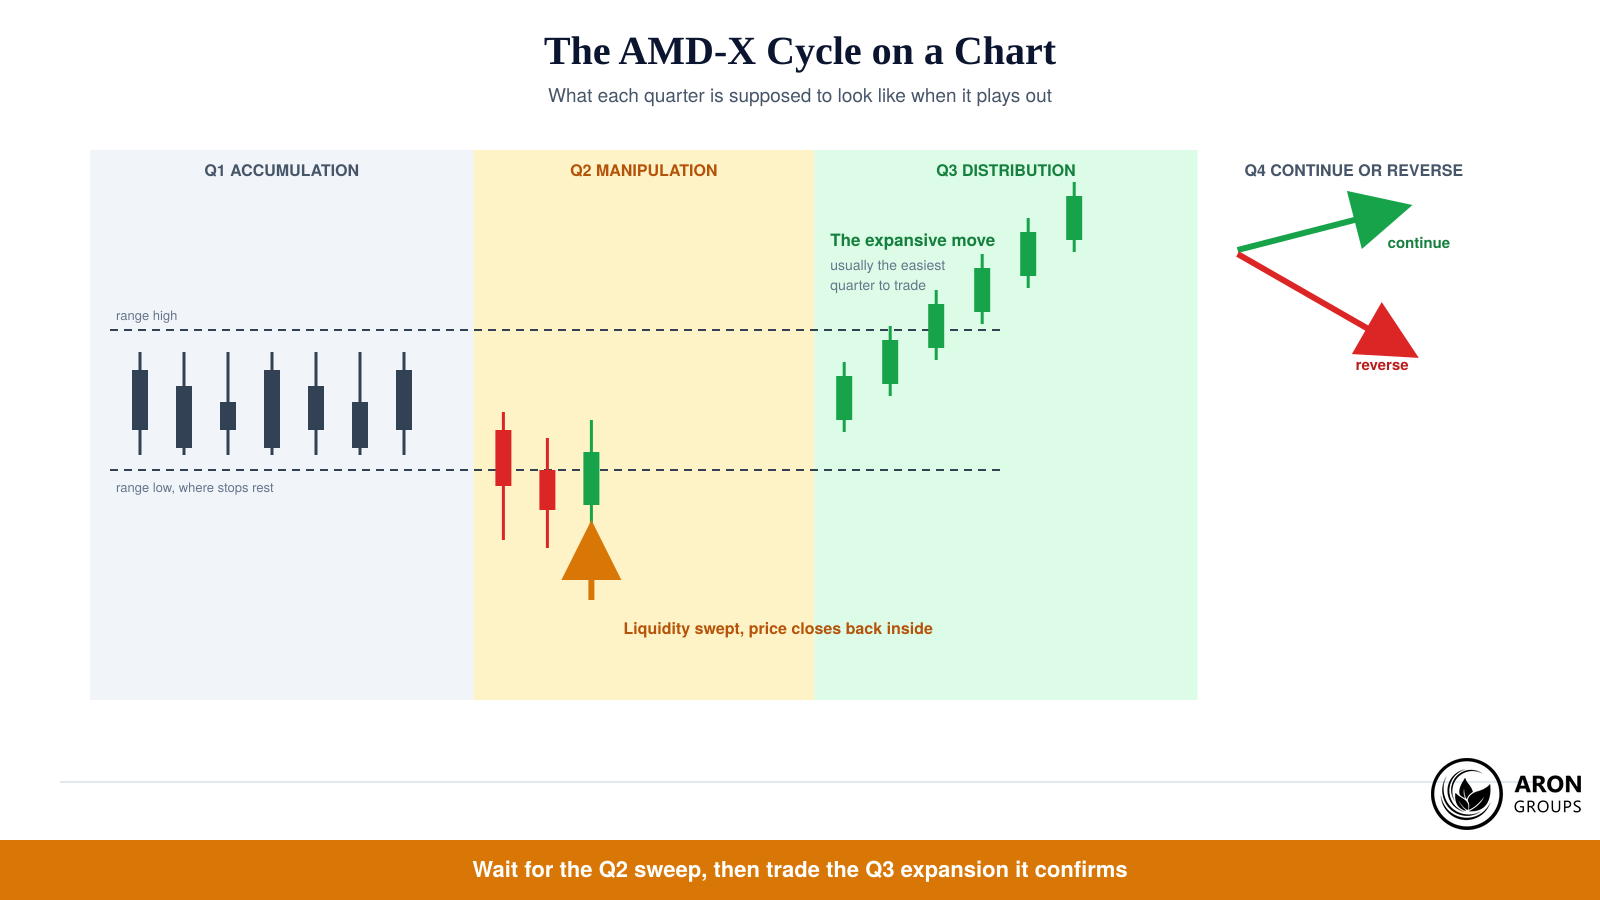
The first quarter usually builds a tight consolidation. Ranges form, volume is unremarkable, and the highs and lows created here matter mainly because they collect resting orders. Trading inside this phase is generally low reward, and its real function is to define the levels the next quarter will attack.
Q2: Manipulation, the Judas Swing
The second quarter is the false move. Price breaks out of the accumulation range, takes the stops resting beyond it, then closes back inside, which is what ICT traders call the Judas Swing. This is the phase that costs impatient traders money, because it looks exactly like a genuine breakout triggering. In this framework the sweep is not a failure to avoid but the information you were waiting for.
Q3: Distribution
The third quarter delivers the expansive move, often in the opposite direction to the Q2 sweep. Practitioners describe it as the low resistance stretch, because the liquidity that would have opposed the move has already been taken. It is generally treated as the easiest quarter to trade, and most entry models in this framework are designed to be in position before it starts.
Q4: Continuation or Reversal
The fourth quarter resolves the cycle. Either the distribution extends, which favours holding, or price turns back and retraces the move, which favours taking profit and standing aside. Because both outcomes are permitted, Q4 is the least prescriptive phase and the one most often over-interpreted after the fact.
| Quarter | Phase | Typical behaviour | What it is for |
|---|---|---|---|
| Q1 | Accumulation | A tight range with no clear direction | Defines the levels that matter |
| Q2 | Manipulation | A sweep beyond the range that reverses | Signals the likely true direction |
| Q3 | Distribution | The expansive, directional move | Where the framework expects the trade |
| Q4 | Continuation or reversal | Extension or retracement | Management, not fresh entries |
Table 1: The AMD-X phases and the job each quarter is expected to do.
The Fractal Time Divisions
The recursion is the framework’s defining feature. Every cycle is divided into four, and the same four phases are expected inside each division, which is why an intraday trader and a swing trader can use identical language on different charts. The daily divisions are quoted in New York time, which is the reference clock the framework uses throughout.
Explore Factors for Buying Cryptocurrency.
| Cycle | Q1 | Q2 | Q3 | Q4 |
|---|---|---|---|---|
| Year | January to March | April to June | July to September | October to December |
| Month | First full week | Second full week | Third full week | Fourth full week |
| Week | Monday | Tuesday | Wednesday | Thursday |
| Day | 18:00 Asia | 00:00 London | 06:00 New York AM | 12:00 New York PM |
| Session | First 90 minutes | Second 90 minutes | Third 90 minutes | Fourth 90 minutes |
Table 2: The fractal divisions, with daily and session hours in New York time.
Below the 90 minute quarter, the same logic continues into micro cycles of roughly 22 minutes and smaller still, though precision falls away quickly at that scale. Note also that community versions differ: some practitioners start the weekly count on Tuesday and treat Monday as preparation, and monthly counts have to handle weeks that straddle two months. Where sources disagree, the daily and session divisions are the ones almost everyone shares.
True Opens: The Reference Price of Each Cycle
A True Open is the opening price of Q2, not the opening price of the cycle. The reasoning is that Q1 is only preparation, so the price at which manipulation begins is the fairer reference for deciding whether the market is trading at a premium or a discount. Longs are preferred below the relevant True Open and shorts above it, which turns a single price into a filter.
| Cycle | True Open |
|---|---|
| Year | The April open |
| Month | The Monday of the second full week |
| Week | The Tuesday open |
| Day | 00:00 New York time, the true day open |
| London session | 01:30 New York time |
| New York AM session | 07:30 New York time |
| Afternoon session | 13:30 New York time |
Table 3: The True Open of each cycle, all times New York.
Rule
Every True Open is simply the start of that cycle's second quarter. Midnight opens the day's Q2, 07:30 opens the New York AM block's Q2, and the same rule generates all the rest.
How to Trade It: Nesting the Cycles
The practical method is to let a higher cycle set direction and a lower cycle time the entry. If the daily cycle is in its Q3, the New York AM block, and the higher timeframe bias is bullish, you drop to the 90 minute quarters inside that block and look for a long. The steps below are the common sequence, and none of them removes the need for a tested trading edge.
Step 1: Map the Current Quarter
Before anything else, establish which quarter of the day and which quarter of the session is running, and mark the relevant True Open. Most charting platforms have community indicators that draw the grid automatically, which removes counting errors.
Step 2: Let Q2 Do Its Work
Expect the manipulation leg and do not chase it. A sweep beyond the Q1 range that fails to hold and closes back inside is the event the framework is built around. If no sweep appears, the cycle is not behaving as expected and there is no obligation to trade it.
Step 3: Trade the Q3 Distribution
Once the sweep has resolved, take the direction it confirmed and position for the expansion, using structure, an imbalance left by the reversal, or a return to the True Open as the entry trigger. Correlated instruments diverging at the same moment, known as SMT divergence, is the usual extra confirmation.
Step 4: Define the Exit Before Q4
Set the stop beyond the swept extreme and the target at the next obvious liquidity pool, then decide in advance how Q4 will be handled. A risk-reward indicator on the chart keeps the arithmetic visible while the trade runs.
Mini Example: A New York AM Session in Sequence
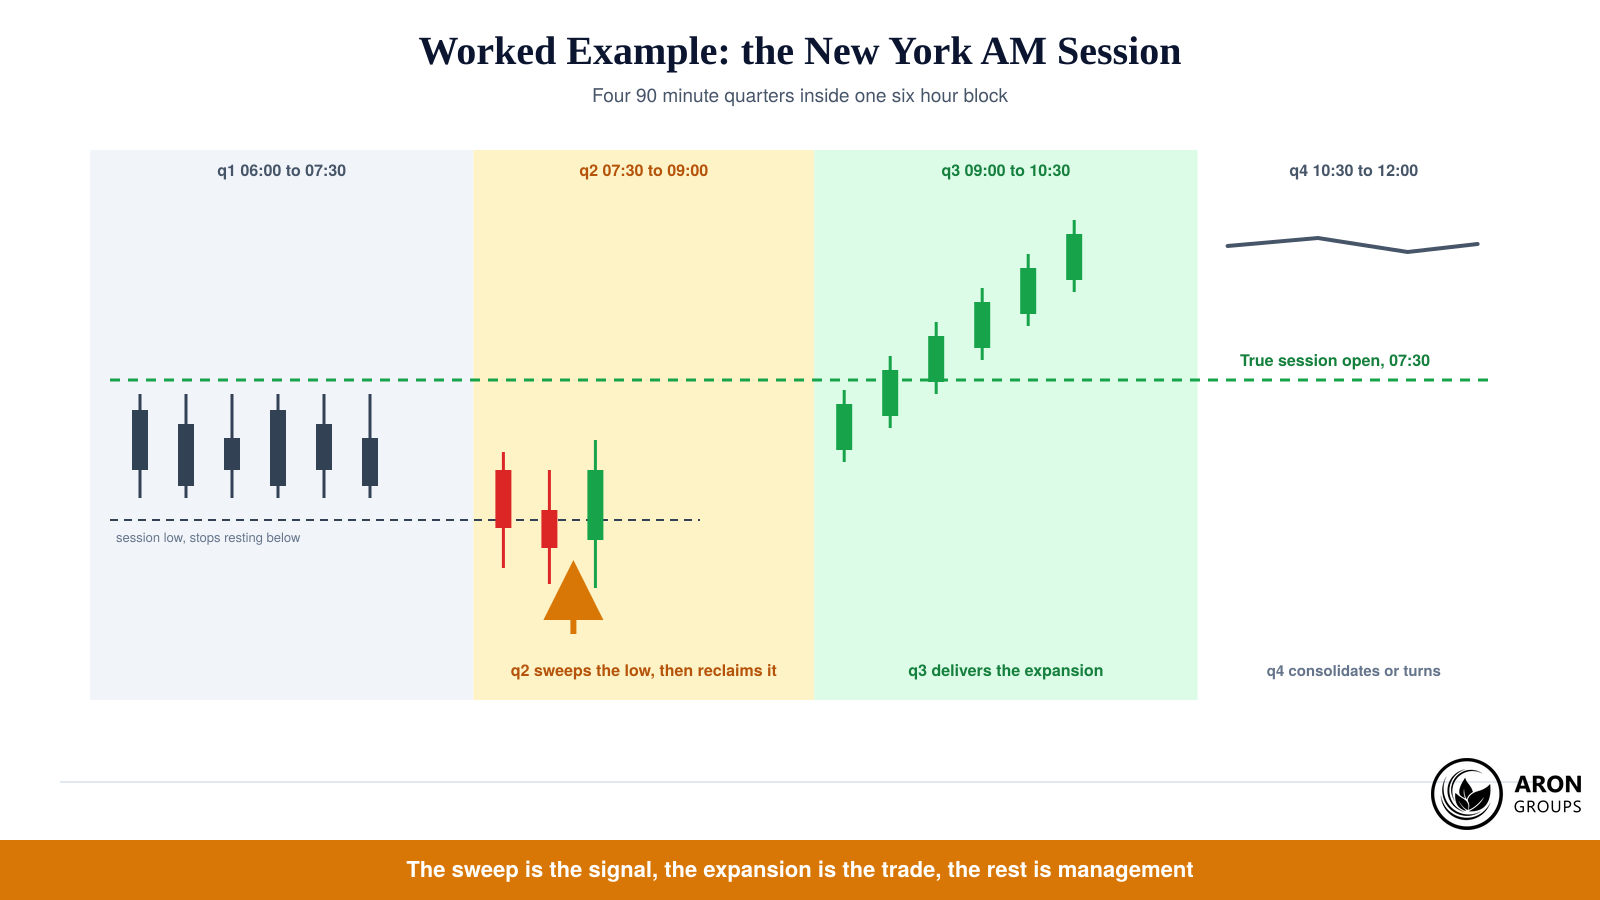
The 06:00 to 07:30 quarter builds a narrow range beneath the 07:30 True Session Open, which sets the levels for the block. Shortly after 07:30 price pushes below that range low, trips the stops sitting there, and then closes back above it inside the same 90 minute quarter.
That failed break is the manipulation leg. A trader following the framework takes the reclaim as confirmation of an upward bias, enters on the return to the broken level, places the stop beneath the sweep low, and targets the previous session high. The 09:00 to 10:30 quarter is where the framework expects that move to be delivered, and 10:30 onward is management.
What if the phases do not appear?
Then there is no trade. The most common error is forcing a label onto a chart that is simply ranging, which produces entries with no real premise. A quarter that fails to behave is information, not an invitation to reinterpret it.
Honest Limits: What the Framework Cannot Do
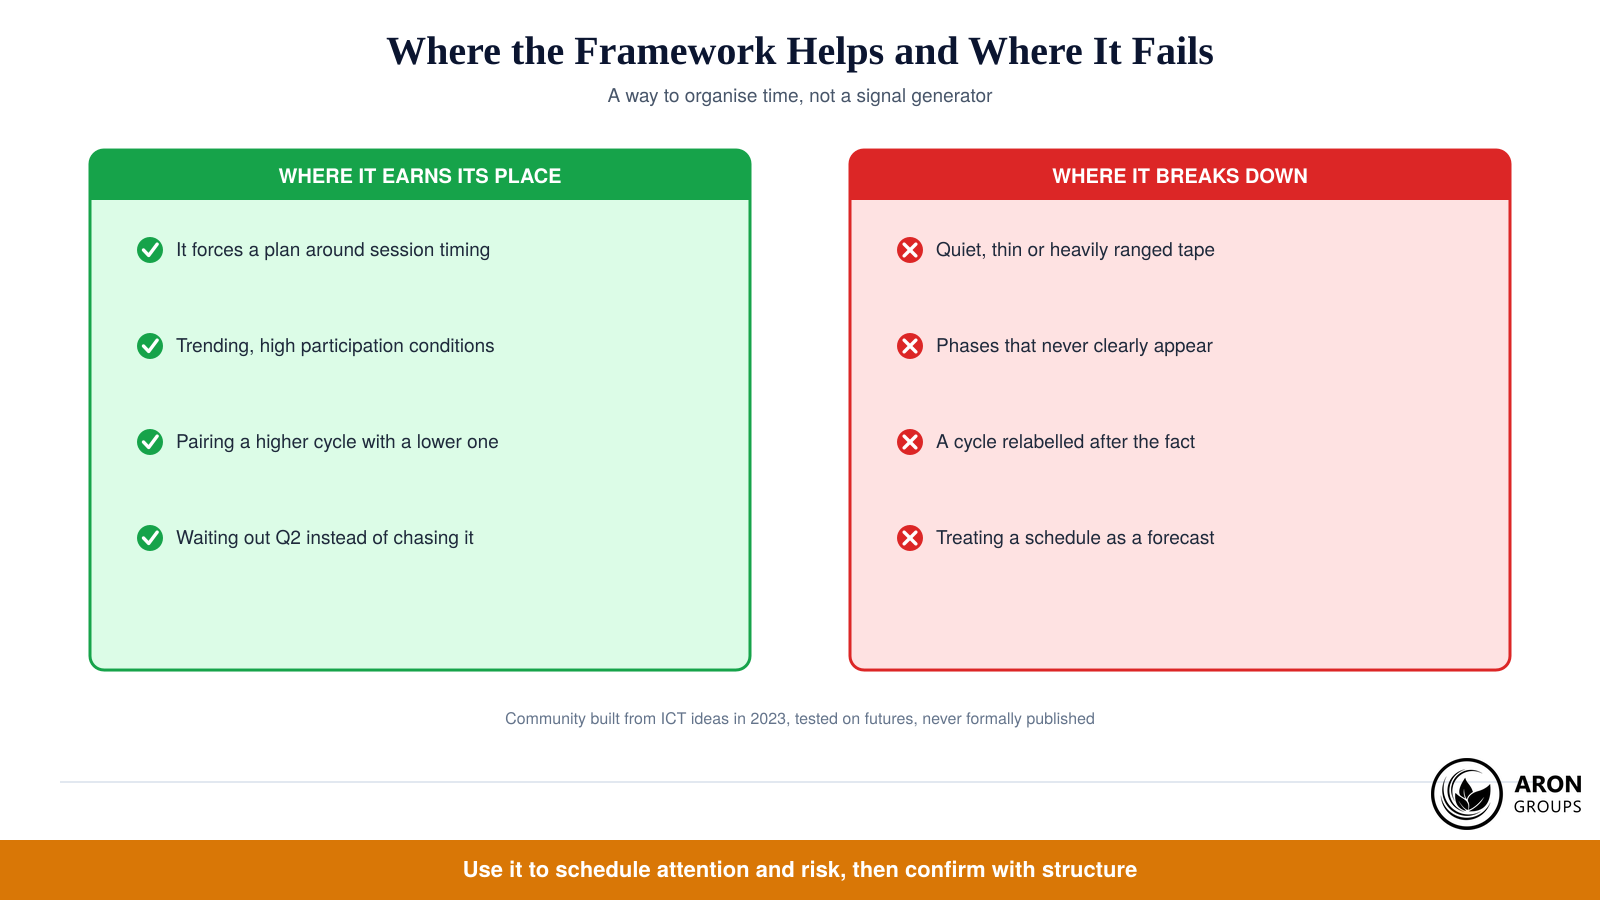
Quarterly Theory is a community framework, not an established result. It was assembled from ICT concepts in 2023, it circulates through videos, notes and indicator scripts rather than any formal publication, and its original development was on futures markets, so behaviour in spot forex or on CFDs may differ. None of that makes it useless, but it does mean the burden of proof sits with the trader, and out-of-sample backtesting is the only way to carry it.
The deeper caution is flexibility. Because a cycle may be read as starting at X rather than A, and because four phases can be mapped onto almost any chart in hindsight, the framework can explain nearly everything after the event while forecasting far less before it. Its own practitioners are clear that it works best in trending, institutional conditions and poorly in thin or heavily ranged markets. That is why the honest test is a live equity curve rather than a screenshot of a session that happened to fit.
The timing element deserves the same scepticism. Session structure is real, and the Bank for International Settlements documents how unevenly FX activity is spread across the trading day, but concentrated activity in a window is not the same as a predictable four-phase sequence inside it. Regulators also restrict leverage on these products precisely because intraday strategies fail more often than their promoters suggest, so position sizing matters more than the elegance of the schedule.
Where Aron Groups Fits
Any time-based framework needs a chart clock you can trust and costs that do not punish intraday activity. Aron Groups runs MetaTrader 5 with market execution on ECN accounts, so entries around a session open fill at the next available price rather than being requoted. Setting the platform to a New York offset is worth doing before you start, and the MT5 toolbox guide covers the workspace setup.
For testing, a demo evaluation lets you log a full quarter of sessions without capital at risk, and the commission-free Nano account trades from 0.0001 lots when you want live data on the same rules. Regulators have repeatedly warned retail traders about aggressive OTC forex marketing, so treat any course promising certainty around these cycles with suspicion.
Conclusion
Quarterly Theory earns its following because it answers a question most intraday traders never answer properly: when should I be paying attention, and what should I expect while I am. Dividing time into quarters, expecting a sweep in Q2 and reserving conviction for Q3 is a disciplined way to structure a session, and the True Opens give that structure a price anchor.
Where it stops being useful is the moment it becomes prediction. The phases are a description of common behaviour, not a schedule the market has agreed to keep, and a framework this flexible can be fitted to any chart afterwards. Use it to organise attention, confirm with structure, and let capital preservation set the size, which is the habit that separates a professional trader from a follower of frameworks.
Frequently Asked Questions
Quick answers to the questions traders ask most about Quarterly Theory.
Who created the Quarterly Theory?
Jevaunie Daye, who trades as Traderdaye, introduced it in 2023 after studying the Inner Circle Trader material of Michael Huddleston. It is not an academic model and it has no formal publication, so what circulates is a mixture of his own teaching and community interpretation.
What is a True Open in Quarterly Theory?
The opening price of a cycle’s second quarter. For the trading day it is midnight New York time, and for the London, New York and afternoon sessions it is 01:30, 07:30 and 13:30 New York time. It is used as a premium and discount reference rather than as an entry level in itself.
Is there a Quarterly Theory indicator?
Yes. Community scripts for MetaTrader 5 and TradingView draw the quarter boundaries and True Opens automatically, which saves counting and avoids off-by-one errors on the 90 minute grid. An indicator only draws the schedule, so the phase reading and the risk management strategy still have to be yours.
Does Quarterly Theory work in forex as well as futures?
It was developed on futures, where session boundaries and volume are cleaner, and the same session logic carries over to spot forex and gold because the participants overlap. That is a reasonable expectation rather than a demonstrated fact, so test it on the instruments and hours you actually trade and check the result against the drawdown you would have accepted.