
icon icon Home
icon icon Accounts
icon icon Quick start
icon icon Symbols

The Ultimate Guide to the TTM Squeeze Indicator: Setup, Rules, and Strategy

Author
Abe Cofnas
Abe Cofnas
calendar Last update: 29 August 2026
watch Reading time: 10 min

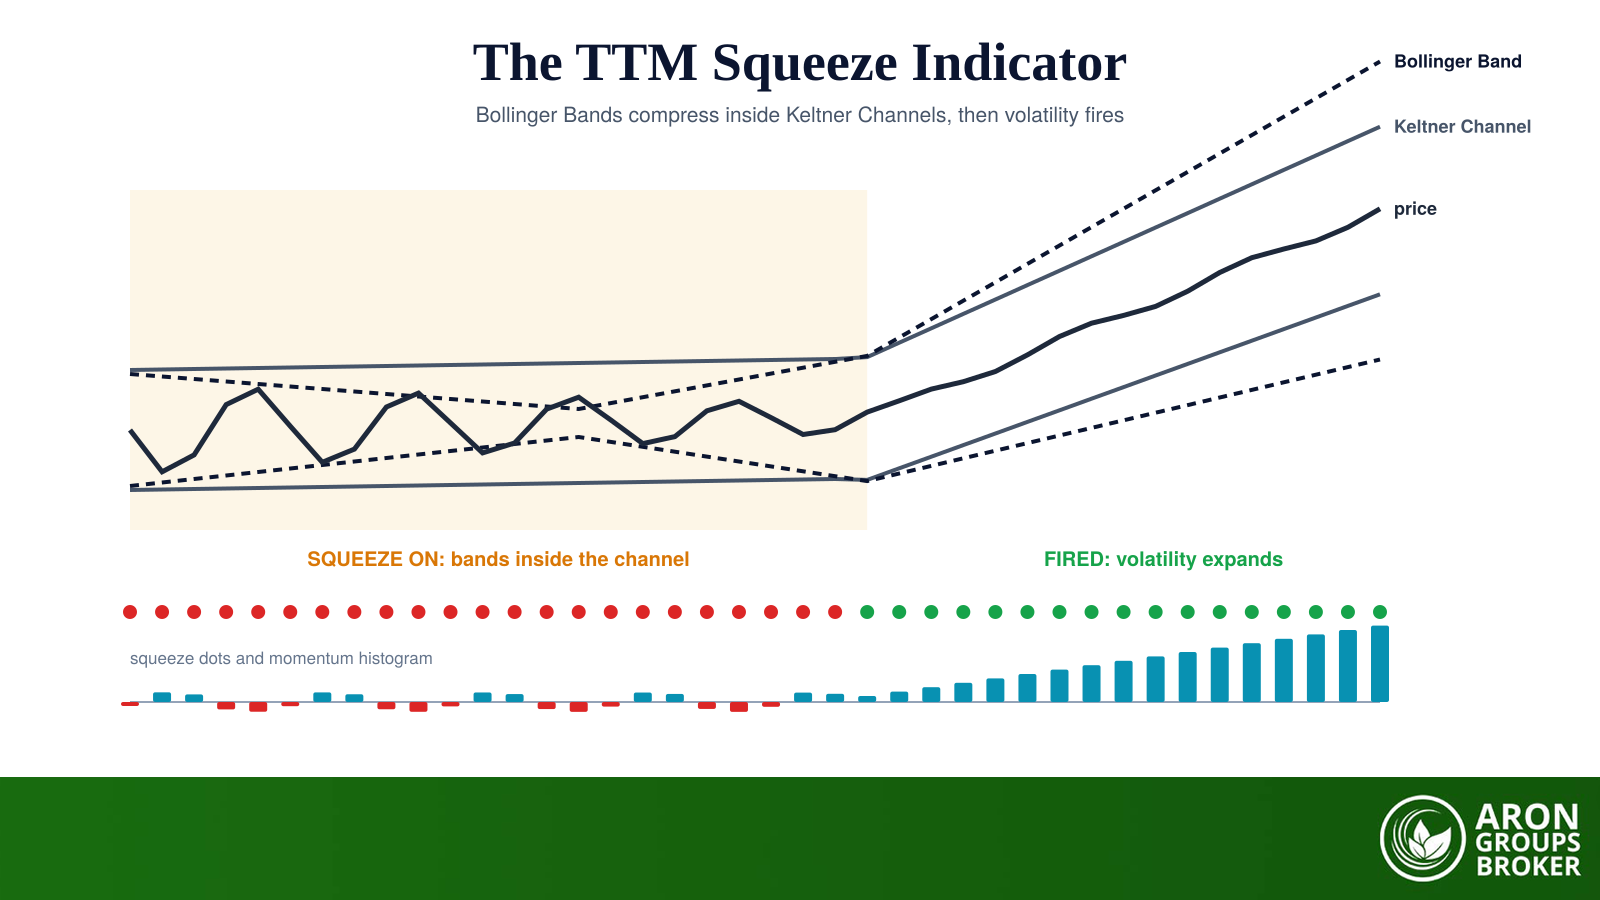
The TTM Squeeze indicator identifies periods of unusually low volatility that often come before large directional moves. It does this by comparing two familiar tools: when the Bollinger Bands contract entirely inside the Keltner Channels, the market is compressed and the indicator marks a squeeze. When the bands expand back outside the channels, the squeeze has fired, and a momentum histogram underneath tells you which way to lean.

It was built by John Carter, author of Mastering the Trade and founder of Trade the Markets, now Simpler Trading, which is where the TTM initials come from. The premise is that volatility cycles rather than trends: quiet periods lead to violent ones and back again. That makes the squeeze a timing tool for any breakout strategy rather than a trend indicator in its own right.

This guide covers the mechanics behind the dots, how to read every colour in both the classic and Pro versions, the default settings and how to adjust them for scalping or position trading, a step by step execution plan with stops and targets, and an honest account of where the indicator fails.

bookmark
Key Takeaways
  • A squeeze is on when 20 period Bollinger Bands at 2.0 standard deviations sit inside 20 period Keltner Channels at 1.5 ATR.
  • In the classic version red dots mean the squeeze is on and green dots mean it has fired; the first green dot is the trigger bar.
  • The momentum histogram supplies direction: cyan is bullish and building, blue is bullish and fading, red is bearish and building, yellow is bearish and fading.
  • Squeeze Pro adds three compression levels using 2.0, 1.5 and 1.0 ATR channels, so orange marks the tightest squeeze rather than a fired one.
  • The dots time the move and never predict its direction, so entries need histogram agreement, a stop behind the range and sizing for failed fires.

What Is the TTM Squeeze Indicator?

The TTM Squeeze is a volatility and momentum indicator in one panel. The volatility half asks a single yes or no question on every bar: are the Bollinger Bands currently inside the Keltner Channels? The answer is plotted as a coloured dot on the zero line. The momentum half plots a histogram that measures how far price sits from a reference midpoint and whether that distance is growing or shrinking. Together they answer when something is likely to happen and, once it starts, in which direction.

sms-star

Risk Disclosure
Trading forex and CFDs carries a high level of risk and can result in the loss of all your capital. This content is educational and is not investment advice. Never risk money you cannot afford to lose.
Where the Idea Comes From

Carter’s framing is that markets spend most of their time going sideways and only a minority of it making directional moves, with his own firm putting the sideways share at roughly 80 per cent. Treat that figure as a rule of thumb rather than a measured constant, because it varies by instrument and timeframe. The underlying observation is solid and predates the indicator: volatility is mean reverting, so periods of contraction tend to be followed by expansion. The squeeze simply makes that cycle visible, in the same spirit as any other systematic trading tool.

The Mechanics: Bollinger Bands Inside Keltner Channels

Both components measure dispersion, but they measure different things, and that is what makes the comparison meaningful. Bollinger Bands are set two standard deviations from a 20 period moving average, so they react quickly to closing price scatter. Keltner Channels sit 1.5 average true range from a 20 period average, and because ATR includes gaps and the full high to low range, they respond more steadily.

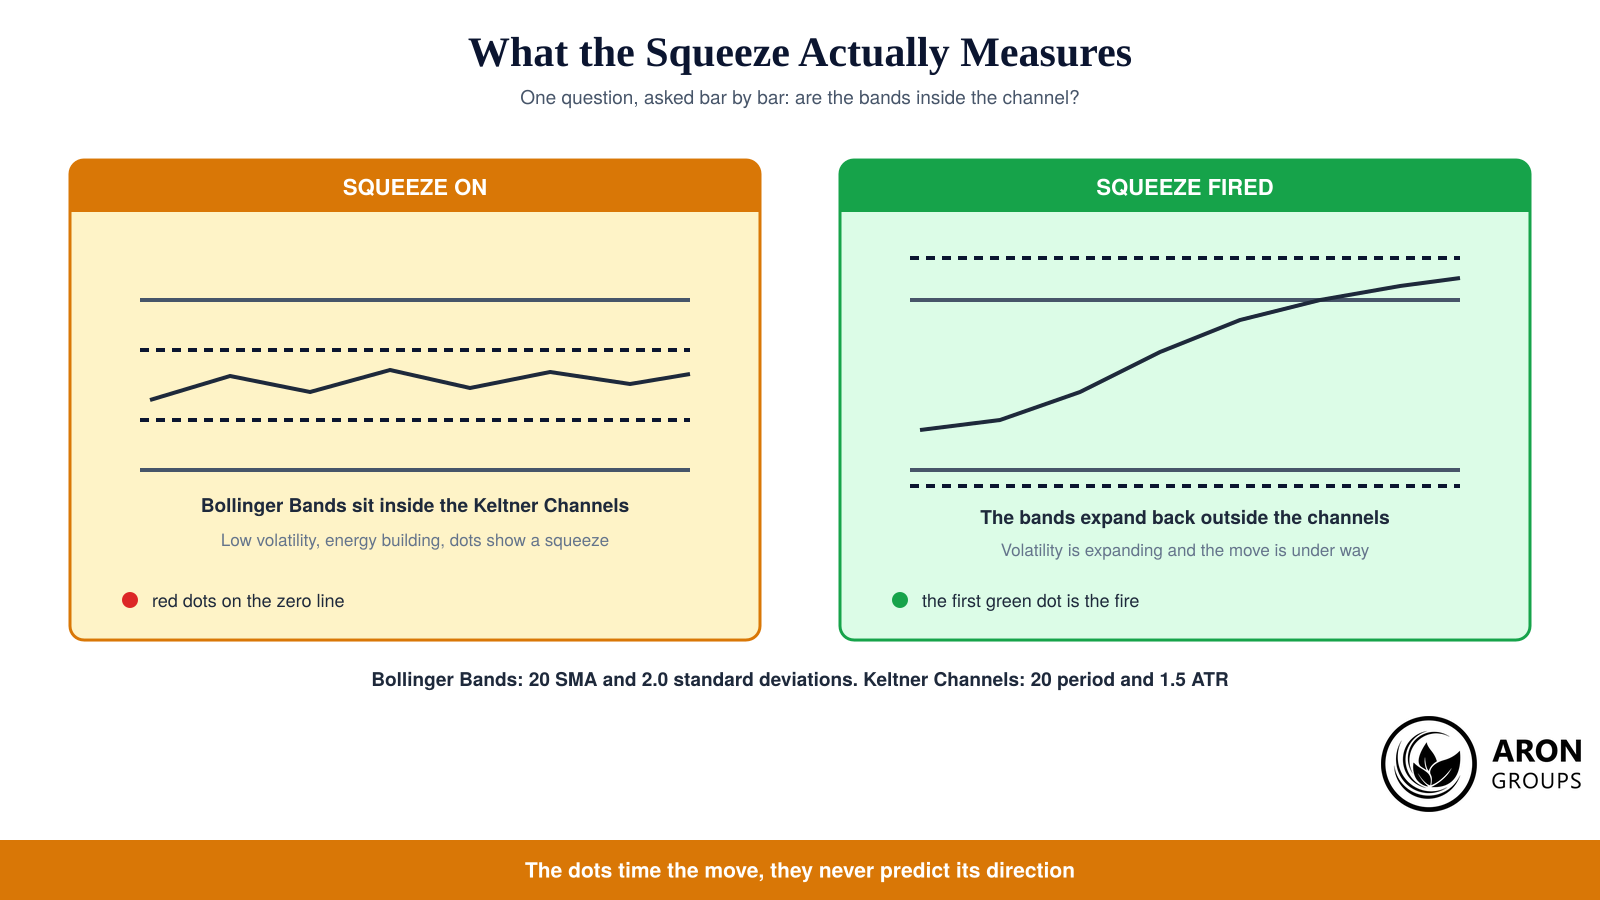
The whole indicator rests on one comparison: whether the standard deviation bands sit inside the ATR channels.

When closing prices cluster tightly, standard deviation collapses faster than average true range, so the Bollinger Bands slip inside the Keltner Channels and the squeeze is on. When a breakout begins, closing prices scatter, the Bollinger Bands expand back outside, and the squeeze fires. One practical warning: implementations differ on whether the Keltner basis is a simple or exponential average, and on whether the width uses ATR or the older range formula Carter originally referenced, so dot timing can differ by a bar between platforms.

The Momentum Histogram

The histogram is not a standard momentum oscillator. It measures the distance between the close and a reference point that blends the midpoint of the recent high to low range with the 20 period moving average, then fits a linear regression through those values to smooth them. Bars above zero mean price is above that reference and below zero mean it is beneath it. The slope matters more than the sign, because a shrinking positive bar is a warning while a growing one is confirmation.

Reading the Dots and the Histogram Colours

Colour is where most new users go wrong, partly because the classic indicator and the Pro version use different palettes, and partly because third party scripts recolour everything. The safe habit is to open the script’s own legend before trading it. The two schemes below cover the versions you will meet most often.

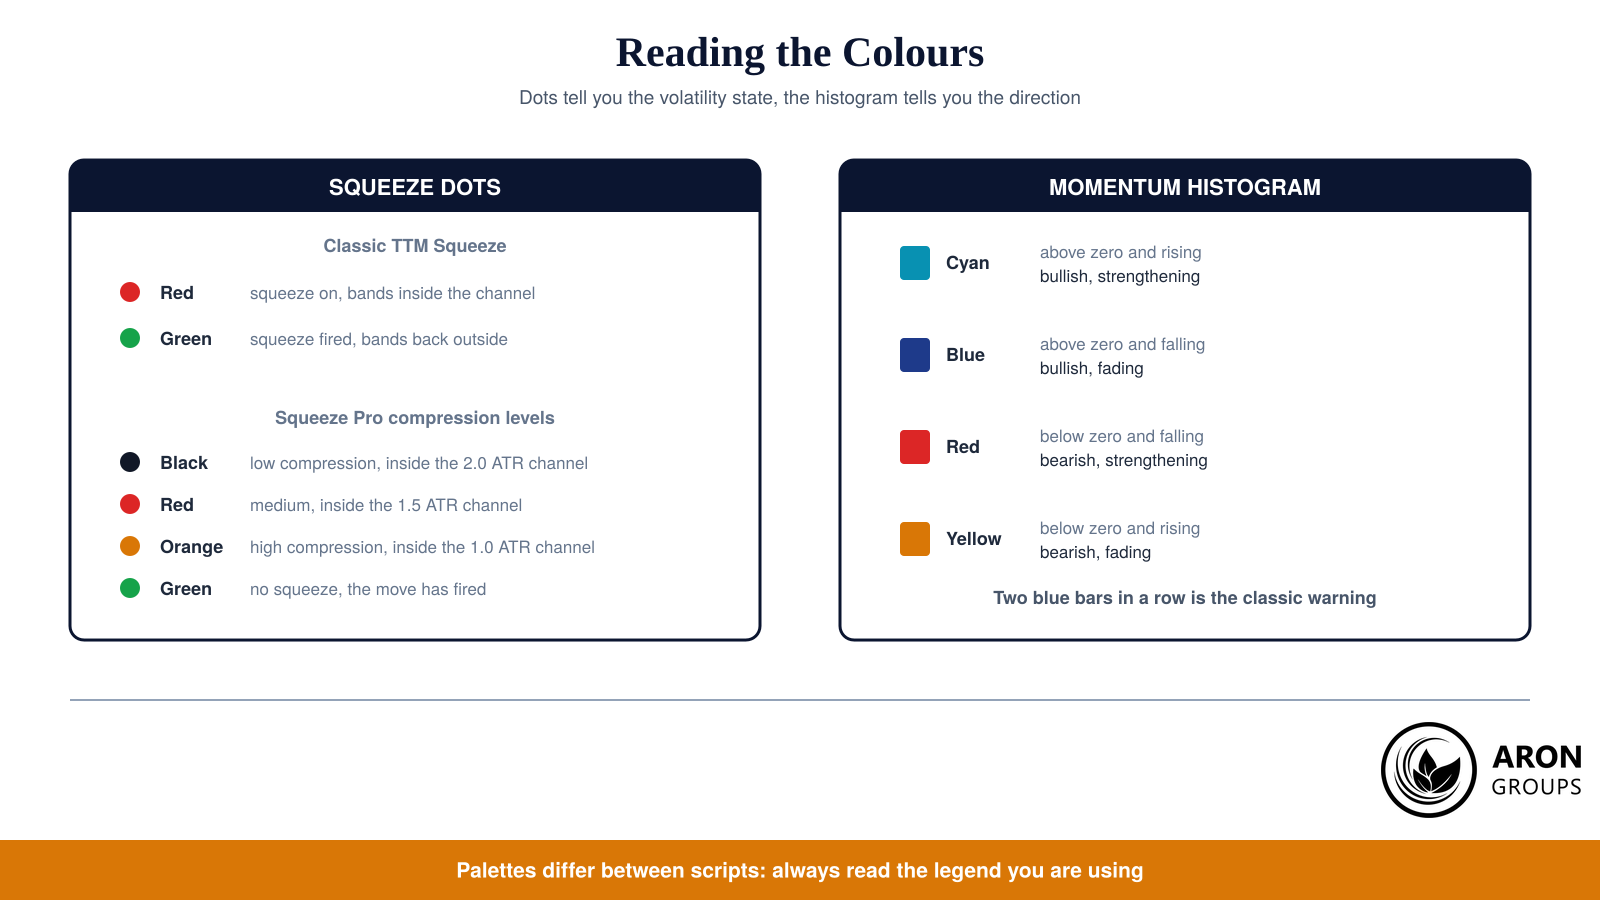
Two colour systems in one reference: squeeze state on the left, momentum direction on the right.
Dot colourClassic TTM SqueezeTTM Squeeze Pro
BlackNot usedLow compression, bands inside the 2.0 ATR channel
RedSqueeze on, bands inside the channelMedium compression, inside the 1.5 ATR channel
OrangeNot usedHigh compression, inside the 1.0 ATR channel
GreenSqueeze fired, bands back outsideNo squeeze, the move has fired

Table 1: Squeeze dot colours in the classic indicator and in the three level Pro version.

sms-star

Rule
A common misreading: in Squeeze Pro, orange does not mean the squeeze has fired. It marks the tightest compression of all, the moment before the move. Only green means fired.
Histogram colourPosition and slopeWhat it says
CyanAbove zero and risingBullish momentum building, the strongest long condition
BlueAbove zero and fallingStill bullish but fading, often an exit warning
RedBelow zero and fallingBearish momentum building, the strongest short condition
YellowBelow zero and risingStill bearish but fading, a possible turn

Table 2: The four histogram states and how each one is normally traded.

Carter’s own rule of thumb is that a long taken on a fired squeeze with cyan momentum stays valid until two consecutive blue bars appear, which is a tidy way of saying that fading momentum ends the thesis before price proves it wrong. The mirror rule applies to shorts with red bars turning yellow.

Settings: Defaults and How to Adjust Them

The defaults are deliberately conservative and they are what almost every published example uses, so change them only with a reason. Length sets the lookback for both components, the Bollinger multiplier sets how quickly the bands contract, and the Keltner multiplier sets the reference width the bands have to fit inside. Lowering the Keltner multiplier makes squeezes rarer and stricter; raising it makes them common and less meaningful.

SettingDefaultEffect of raising itTypical adjustment
Length20Slower, fewer and longer squeezes10 to 14 for scalping, 20 to 34 for position trading
Bollinger multiplier2.0Bands widen, squeezes become rarerLeave at 2.0 in almost all cases
Keltner multiplier1.5Channels widen, squeezes become common1.0 for stricter signals, 2.0 for more of them
Momentum length20Smoother histogram, later colour changesMatch it to the squeeze length

Table 3: The TTM Squeeze settings, their defaults, and sensible adjustments.

For scalping on one or five minute charts, shortening the length to roughly 10 to 14 makes the indicator fire often enough to be useful within a session, at the cost of more failed breaks. For position trading on daily charts, lengthening it towards 34 produces fewer squeezes with more meaningful expansions. Whatever you choose, test it with out-of-sample backtesting on the instrument you actually trade rather than adopting numbers from an equity example.

How to Trade the TTM Squeeze, Step by Step

The sequence below is the standard interpretation of Carter’s rules. It is mechanical on purpose: the value of the indicator lies in waiting for a specific combination of conditions rather than reacting to the first quiet market you see.

Step 1: Find a Mature Squeeze

Look for a run of consecutive squeeze dots rather than one or two. A longer compression stores more energy, and in the Pro version a progression from black through red to orange shows the compression tightening. Mark the high and the low of the consolidation while you wait, because those levels become your structure.

Step 2: Wait for the First Green Dot

The trigger bar is the first green dot after one or more coloured dots, which is the moment the Bollinger Bands escape the Keltner Channels. Entering earlier is guessing, since a squeeze can persist for far longer than it looks like it should. Entering several bars later usually means paying for the part of the move you were waiting for.

Step 3: Take Direction from the Histogram

The dots say when, never which way. Go long only when the histogram is above zero and rising, shown as cyan, and short only when it is below zero and falling, shown as red. If the histogram disagrees with the breakout candle, or if it is flat around the zero line, there is no trade.

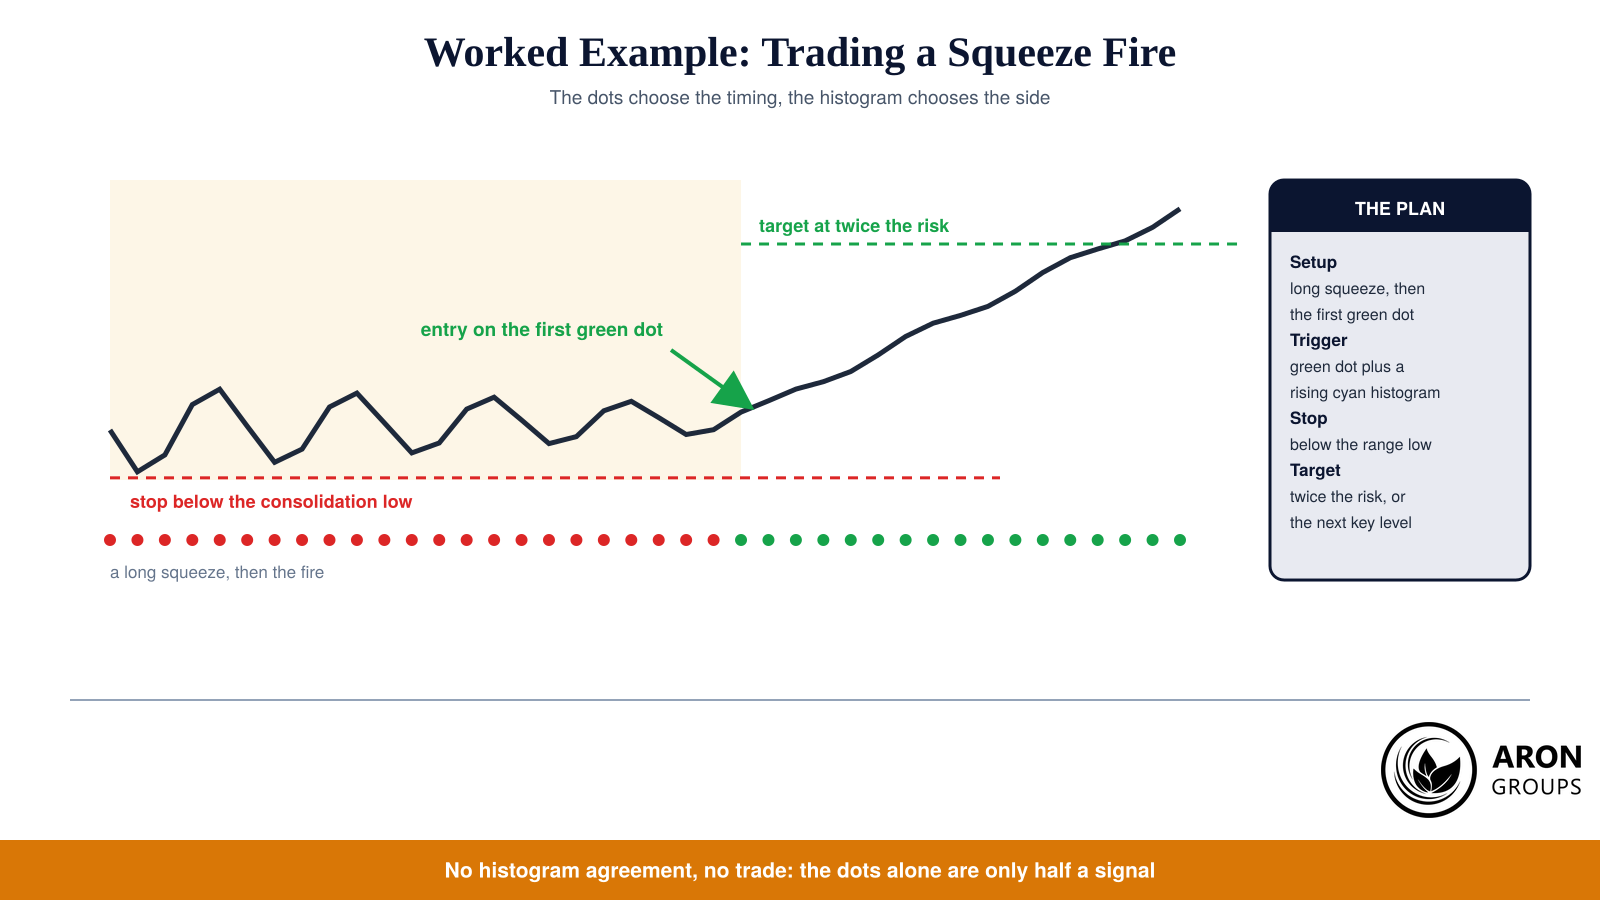
A textbook sequence: a long compression, the first green dot as the trigger, a stop behind the range and a target at twice the risk.

Step 4: Place the Stop Behind Structure

Put the stop on the far side of the consolidation the squeeze formed, below the range low for a long and above the range high for a short. That level is where the breakout thesis is wrong, which makes it the only honest place for it. Using an ATR multiple of the same range is a reasonable alternative on fast instruments.

Step 5: Define the Exit Before the Entry

Set the first target at a fixed multiple of the risk, commonly two, or at the next obvious level, and decide in advance whether the rest trails. Carter’s fading momentum rule provides a natural second exit: two blue bars after a long, or two yellow bars after a short.

Position sizing is what turns this from a chart pattern into a plan. Fix the fraction of the account risked on the distance to that structural stop, keep a risk-reward indicator visible while the trade runs, and accept that a proportion of fired squeezes will fail immediately.

Mini Example: A Squeeze Fire in Sequence

A pair consolidates for two weeks on the four hour chart. The dots stay red for around twenty bars while the range narrows, and in the Pro version the last few turn orange. The range is clearly defined, so the trader marks its high and low and does nothing else.

On the next bar the dot turns green and the histogram, which had been hovering near zero, prints a rising cyan bar. The long is taken on that close, the stop goes just below the range low, and the first target is set at twice that distance. If the histogram turns blue for two bars before the target, the position comes off there instead.

Multi-Timeframe Alignment

One refinement is worth the extra screen space. Because the calculation is identical on every timeframe, you can check whether a squeeze on your trading chart sits inside a squeeze on the one above it. A four hour fire that happens while the daily is still compressed tends to run further than one that fires against a daily that has already expanded and is winding down. Traders who scan for this call it stacked or aligned compression, and the practical use is filtering rather than prediction: it does not tell you which way the move will go, but it does tell you which fires are worth a full position and which deserve a reduced one.

Where the TTM Squeeze Fails

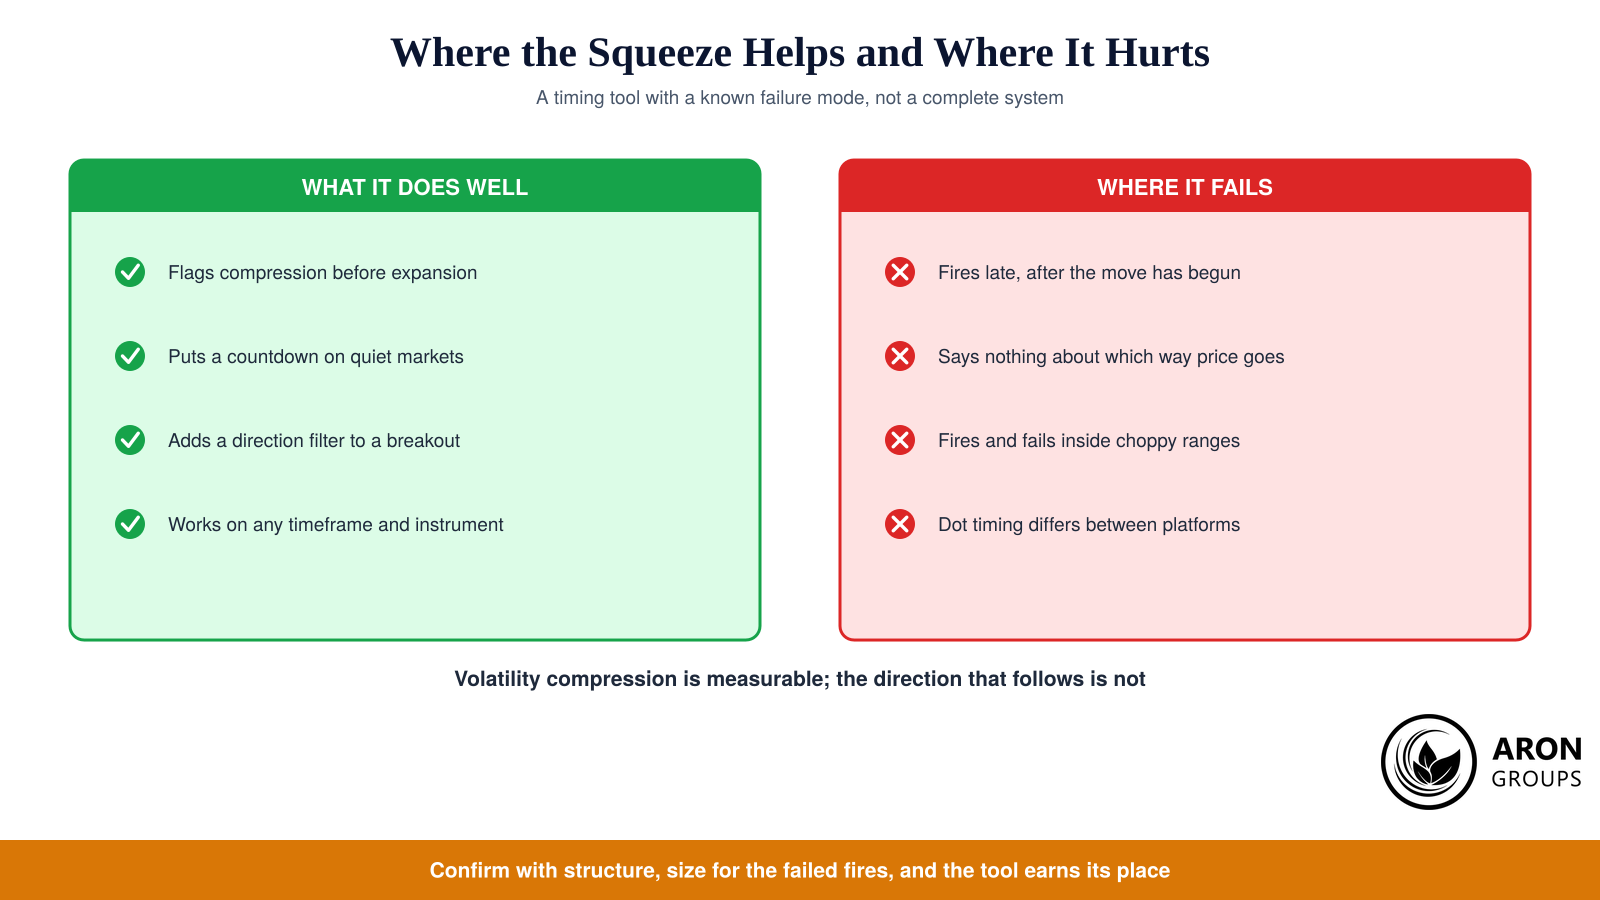
The indicator has three well known weaknesses. It is late by construction, because the fire confirms an expansion that has already begun. It is directionless, so the histogram, not the squeeze, carries the entire burden of choosing a side. And in choppy conditions squeezes fire, reverse and fire again, which produces a run of small losses that erode an equity curve faster than the occasional clean breakout repairs it.

The squeeze measures compression reliably; what it cannot do is tell you which way the expansion will resolve.

The honest framing is that compression is measurable and direction is not. Nothing in the mathematics of Bollinger Bands and Keltner Channels contains information about which way price will break, which is why the tool belongs inside a wider trading edge that includes structure, higher timeframe bias and a rule for standing aside. European regulators report that between 74 and 89 per cent of retail accounts lose money trading leveraged products, and breakout systems traded without filters are a well represented way of joining them.

Is a longer squeeze really a better squeeze?
It is a popular claim and an intuitive one, but the evidence is anecdotal rather than established. A long compression does mean a tighter range and therefore a closer stop, which improves the risk-reward arithmetic whether or not the move is bigger. Treat duration as a position sizing input rather than as a promise of magnitude.

Platforms: TradingView, MetaTrader and the Pro Version

The original TTM Squeeze is native to thinkorswim, and it is also built into several charting packages. On TradingView the indicator is not an official built-in, so what most people use is a community port. Some follow Carter’s colours exactly, while widely used versions mark the squeeze with crosses instead of dots and recolour the histogram entirely. Ports also exist for MetaTrader 5, and since the calculation is only bands, channels and a regression, the logic transfers cleanly to any platform.

TTM Squeeze Pro is Simpler Trading’s paid upgrade and the main functional difference is resolution. Instead of one squeeze state it compares the Bollinger Bands against three Keltner Channels at 2.0, 1.5 and 1.0 ATR, so you can see compression tightening in stages rather than as a single binary flag. Free community versions replicate that idea, though their colour assignments vary, which is exactly why the legend habit matters.

Where Aron Groups Fits

Squeeze fires are fast by definition, which makes execution part of the strategy. Aron Groups runs MetaTrader 5 with market execution on ECN accounts, so an entry on the trigger bar fills at the next available price rather than being requoted, and floating spreads mean the cost you see is the cost of the moment. Custom indicators and alerts can sit on the same platform you trade.

Because a breakout method needs a large sample before its numbers mean anything, test cheaply first. A demo evaluation costs nothing and lets you log fifty fires across several instruments, and the commission-free Nano account trades from 0.0001 lots when you move to live data. Leveraged trading magnifies both the clean breakouts and the failed ones, so keep the size small while the sample builds.

Conclusion

The TTM Squeeze earned its following because it answers a question most indicators ignore. Rather than trying to predict direction, it identifies the conditions under which a large move becomes more likely, and it does so with two well understood tools rather than a black box. The dots handle timing, the histogram handles direction, and the combination is genuinely more useful than either half alone.

The discipline it asks for is equally clear. Wait for a mature squeeze, take the first green dot rather than anticipating it, demand histogram agreement, place the stop where the idea is actually wrong, and expect a meaningful share of fires to fail. Do that with a drawdown you have measured rather than hoped about, put capital preservation ahead of catching every expansion, and the squeeze becomes a reliable part of a process instead of another promise on a chart.

Frequently Asked Questions

Short answers to the questions traders ask most about the TTM Squeeze.

What are the best TTM Squeeze settings?

The published defaults of length 20, a 2.0 Bollinger multiplier and a 1.5 Keltner multiplier are the right starting point and suit swing trading on four hour and daily charts. Shorten the length towards 10 to 14 for intraday scalping and lengthen it towards 34 for position trading, and tighten the Keltner multiplier to 1.0 if you want fewer, stricter signals.

What do the black dots mean on the TTM Squeeze?
Black dots appear only in the Squeeze Pro style versions, where they mark the loosest of three compression levels, with the Bollinger Bands inside the widest 2.0 ATR channel. The classic indicator has no black dot at all: it uses red for a squeeze and green for a fire.

Does the TTM Squeeze repaint?

No. Both components are calculated from closed bars, so once a dot or histogram bar has printed on a completed candle it does not change. The values on the current unfinished bar do move as it forms, which is normal for any indicator, so wait for the bar to close before acting and your risk management strategy will thank you.

Can the TTM Squeeze be used on forex and gold?

Yes. The calculation is instrument agnostic and volatility cycles exist in currencies and metals just as they do in equities. The practical differences are that spot forex has no central volume, so volume based confirmation is unavailable, and that session opens and scheduled news cause many squeezes to fire on a fixed schedule rather than randomly.

Continue Reading
not-found
calendar 29 August 2026
Rate this article

Leave a Reply

Your email address will not be published. Required fields are marked *

No thanks