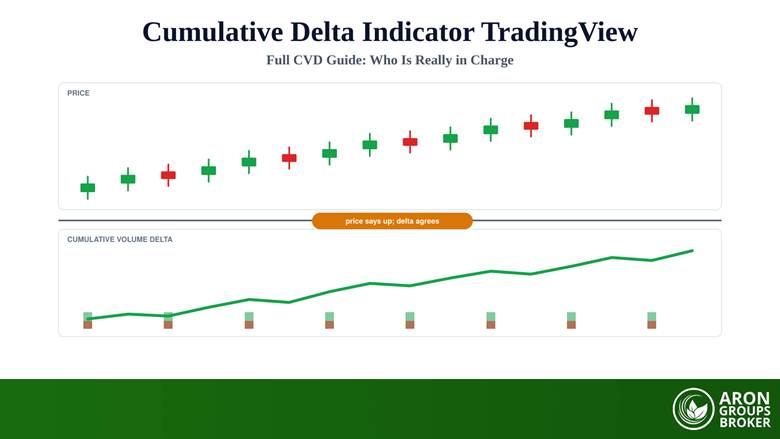

The cumulative delta indicator, usually written CVD for cumulative volume delta, keeps a running total of buy volume minus sell volume, so you can see which side has been hitting the market aggressively rather than just where price ended up. When the total rises, buyers are lifting offers; when it falls, sellers are hitting bids. TradingView ships a built-in CVD indicator that estimates this from intrabar data, and it is the most accurate option available on the platform without a true tick feed.
The appeal is simple: price can drift on thin participation, but delta measures commitment. A rally that advances while CVD climbs is being paid for; a rally that advances while CVD sinks is being carried by something other than aggressive buying, and tends not to be carried far. Reading that difference is a genuine input to a trading edge, provided you respect the data caveats this guide spells out.
Below: what delta and cumulative delta actually measure, how TradingView estimates them, the exact setup steps, how to read trend confirmation and CVD divergence, where absorption and exhaustion fit, the honest comparison with OBV, and the data-quality map that decides which markets CVD can be trusted on.
- CVD is a running total of buy volume minus sell volume: rising CVD means buyers are dominant at market, falling CVD means sellers are.
- TradingView's built-in CVD estimates per-bar delta from lower-timeframe data and resets at the anchor period you choose.
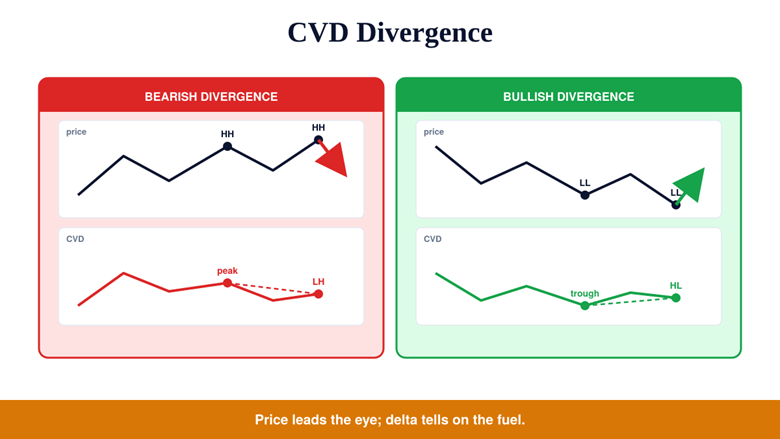
- CVD rising with price confirms a trend; price making new highs while CVD makes lower highs is a bearish divergence, and the mirror image is bullish.
- CVD is most reliable on futures and crypto, where real volume exists; spot forex uses tick volume, a proxy that weakens the signal.
- It is a confirmation tool, not a system: combine it with market structure and support and resistance, and expect it to fade in thin sessions.
What Cumulative Volume Delta Actually Measures
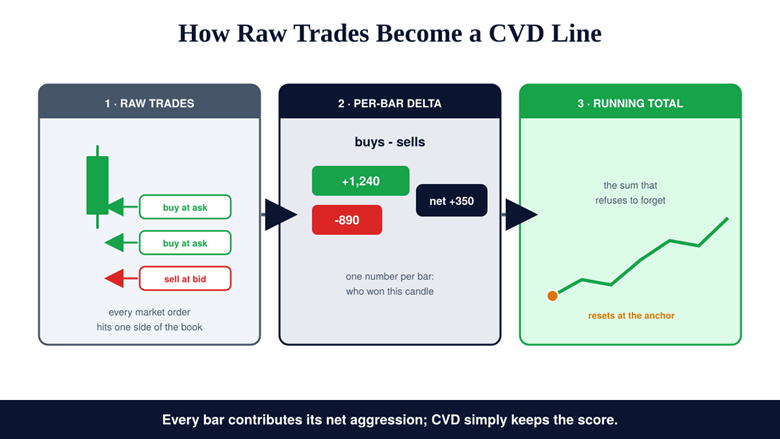
Start one layer down. Volume delta is a per-bar figure: the volume transacted at the ask, aggressive buying, minus the volume transacted at the bid, aggressive selling. A bar with 1,240 contracts bought at market and 890 sold at market has a delta of positive 350. Cumulative volume delta then adds each bar’s delta to a running total, so the line carries memory: it shows the session’s or the week’s accumulated imbalance rather than one bar’s mood. On TradingView the total resets at the anchor period you select, commonly the session, so each day starts the argument fresh.
Volume Delta vs Cumulative Volume Delta
The two are one derivative apart and answer different questions. Per-bar delta answers who won this bar, and is noisy by construction. CVD answers who has been winning since the anchor, which is the question trend traders actually care about. Footprint charts belong to the first world, showing bid-ask volume inside each candle; CVD compresses that detail into a single line a chart can carry all day.
How TradingView Calculates It, and the Estimation Caveat
True delta requires knowing the side of every trade, which needs tick data. TradingView’s built-in CVD approximates instead: it examines lower-timeframe intrabar data, classifies each small bar’s volume as buying or selling by its direction, and sums the result. The approximation is good, and materially better than up-down candle colouring, but it is still an estimate, which has two practical consequences. First, use the built-in indicator rather than older community scripts that estimate from chart-timeframe candles alone. Second, treat CVD readings as evidence, and confirm them the way a systematic trader confirms anything: by backtesting the signal on the instrument you trade rather than trusting a screenshot from someone else’s market. For tinkerers, the indicator’s logic is reproducible in Pine Script, and custom versions can expose the buy and sell components separately or recolour delta candles; just resist the urge to tune parameters until the history looks perfect, because a curve fitted to the past is the most convincing way to be wrong about the future.
Anchors: Why the Reset Matters
Because CVD is a sum, its meaning depends entirely on where the sum begins. A session anchor asks who has been winning since today’s open, which suits intraday decisions; a weekly anchor asks the same across the whole week, which suits swing bias; and comparing the two on one chart shows whether today’s aggression agrees with the week’s. Changing the anchor changes the answer, which is a feature, not a bug, as long as you choose it deliberately and keep it fixed while a trade is open. An analysis that switches anchors mid-argument can prove anything, which is exactly why it proves nothing.
Setting Up CVD on TradingView, Step by Step
Step 1: Open the Indicators Tab
On your chart, click Indicators at the top and type cumulative volume delta. Choose the built-in Cumulative Volume Delta from the technicals section rather than a community estimate.
Step 2: Choose the Anchor Period
In settings, the anchor controls when the running total resets. Session is the day-trading default; week suits swing analysis. The anchor is the frame of the argument, so keep it consistent.
Step 3: Pick Candle or Line Display
CVD can render as delta candles or a single line. The line is cleaner for divergence work; candles reveal intrabar shifts. Most traders start with the line.
Step 4: Verify the Data Makes Sense
On a liquid futures or crypto chart, CVD should visibly track obvious impulses. If the line barely moves or contradicts every candle, the symbol’s volume feed is unsuitable, and no setting fixes that.
Rule: One indicator, correctly anchored, on a market with real volume, beats three order-flow tools stacked on a market that only reports ticks. Data quality decides what CVD is worth before any setting does. |
Reading CVD: Confirmation, Divergence, Absorption
Three readings cover most use. Confirmation is the baseline: price trending higher while CVD trends higher means the move is being paid for at the offer, and pullbacks against it are suspect until delta says otherwise. Divergence is the headline signal: price printing a higher high while CVD prints a lower high is bearish divergence, aggression failing to match the new extreme, and price printing a lower low while CVD holds a higher low is the bullish mirror. Divergences mark potential reversals, not scheduled ones, and they resolve best at meaningful levels rather than mid-range.
The third reading is the subtle one. Absorption appears when CVD surges but price barely moves: someone is passively absorbing the aggression, and the aggressors are usually the ones trapped when it ends. Exhaustion is the inverse shape at the end of a run, a final delta spike into a level with no follow-through. Both are order-flow stories told by the gap between effort, the delta, and result, the price.
Q: Is CVD the same as OBV?
A: No, and the difference is the classification. OBV adds or subtracts a bar’s entire volume based on whether the close was up or down, so one tick decides the whole bar’s label. CVD splits volume within each bar into buying and selling before summing, which makes it slower to compute and considerably harder to fool.
Where CVD Can Be Trusted: The Data Map
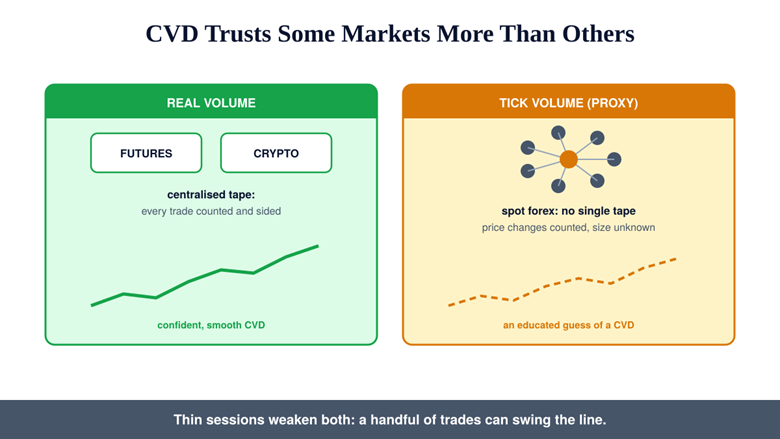
CVD inherits the quality of its volume feed, and volume is not the same thing everywhere. Futures and major crypto pairs trade on centralised venues with a real tape, so every contract is counted and can be sided: this is where CVD is most reliable. Spot forex is a decentralised, over-the- counter market spread across dealers and venues, the structure the BIS triennial survey documents in detail, so platforms show tick volume, a count of price changes standing in for true size. Tick volume correlates with real activity well enough to be useful, but it is a proxy, and CVD built on it deserves wider error bars. Everywhere, the indicator loses meaning in thin sessions, holidays, and the dead hours between sessions, when a handful of trades can swing the line without meaning anything.
A Practical Bridge for Forex Traders
There is a respectable workaround for the tick-volume problem. Currency futures track their spot pairs closely, and their centralised tape produces trustworthy delta, so many forex traders read CVD on the corresponding futures contract to set directional bias, then execute on spot. The chart they trade and the chart that informs them differ by a basis spread, not by story, and the arrangement gives spot decisions the benefit of real volume without pretending the spot feed supplies it.
Using CVD in a Strategy Without Fooling Yourself
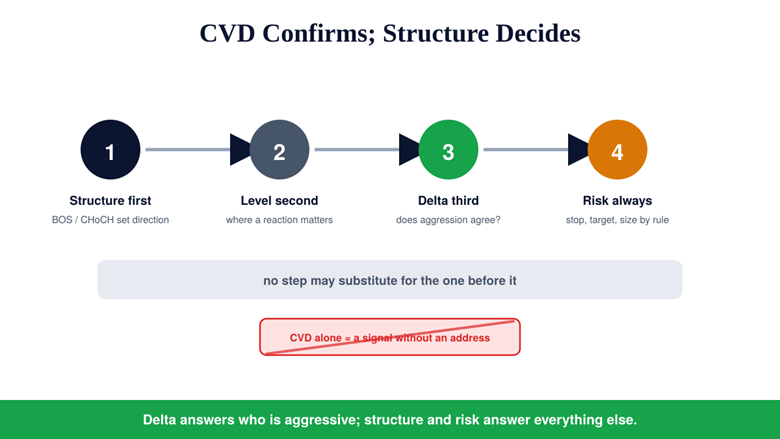
CVD is a confirmation layer, not a standalone system, and the honest workflow keeps it third in line. Market structure comes first: breaks of structure and changes of character define direction. Levels come second: support, resistance, and the zones where a reaction would matter. Delta comes third, as the tiebreaker: at your level, in your direction, is aggression agreeing or diverging? Only then does the trade exist, sized from the stop distance and a fixed risk-to-reward ratio, with position sizing set by rule. Divergence against a naked mid-range is trivia; divergence at a structural level after a sweep is a trade.
Mini Example: A Divergence That Earned the Entry (text-only scenario)
Gold futures rally into yesterday’s high late in the New York session. Price prints a marginal new high; session-anchored CVD prints a clearly lower high, bearish divergence at an external level.
The trader waits for structure: a fifteen-minute change of character confirms sellers taking control. Short entry at the retest, stop above the sweep high, target the session’s value area. The divergence alone was an observation; the level and the structure break made it a position.
Keep the base rates in view while you practise. European regulators found the large majority of retail accounts lose money on leveraged products, and US investor-education guidance on leveraged strategies is blunt that amplification cuts both ways. An order-flow tool refines entries; it does not repeal arithmetic, and effective risk management remains the feature that keeps accounts alive long enough for any edge to express itself.
Where Aron Groups Fits
A clean division of labour works well: analyse on TradingView, where the built-in CVD and your structure tools live, and execute on the MetaTrader 5 platform at Aron Groups, with alerts, hard stops, and templates enforcing the plan. MT5’s own volumes on forex symbols are tick-based, the proxy discussed above, which is one more reason to let centralised-market delta inform bias while execution stays disciplined. If order flow is new territory, rehearse the workflow on a small account first, where micro volumes make the tuition affordable, and hold the results to the only standard that matters: a smoother equity curve over months, not a perfect anecdote. That patient standard is what separates a professional trader from a collector of indicators, and our guide on how to trade forex covers the foundations beneath all of it.
Conclusion
Cumulative volume delta adds the one dimension a bare chart lacks: whether the move was paid for. TradingView’s built-in CVD makes the reading a two-click setup, the anchor keeps the argument framed, and the three readings, confirmation, divergence, and absorption, cover most of what order flow can honestly tell a chart trader.
Respect its two ceilings. The estimate is only as good as the volume feed, so trust it most on futures and crypto and least on thin sessions and tick-volume proxies. And it is a witness, not a judge: structure and levels decide the trade, delta corroborates, and capital preservation outranks them all. Used in that order, CVD earns its pane on the chart.
Frequently Asked Questions
What is the cumulative delta indicator on TradingView?
It is TradingView’s built-in Cumulative Volume Delta, a running total of buy volume minus sell volume estimated from intrabar data. Rising CVD means aggressive buyers dominate; falling CVD means aggressive sellers do. It resets at the anchor period you choose in settings.
How do I read CVD divergence?
Compare extremes. Price making a higher high while CVD makes a lower high is bearish divergence; price making a lower low while CVD makes a higher low is bullish. Both warn that the new extreme lacked matching aggression, and both mean most at significant levels rather than mid-range.
Does CVD work on spot forex?
With caution. Spot forex is decentralised, so platforms report tick volume, a count of price changes rather than true size. CVD built on tick volume is a useful approximation in active sessions, but it is weaker evidence than futures or crypto CVD, and thin hours degrade it further.
Is cumulative delta better than OBV?
It is finer-grained. OBV assigns each bar’s entire volume by the close’s direction, while CVD splits volume within the bar into buying and selling. CVD is harder to fool and better for divergence work; OBV’s advantage is simplicity and availability on any feed.