
icon icon Home
icon icon Accounts
icon icon Quick start
icon icon Symbols

Dollar Liquidity and Global Liquidity: The Macro Tide That Moves Gold, Crypto, and the Dollar

Author
Abe Cofnas
Abe Cofnas
calendar Last update: 12 October 2026
watch Reading time: 9 min

Dollar liquidity is the amount of US-dollar funding available in the financial system. Because the dollar is the world’s reserve and funding currency, it feeds a broader measure called global liquidity: the total flow of money and credit across borders. When dollar liquidity is plentiful, shares, crypto and gold tend to rise. When it drains, the dollar usually strengthens and those assets struggle.

This is a macro idea, not the ease of trading one asset, which is better described as liquidity risk. It matters in 2026 because the tide is shifting again. The Fed stopped shrinking its balance sheet on 1 December 2025, paused its reserve purchases in August 2026 and raised rates in September.

This guide explains how traders measure dollar liquidity with the Fed net liquidity formula and how the offshore dollar system can turn a squeeze into a global scramble. It covers the global liquidity cycle and why gold and bitcoin react so strongly, then sets out the honest limits: liquidity is a tide to lean with, not a timing signal.

bookmark
Key Takeaways
  • Dollar liquidity is the supply of US-dollar funding; global liquidity is the wider flow of money and credit across borders.
  • Traders track Fed net liquidity: the Fed's balance sheet minus the Treasury General Account minus the reverse repo facility, about $5.8 trillion on 23 September 2026.
  • Quantitative tightening cut the Fed's assets by $2.2 trillion from 2022, but net liquidity fell far less because $1.75 trillion drained out of the reverse repo facility.
  • Offshore dollar shortages can spike the dollar, as in March 2020, when the Fed's swap lines peaked at $449 billion.
  • Gold and bitcoin are liquidity-sensitive, but the link is a correlation that can break, so use liquidity as a backdrop, not a trigger.

What Is Dollar Liquidity?

Dollar liquidity describes how easy and cheap it is to obtain US dollars, whether through bank reserves, money markets or dollar credit. The Federal Reserve sets its core supply through its balance sheet and interest rates, while the US Treasury and money-market funds move cash in and out of the private system. When funding is abundant, investors borrow and buy assets; when it is scarce, they sell.

sms-star

Risk Disclosure
Trading forex and CFDs carries a high level of risk and can result in the loss of all your capital. This content is educational and is not investment advice. Never risk money you cannot afford to lose.
Dollar Liquidity Versus Global Liquidity

Global liquidity is the wider concept. The Bank for International Settlements (BIS) defines it as the ease of financing in global financial markets and measures it partly through foreign-currency credit to borrowers outside each currency’s home country. At the end of March 2026, US-dollar credit to non-banks outside the United States stood at $14.7 trillion, up 7.3% in a year. That shows how much of the world runs on dollars it cannot print.

Not the Same as a Liquidity Fund

Search results for dollar liquidity are crowded with money-market products that carry the phrase in their names. Those funds hold short-term dollar assets for cash management. This guide is about the macro tide that affects every market, which is a different subject from choosing a place to park cash.

Liquidity Is Quantity; Interest Rates Are Price

Liquidity and interest rates usually move together, but they are not the same thing. In October 2025 the Fed cut rates while a rebuild of the Treasury’s cash balance drained liquidity and pushed short-term funding costs up. In September 2026 it raised rates while its balance sheet was larger than at the end of 2025. Traders who watch only the policy rate miss half the picture.

Why Liquidity Moves Markets: The Risk-On, Risk-Off Tide

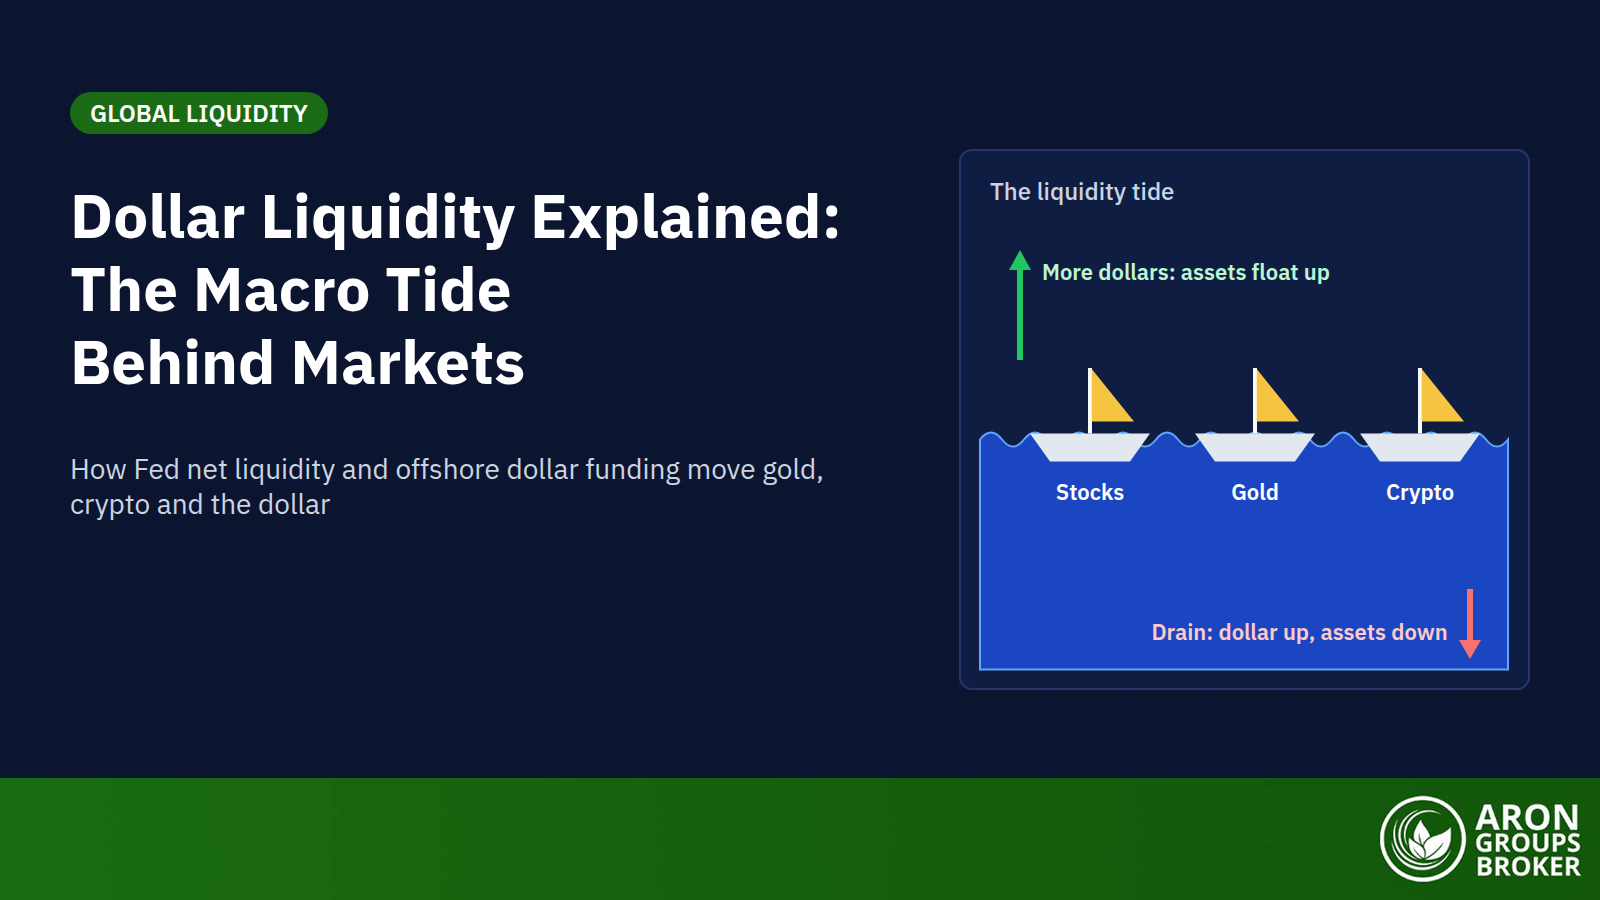
Liquidity works like a tide that lifts or lowers most boats at once. When dollars are plentiful and cheap, investors borrow to buy shares, crypto, gold and emerging-market assets, and volatility tends to fall. When dollar funding tightens, the same investors sell risk to raise cash, the dollar strengthens and correlations between assets jump. The dollar index is often the quickest readout of that tide, because a scramble for funding shows up in the currency before it shows up in credit data.

That is why liquidity can drive prices more than earnings or headlines for long stretches. It also explains why central-bank balance sheets became a closely watched market variable after 2008, when quantitative easing turned the Fed into the largest buyer in the Treasury market.

How Traders Measure It: The Fed Net Liquidity Formula

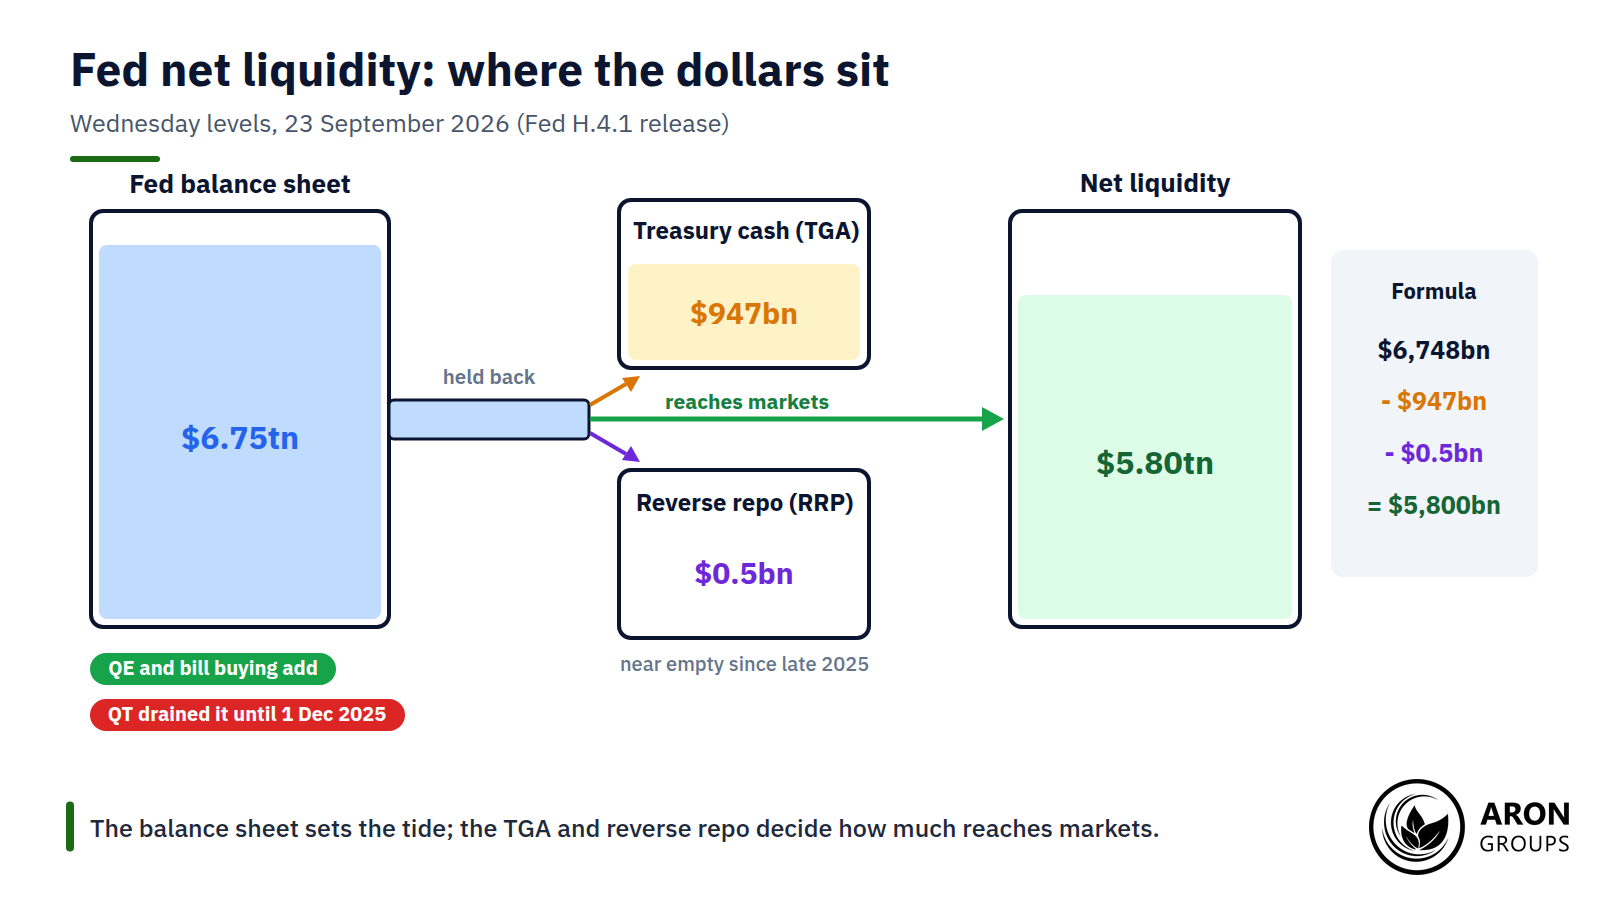
The most widely used proxy is Fed net liquidity: the Fed’s total assets minus the Treasury General Account (TGA) minus the overnight reverse repo facility (ON RRP). It is a market rule of thumb rather than an official Fed statistic, but it captures the three biggest levers on the cash available to the private sector.

The Three Moving Parts

Each part of the formula moves for a different reason, and each can offset the others:

  • Fed balance sheet: grows with quantitative easing or reserve purchases and shrinks with quantitative tightening (QT). It peaked at $8.97 trillion in April 2022, and QT ended on 1 December 2025.
  • Treasury General Account: the government’s cash account at the Fed. When the Treasury rebuilds it, for example after a debt-ceiling standoff, it pulls cash out of the system.
  • Reverse repo facility: where money-market funds park spare cash at the Fed overnight. Usage peaked at $2.55 trillion at the end of 2022 and fell to almost nothing by late 2025.

The balance sheet sets the size of the tide, while the TGA and the reverse repo act like reservoirs that fill and empty around it. A rising TGA or reverse repo balance drains the system even if the Fed does nothing, and a falling one adds liquidity without any policy decision.

The Fed's balance sheet sets the supply of dollar liquidity; the Treasury's cash account and the reverse repo facility hold part of it back.

Tracking It on FRED Without the Unit Trap

All three series are free on FRED, the St. Louis Fed’s database: WALCL for total assets, WDTGAL or WTREGEN for the TGA and RRPONTSYD for the reverse repo. Two traps catch many chart-builders. The first series are reported in millions of dollars while the reverse repo series is in billions. The two TGA series also use different conventions, a Wednesday level versus a weekly average, which can differ by more than $100 billion in a week.

Bank Reserves: The Banking System's View

Some analysts watch bank reserves instead, the cash commercial banks hold at the Fed, which stood at about $2.93 trillion on 23 September 2026. When reserves fall towards the level banks need, funding markets strain. That risk is why the Fed ended QT in 2025 and began buying Treasury bills to keep reserves ample in December.

Mini Example: Computing Net Liquidity for 23 September 2026

The Fed’s weekly balance sheet showed total assets of $6,747,704 million on Wednesday 23 September 2026. The TGA stood at $947,317 million and the reverse repo facility at $500 million on the same Wednesday basis.

Net liquidity is therefore about $6,748 billion minus $947 billion minus $0.5 billion, or roughly $5,800 billion. Using the weekly-average TGA instead gives about $5,770 billion, which is why you should always state which series you used.

What the Numbers Showed From 2022 to 2026

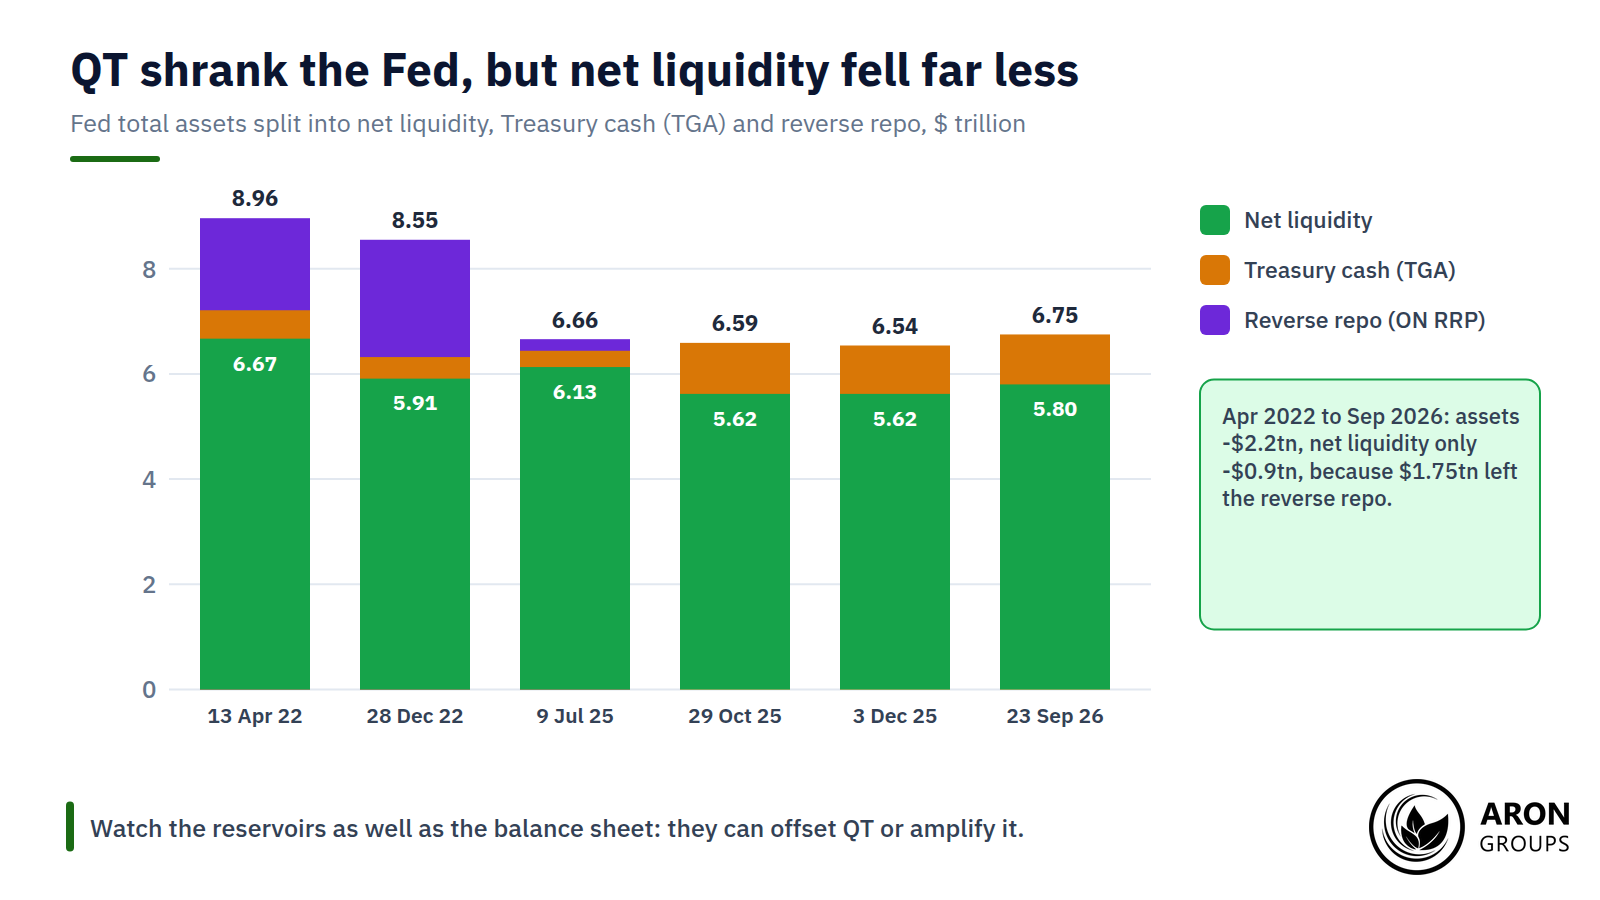
The snapshots below explain one of the least understood facts about the last tightening cycle: QT removed $2.2 trillion of assets, yet net liquidity fell by less than $0.9 trillion.

DateFed assetsTGAReverse repoNet liquidity
13 Apr 2022 (balance-sheet peak)$8.97tn$0.55tn$1.75tn$6.67tn
28 Dec 2022 (reverse repo near record)$8.55tn$0.41tn$2.23tn$5.91tn
9 Jul 2025 (debt-ceiling low in the TGA)$6.66tn$0.31tn$0.22tn$6.13tn
29 Oct 2025 (TGA rebuilt, repo stress)$6.59tn$0.96tn$0.01tn$5.62tn
3 Dec 2025 (just after QT ended)$6.54tn$0.91tn$0.01tn$5.62tn
23 Sep 2026 (latest)$6.75tn$0.95tnUnder $0.01tn$5.80tn

Fed net liquidity snapshots using Wednesday levels from the Fed’s H.4.1 release; TGA is the Treasury General Account.

Two lessons stand out. Between April 2022 and September 2026, about $1.75 trillion drained out of the reverse repo facility and back into markets, cushioning QT. And between July and October 2025, net liquidity fell by about $513 billion in under four months with no change in Fed policy. The cause was the Treasury rebuilding its cash balance after the debt-ceiling deal.

That squeeze pushed use of the Fed’s standing repo facility to a record $50.4 billion on 31 October 2025, a reminder that liquidity can tighten while interest rates stand still.

QT cut the Fed's assets by $2.2 trillion, but net liquidity fell by only about $0.9 trillion because the reverse repo facility emptied.

Global Liquidity and the Dollar Shortage

Beyond the Fed’s own balance sheet, trillions of dollars are borrowed and lent outside the United States in the so-called eurodollar system. Foreign banks and companies that borrow in dollars need a steady supply of dollar funding they cannot create themselves. When that supply tightens, their scramble becomes one of the forces that drive the US dollar higher in a crisis.

March 2020: Anatomy of a Dollar Scramble

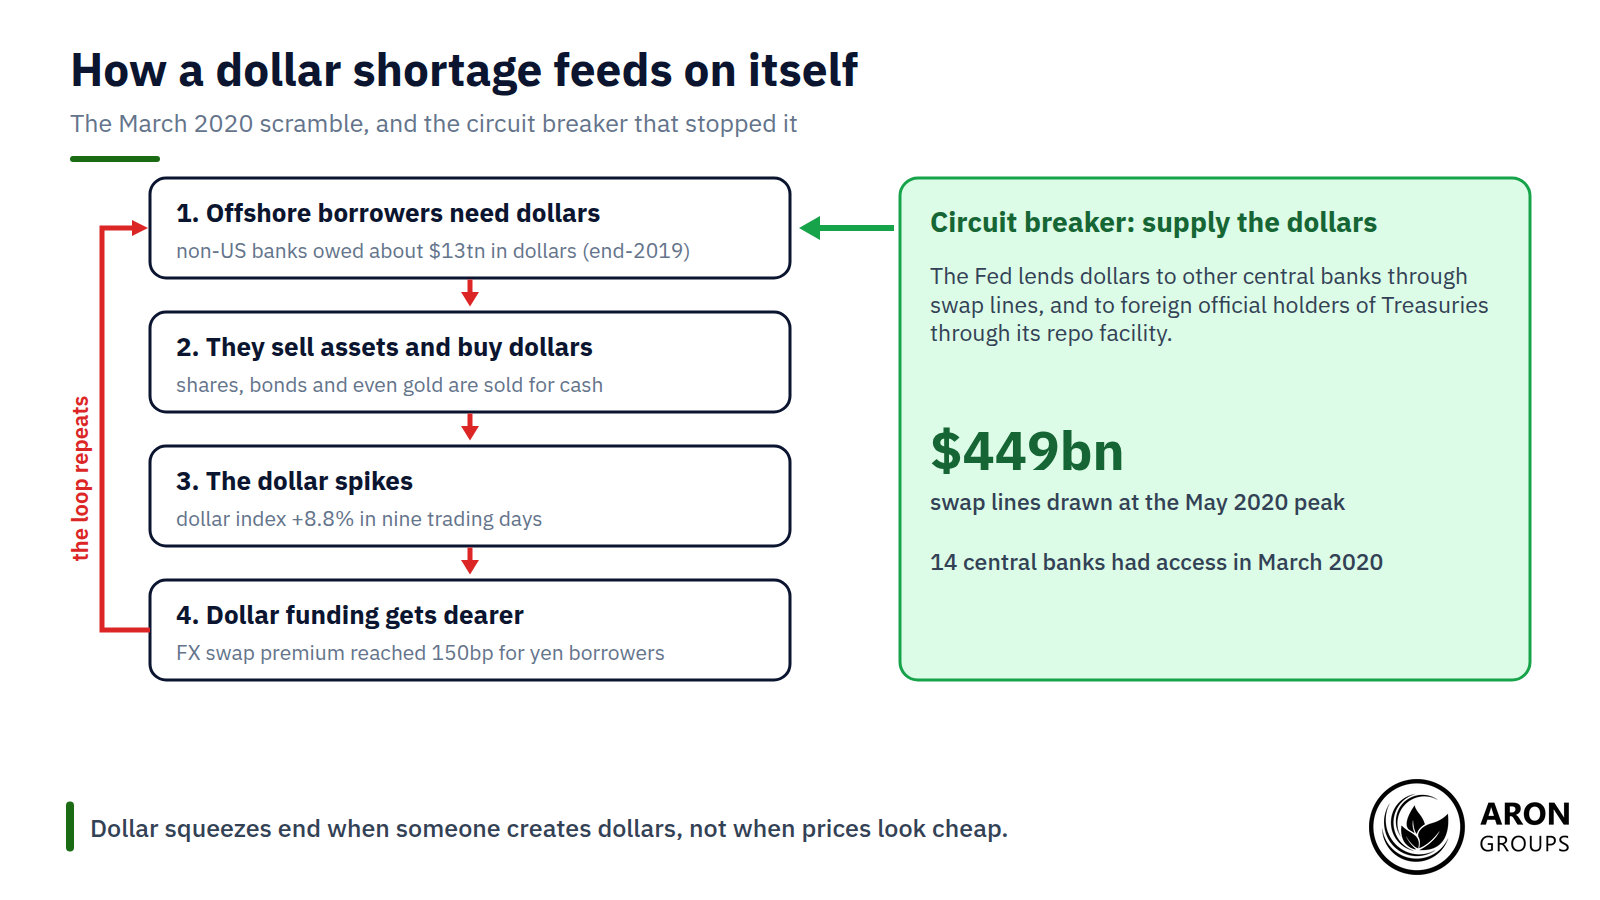
The clearest example came in March 2020. As the pandemic hit, investors, companies and foreign central banks all rushed for dollars at once. The dollar index jumped from 94.65 on 9 March to about 103 on 20 March, a rise of 8.8% in nine trading days. Gold fell about 12% as holders sold what they could to raise cash, and the cost of borrowing dollars through currency swaps jumped by up to 150 basis points for yen-based borrowers.

The Fed responded by reopening dollar swap lines to 14 central banks, lending dollars against their currencies, and by creating a repo facility for foreign official holders of Treasuries. Swap-line usage peaked at $449 billion in May 2020, and the scramble eased once dollars flowed again. Countries that manage their exchange rates feel such squeezes first, which is when currency intervention and reserve sales become urgent.

A dollar shortage feeds on itself until a central bank supplies dollars; swap lines are the circuit breaker.

The Global Liquidity Cycle

Liquidity also moves in long waves. Expansions come when central banks ease, credit grows and the dollar weakens; contractions come when policy tightens, credit slows and the dollar rises. The BIS measures part of this through its global liquidity indicators, which track dollar, euro and yen credit to borrowers abroad.

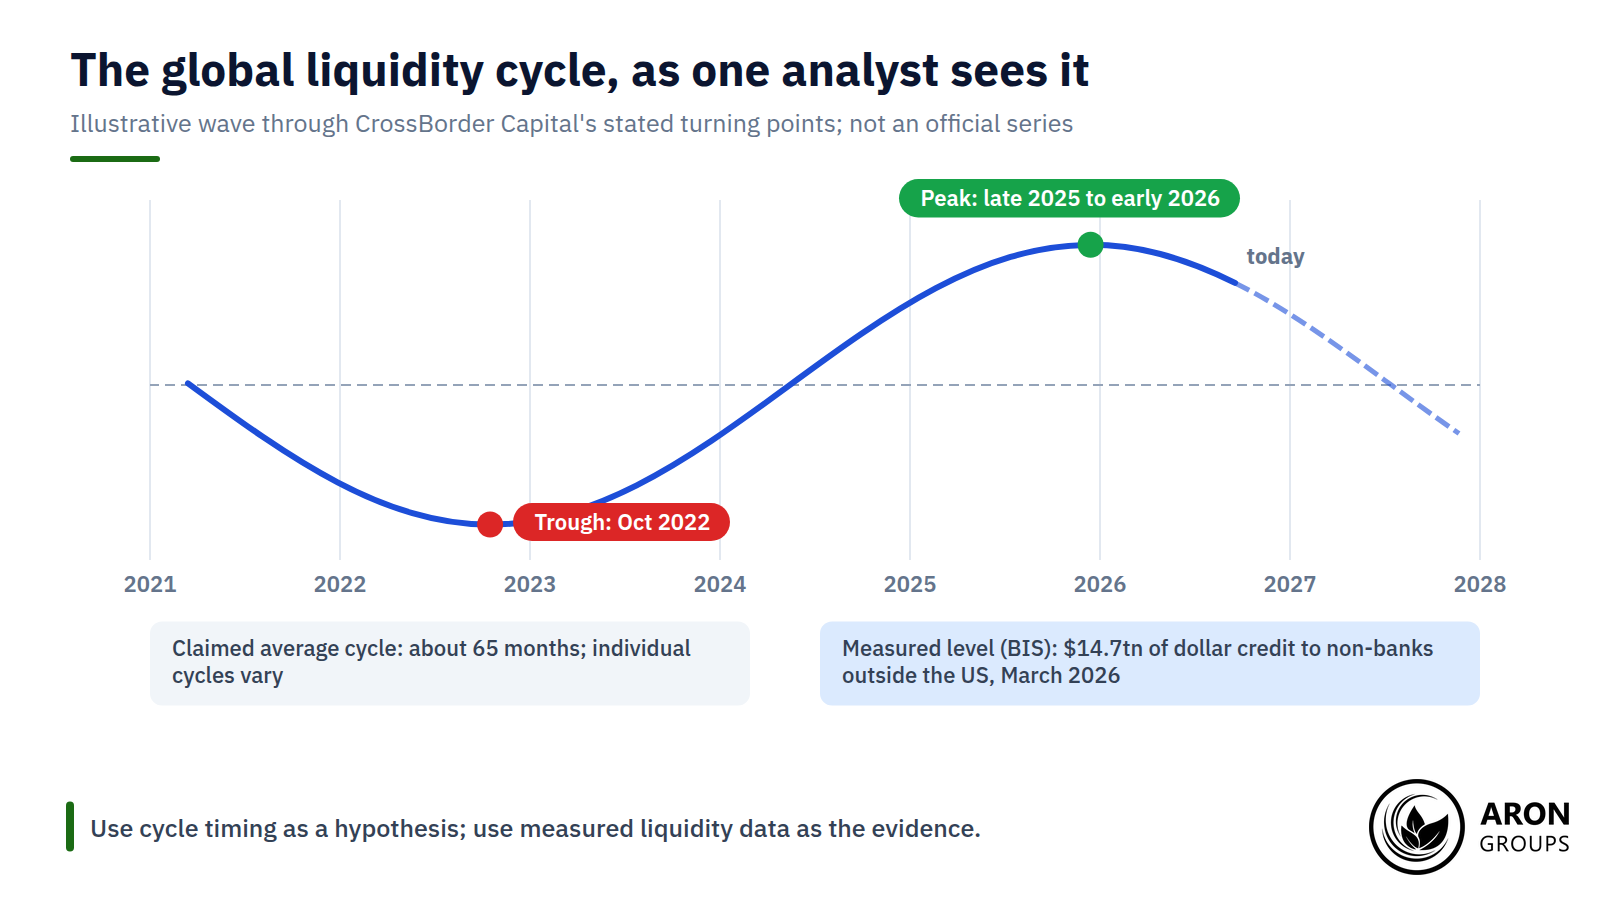
Some analysts go further. Michael Howell of CrossBorder Capital, author of Capital Wars (2020), argues that global liquidity runs in a cycle averaging about 65 months, or five to six years. He links the cycle to the refinancing of world debt. In a December 2025 interview he placed the last trough in October 2022 and the peak around late 2025 or early 2026.

That is one firm’s proprietary model rather than an official measure, so treat its timing as a hypothesis, not a schedule. The measured data, such as the BIS credit figures and the Fed’s weekly balance sheet, remain the evidence.

An illustrative liquidity wave through CrossBorder Capital's stated turning points; official data measure the level, not the cycle.

Why Gold and Crypto Care

Gold and bitcoin pay no interest, so their appeal rises when money is cheap and plentiful and falls when funding tightens. Among the forces that determine the bitcoin price, liquidity is one of the most studied. One analysis found bitcoin moved in the same direction as global money supply in 83% of 12-month periods between 2013 and 2024. Over six-month windows the link was much weaker.

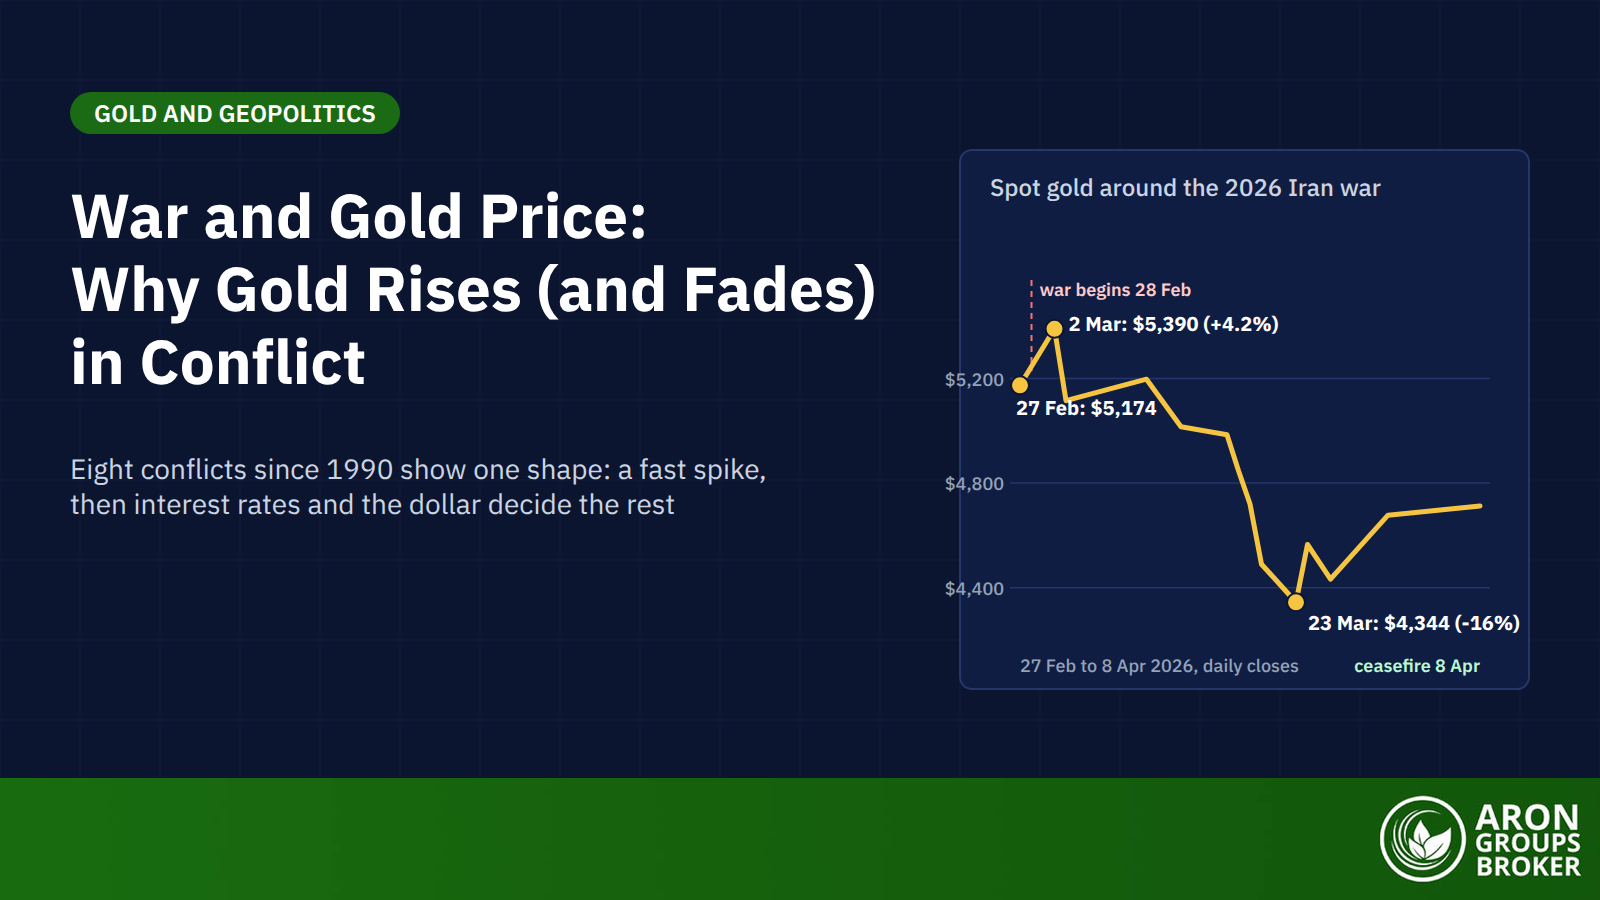
The 2025 to 2026 swings show both sides. Bitcoin hit a record $126,198 in October 2025, fell to about $57,000 in June 2026 and was back above $80,000 in late August, moves that help explain why cryptocurrencies are so volatile. Gold fell 11.8% in March 2026 amid cross-asset deleveraging, when even Turkey’s central bank used gold swaps to raise liquidity.

Gold also has a structural support in central-bank buying linked to de-dollarisation, which can keep it firmer than liquidity alone would suggest. For traders, liquidity is a useful backdrop for XAU/USD and crypto, not a signal to buy on its own.

Q: Does rising net liquidity mean I should buy gold or bitcoin?
A: Not by itself. Liquidity sets the backdrop over months, but prices also respond to real yields, the dollar and positioning, and the correlation breaks down over short windows. Use it to judge whether the tide is with you, then use price action and risk limits to time trades.

The Honest Limits of Liquidity Analysis

Liquidity is one of the most powerful forces in markets, but it is easy to over-read. Keep three limits in mind.

A Proxy, Not an Official Measure

Net liquidity is a practitioner’s shortcut. It ignores bank lending, the offshore dollar system and other central banks, and small choices, such as which TGA series you use, can move it by more than $100 billion.

Correlation Is Not a Timer

The relationships between liquidity, gold and crypto are noisy and shift over time. Rates, earnings, the dollar and sentiment all matter too, so prices can rise while liquidity drains and fall while it expands. In March 2026 gold fell 11.8% even though the Fed was still adding reserves through bill purchases, because the oil shock and a stronger dollar dominated. Liquidity tells you about the backdrop over months, not the next move.

Credit Where It Is Due

The concept of global liquidity was set out by central bankers at the BIS in 2011, and the net liquidity formula is common market practice rather than any one analyst’s invention. Popular liquidity indices and cycle models are proprietary and can disagree, so compare sources before acting on any of them.

Where Aron Groups Fits

Aron Groups offers the markets where the liquidity tide shows up first, including major forex pairs, gold and crypto CFDs, through MetaTrader 5. Pairing a liquidity view with sound forex fundamental analysis helps you judge whether the backdrop supports a trade before you look for an entry.

Leverage magnifies every liquidity-driven move, and crypto CFDs can swing sharply when funding tightens. A Nano account lets you trade very small sizes while you test how liquidity signals behave in real markets.

Conclusion

Dollar liquidity is the macro tide beneath almost every market. When the Fed’s balance sheet grows, the Treasury spends down its cash and the reverse repo facility empties, more dollars reach investors and risk assets tend to benefit. When those flows reverse, the dollar strengthens and leveraged positions come under pressure.

Measure the tide with net liquidity, watch offshore dollar stress through funding markets and remember the limits: liquidity tells you the direction of the current, not when the next wave breaks.

In late 2026 the signals are mixed. QT is over and the balance sheet has grown since December 2025, but reserve purchases are paused, the Treasury holds close to $950 billion in cash and the Fed is raising rates. That combination argues for caution rather than for betting on a strong liquidity tailwind.

Frequently Asked Questions

Short answers to common questions about dollar and global liquidity.

What is global liquidity?

Global liquidity is the ease of financing in global financial markets, the total flow of money and credit across borders. The BIS tracks it through foreign-currency credit, which included $14.7 trillion of dollar credit to non-banks outside the US in March 2026.

How do you calculate Fed net liquidity?

Take the Fed’s total assets (FRED: WALCL), subtract the Treasury General Account (WDTGAL) and subtract the overnight reverse repo balance (RRPONTSYD, converted from billions to millions). On 23 September 2026 the result was about $5.8 trillion.

Does rising liquidity always lift bitcoin and gold?

No. Both have tended to benefit from expanding liquidity over long periods, but the link is loose over weeks and months, and rates, the dollar and positioning can override it.

What is a dollar shortage?

A dollar shortage happens when borrowers outside the US cannot obtain the dollars they need to repay or roll over debts. It pushes the dollar up and other assets down until central banks supply dollars, usually through Fed swap lines.

Continue Reading
not-found
calendar 12 October 2026
Rate this article

Leave a Reply

Your email address will not be published. Required fields are marked *

No thanks