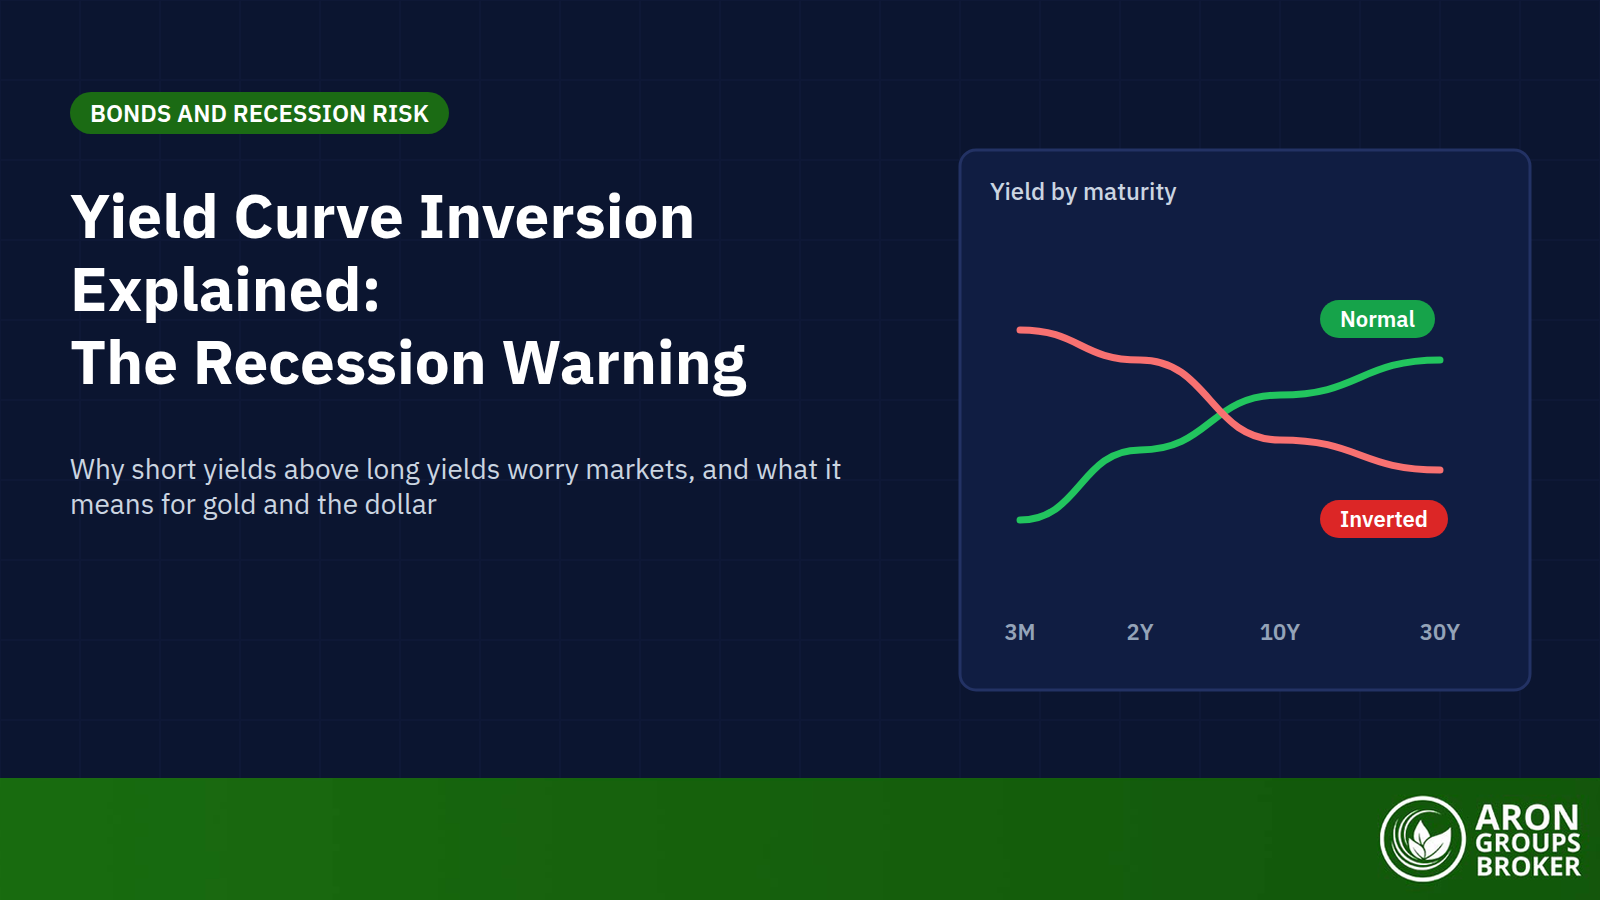

A yield curve inversion happens when short-term government bond yields rise above long-term yields, so the yield curve slopes down instead of up. It is the bond market’s most famous recession warning, because an inverted yield curve says investors expect interest rates and growth to fall. In the United States it has preceded almost every recession since the 1950s, usually by six to 24 months.
The signal was tested hard between 2022 and 2024. The gap between 10-year and 2-year Treasury yields stayed negative for a record 783 days, yet by September 2026 no US recession had followed. With the Fed hiking again and the curve flattening, knowing what the signal can and cannot tell you matters for anyone trading the dollar or gold.
This guide explains what an inverted yield curve means, why it forms, which spread to watch and how reliable its recession record really is. It also covers the steepening trap most explanations miss and what the evidence says about gold and the dollar after past inversions.
- A yield curve inversion means short-term yields exceed long-term yields; the 10-year minus 2-year Treasury spread is the most quoted gauge.
- An inverted curve preceded all nine US recessions from 1955 to 2018, with one false signal in the mid-1960s, usually six to 24 months ahead.
- The 2022 to 2024 inversion was the longest on record, and as of September 2026 no recession had followed.
- Recessions have often started after the curve un-inverts, so a rapid re-steepening can be a bigger warning than the inversion itself.
- The curve is a macro backdrop, not a trade signal: gold and the dollar have moved both ways after past inversions.
What Is a Yield Curve Inversion?
A yield curve plots the yields of bonds with the same credit quality, usually US Treasuries, against their maturities, from three months to 30 years. Normally it slopes upwards, because investors demand more yield to lock money away for longer and to carry more interest rate risk. When short-term yields climb above long-term yields, the curve inverts.
Risk Disclosure
Trading forex and CFDs carries a high level of risk and can result in the loss of all your capital. This content is educational and is not investment advice. Never risk money you cannot afford to lose.
Normal, Flat and Inverted Curves
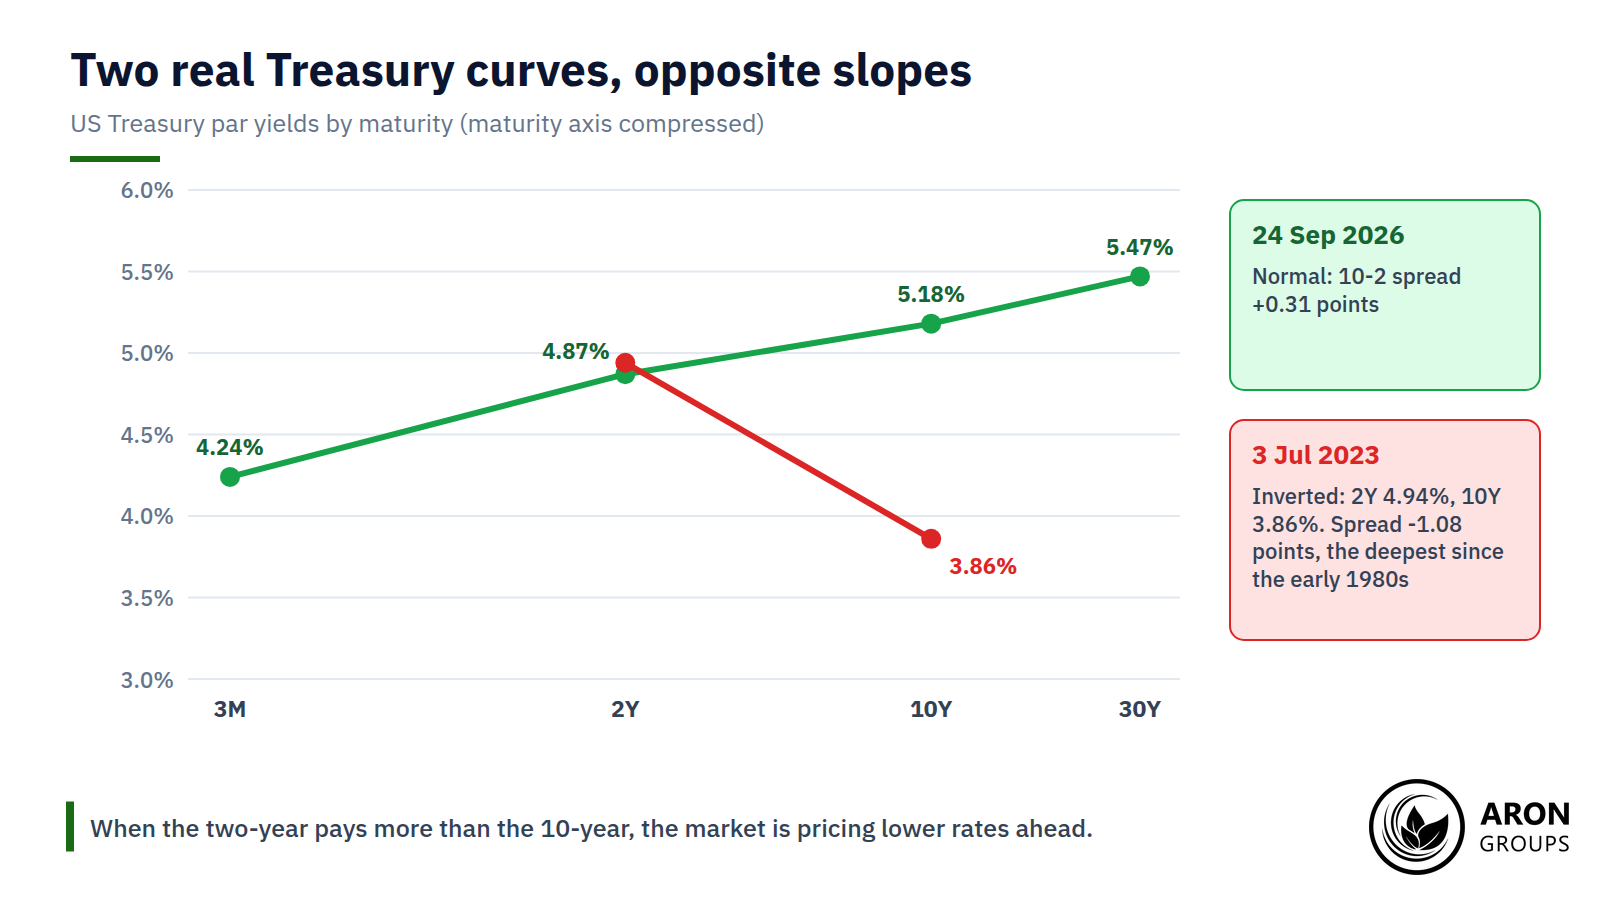
A normal curve rises with maturity, a flat curve shows little difference between short and long yields, and an inverted curve falls. The short end is made up of Treasury bills and notes, and the long end of 10-year notes and 30-year bonds. Longer bonds lose more value when rates rise, which is why they usually pay more.
On 24 September 2026 the curve was normal: three-month bills yielded 4.24%, two-year notes 4.87% and 10-year notes 5.18%. On 3 July 2023 it was deeply inverted, with the two-year note at 4.94% and the 10-year at 3.86%.
What Does an Inverted Yield Curve Mean?
An inverted yield curve means bond investors expect short-term interest rates to be lower in future than they are today. Usually that is because they expect the economy to slow and the central bank to cut. It is a forecast embedded in prices, and like any forecast it can be wrong.
In July 2023, for example, investors accepted more than a percentage point less a year to lock money away for ten years rather than two. That only makes sense if you expect short-term rates to fall well below 4.94% over the decade.
Why the Yield Curve Inverts
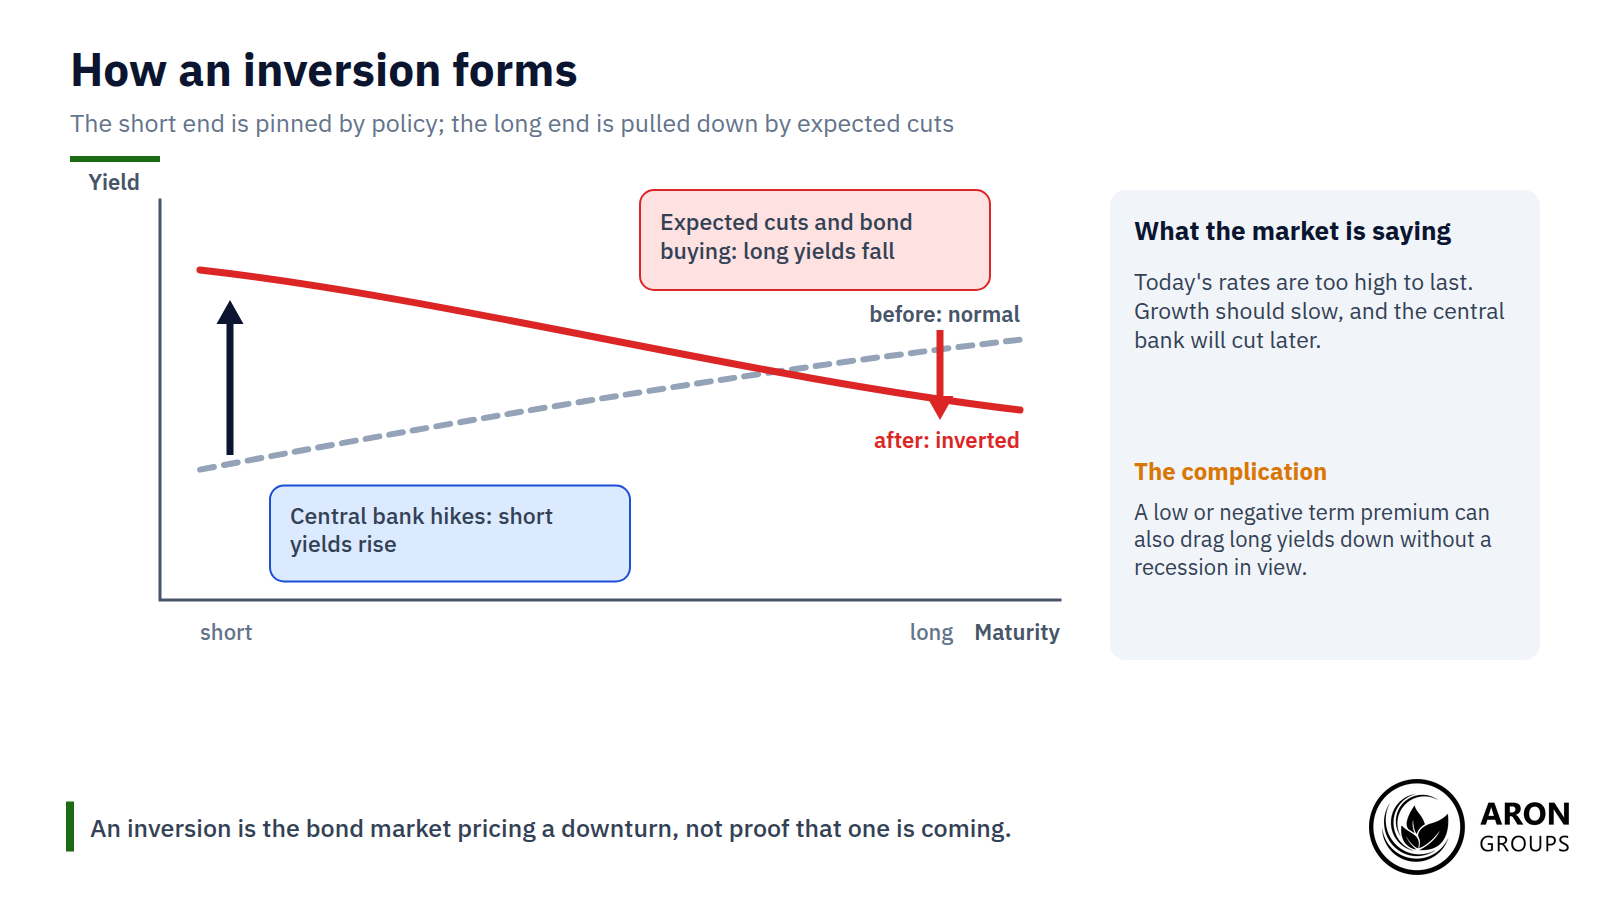
A long-term yield is roughly the average of the short-term rates investors expect over the life of the bond, plus extra compensation for tying up money, known as the term premium. When the Federal Reserve raises the federal funds rate to fight inflation, short-term yields rise with it.
If investors believe those high rates will slow the economy and force cuts later, they buy longer-dated bonds, pushing long yields down. The result is a curve whose short end is pinned high by current policy while the long end is pulled down by expected easing. The deeper the inversion, the more aggressively markets expect rates to fall.
The Term Premium Complication
The term premium can distort the signal. When it is unusually low or negative, for example after years of central-bank bond buying, long yields can sit below short yields without the market expecting a recession. That possibility sits at the heart of every ‘this time is different’ debate.
Bear Flattening, Bull Steepening and Other Curve Moves
Traders describe curve moves by which end leads. A bear flattener happens when short yields rise faster than long yields, as in September 2026, when the two-year yield climbed 46 basis points in three weeks against 32 for the 10-year. A bull steepener happens when short yields fall faster, usually because markets expect rate cuts, and it is the pattern that has often come just before recessions.
Bear steepening, with long yields leading higher, tends to reflect inflation or fiscal worries. Bull flattening reflects falling expectations for long-term growth or inflation.
Which Spread to Watch: 10-2, 10-Year Minus 3-Month and Beyond
There is no single official measure. Markets quote the 10-year minus 2-year spread most often, while researchers disagree about which spread predicts best. The table compares the main gauges and how each behaved in the latest cycle.
| Spread | FRED code | Who favours it | 2022 to 2024 episode | 24 Sep 2026 |
|---|---|---|---|---|
| 10-year minus 2-year | T10Y2Y | Markets and the media | Inverted 6 Jul 2022 to 26 Aug 2024; low of -1.08 points | +0.31 points |
| 10-year minus 3-month | T10Y3M | New York Fed recession model | Inverted 25 Oct 2022 to 12 Dec 2024; low of -1.89 points | +0.94 points |
| Near-term forward spread | Not on FRED | Fed Board economists Engstrom and Sharpe | Above 2 points in March 2022, when the 10-2 was near 0.25 | Not published daily |
The main yield curve spreads compared. Sources: FRED, Federal Reserve Board research and US Treasury par yields for 24 September 2026.
One common claim needs correcting: the Fed has no official preferred spread. The New York Fed’s recession model uses the 10-year minus 3-month gap, while Fed Board economists have argued for a near-term forward spread. In March 2022 Chair Jerome Powell said the first 18 months of the curve carry most of the predictive power.
Why the 10-2 Dominates the Headlines
The 10-2 dominates because both yields are liquid, quoted continuously and tied to clear expectations: the two-year to the next few Fed moves and the 10-year to long-run growth and inflation. The 10-year minus 3-month spread reacts more directly to the current policy rate, so it inverted later in 2022 and stayed inverted longer, into December 2024.
The Recession Record: Strong, Early and Imperfect
The inverted curve earns its reputation. San Francisco Fed research found that an inversion of the 10-year minus 1-year spread preceded all nine US recessions between 1955 and 2018, with one false positive in the mid-1960s. Earlier New York Fed work found the 10-year minus 3-month spread turned negative before every recession from 1968 to 2006.
False Signals and Near Misses
The record is not flawless. In 1966 the curve inverted and growth slowed without a recession. In 1998 both spreads dipped below zero briefly, around the Asian and Russian crises, yet no recession followed within two years. Both episodes suggest that brief, shallow inversions deserve less weight than deep and persistent ones.
The Lag: Six to 24 Months
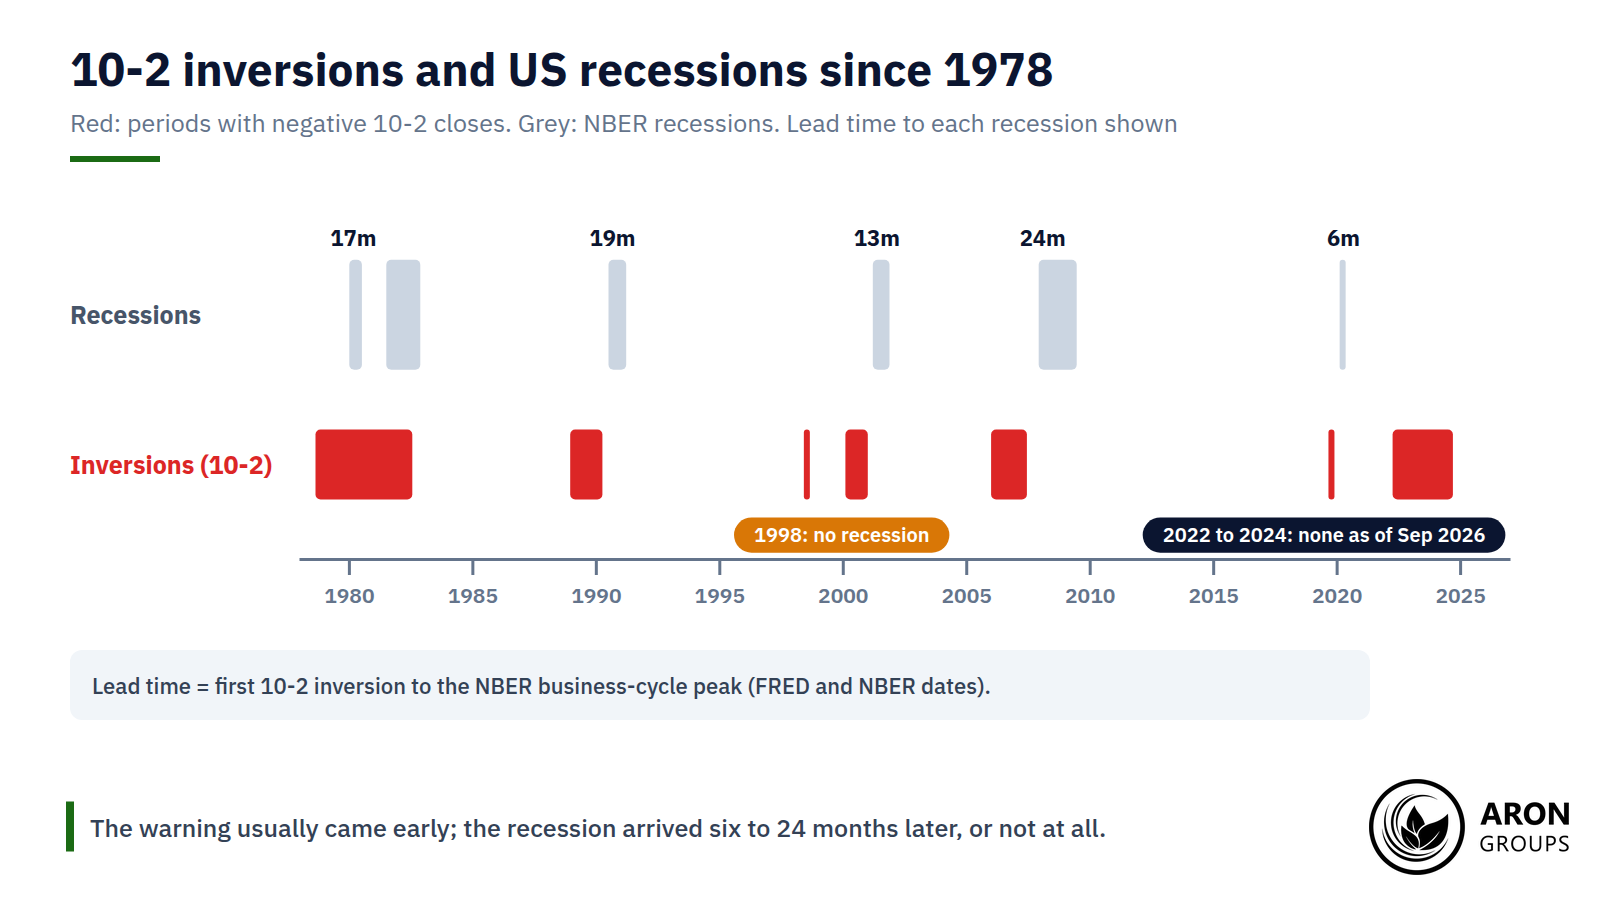
The warning comes early. Measured from the first 10-2 inversion to the start of the recession, lead times ranged widely. They were 17 months before 1980, 19 months before 1990, 13 months before 2001, 24 months before 2007 and six months before 2020. That spread of timing is why an inversion is an alarm, not a clock.
The Steepening Trap
Counter-intuitively, recessions have usually begun after the curve turned positive again. Before the 1990, 2001, 2007 and 2020 recessions, both main spreads had un-inverted up to seven months before the downturn started. Typically the Fed was already cutting quickly as the economy weakened.
A sharp re-steepening driven by falling short-term yields can therefore be a bigger red flag than the inversion itself. It suggests the market has moved from expecting a slowdown to pricing an emergency.
The 2022 to 2024 Inversion: Longest on Record, No Recession Yet
The most recent episode broke every record. The 10-2 spread first closed below zero on 1 April 2022 and stayed negative from 6 July 2022 until 26 August 2024, a run of 783 calendar days. That was the longest in FRED’s daily data since 1976, and the 10-year minus 3-month spread stayed inverted from October 2022 to December 2024.
Yet as of September 2026, the National Bureau of Economic Research, which dates US business cycles, had not declared a recession since the brief 2020 downturn. Gross domestic product (GDP) shrank in just one quarter, the first of 2025, then grew again, rising at a 1.5% annualised rate in the second quarter of 2026.
The curve is moving again. In mid-September 2026 the 10-year yield closed above 5% for the first time since 2007. The 10-2 spread narrowed from an average of 0.68 points in January to about 0.3 points as the Fed resumed hiking. If the Fed keeps tightening while long yields stall, a fresh inversion is possible.
Why the Signal Has Not Worked (Yet)
Several explanations compete. Years of quantitative easing compressed the term premium, which may have exaggerated the inversion. Fed staff estimated that its bond holdings were holding down the 10-year term premium by about one percentage point in 2016. Research at the Bank for International Settlements also argues that unconventional policy can blunt the curve’s signal.
Duke University economist Campbell Harvey, whose research first popularised the signal, argued that firms and households cut costs pre-emptively because this was the most anticipated recession in history. A strong labour market and heavy government spending also cushioned the economy.
None of this proves the signal is broken. Ben Bernanke made a similar term-premium argument in 2006, and a recession began in December 2007. In September 2026 the New York Fed’s model put the probability of a recession within 12 months at about 14%.
Q: Should I sell risk assets as soon as the curve inverts?
A: History says that has usually been costly. Recessions have arrived six to 24 months after the first inversion, and equities have often kept rising for much of that time. The curve is better used to lower leverage gradually and to watch for re-steepening than as a single exit signal.
What an Inversion Means for Gold, the Dollar and Your Trading
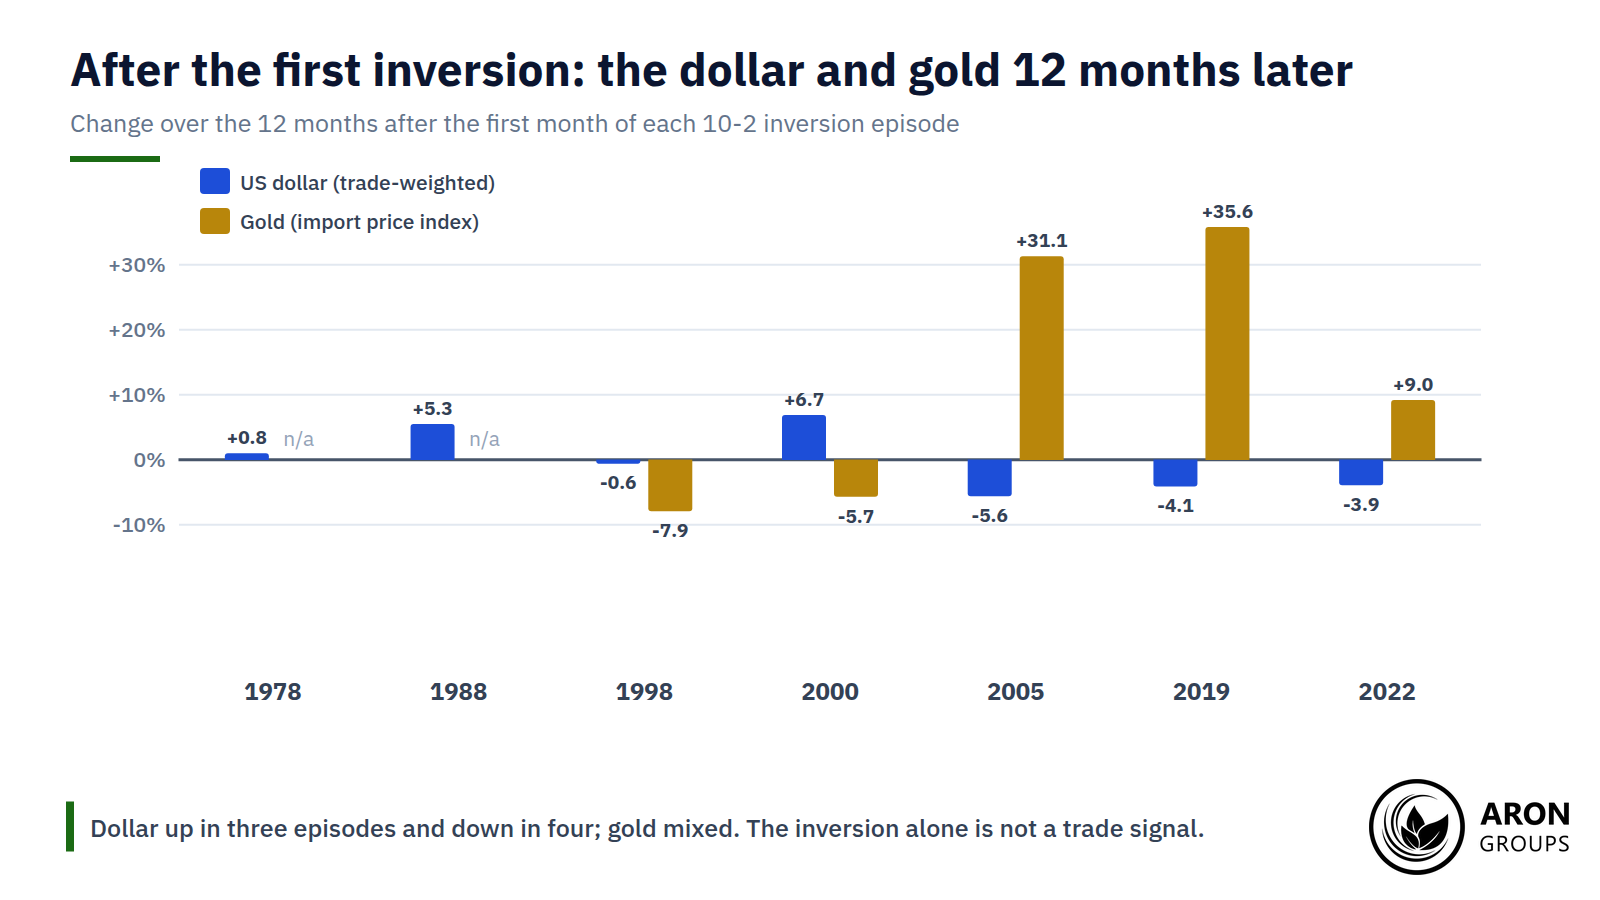
A popular rule of thumb says an inverted curve is bullish for gold and bearish for the dollar, because it points to future rate cuts. The historical record is more mixed. In the 12 months after the first inversion month of each episode, the trade-weighted dollar rose in three cases and fell in four. The drivers of the US dollar simply changed from cycle to cycle.
Gold was just as inconsistent. A gold price index fell after the 1998 and 2000 inversions and rose strongly after the 2005 and 2019 inversions. The difference came from what followed: how fast the Fed cut, where real yields went and whether a crisis arrived.
How to Use It: Context, Not a Trigger
Treat the curve as a macro backdrop that shapes how you size and hold positions:
- Watch the level: deeper and longer inversions have historically raised the odds of recession, as the New York Fed’s model shows.
- Watch the drivers: an inversion caused by rising short-term rates means something different from one caused by falling long-term yields.
- Watch the un-inversion: a fast re-steepening led by falling two-year yields has often come just before recessions.
- Watch the Fed and the data: inflation, payrolls and the Fed’s reaction decide what the curve does next.
For gold and currency traders, the curve is most useful for framing risk, for example trimming leverage as recession odds climb, rather than for timing entries. For currency pairs, the front end also feeds rate differentials: when US two-year yields rise relative to those abroad, the dollar tends to benefit.
Mini Example: Turning a Spread Into a Recession Probability
The New York Fed converts the monthly average of the 10-year minus 3-month spread into a 12-month recession probability. With the August 2026 average spread of +0.87 points, its model gave about 14%.
The same formula implies roughly 30% if the spread falls to zero and about 54% at -1.0 point. The shape of the curve matters more than any single day’s reading, because the model uses monthly averages.
The Honest Limits of the Yield Curve Signal
The yield curve is a powerful indicator, but it has three weaknesses. The lag is long and variable, it has produced false or early signals such as the brief 1998 inversion, and structural changes like quantitative easing may have altered what the curve means. Price-insensitive buyers, such as foreign reserve managers and pension funds, can also hold long yields down for reasons unrelated to growth expectations.
It also says nothing about how deep an economic crisis would be or how markets will price it along the way. Read it alongside inflation, the labour market and whether the Fed is turning hawkish, not in isolation.
Where Aron Groups Fits
Aron Groups gives traders access to the markets where yield-curve shifts show up, including major currency pairs and gold, through MetaTrader 5. Bond-market moves often lead the dollar and gold, so an economic calendar that shows inflation data, jobs reports and Fed meetings helps you prepare for them.
Macro signals like the yield curve work over months, so size positions for the swings in between. A demo account lets you test how your strategy behaves around rate decisions before you trade live. Gold traders in particular can pair the curve with their XAU/USD charts, since the rate expectations behind an inversion also feed into real yields, one of gold’s main drivers.
Conclusion
A yield curve inversion is the bond market’s way of saying that today’s interest rates are too high to last. It has preceded almost every US recession since the 1950s, but with a long and variable lag, and the record-breaking 2022 to 2024 inversion has not yet been followed by one.
Use the curve as context: watch the depth of any inversion, the drivers behind it and especially the re-steepening that has often come just before downturns. Then let inflation, jobs and the Fed decide how you trade. In late 2026, with the curve flattening again under a hiking Fed, the next inversion or re-steepening deserves close attention.
Frequently Asked Questions
Short answers to the questions traders ask most about inverted yield curves.
What does an inverted yield curve mean?
It means short-term government bonds yield more than long-term ones. Investors expect interest rates to fall because they expect growth to slow, which is why an inversion is watched as a recession warning.
Is the yield curve inverted now?
No. On 24 September 2026 the 10-2 spread was about +0.31 points and the 10-year minus 3-month spread about +0.94 points. The curve has been flattening since the Fed resumed hiking in September, so watch whether the 10-2 turns negative again.
How long after an inversion does a recession start?
Historically between six and 24 months after the first inversion, and often after the curve has already turned positive again. The 2022 to 2024 inversion is the exception so far, with no recession by September 2026.
What is the 10-2 year Treasury yield spread?
It is the 10-year Treasury yield minus the 2-year Treasury yield, published daily on FRED as T10Y2Y. A negative value means the curve is inverted between those two maturities.