
icon icon Home
icon icon Accounts
icon icon Quick start
icon icon Symbols

Ulcer Index Explained: Drawdown Depth, Duration, and the Martin Ratio

Author
Abe Cofnas
Abe Cofnas
calendar Last update: 22 November 2026
watch Reading time: 9 min

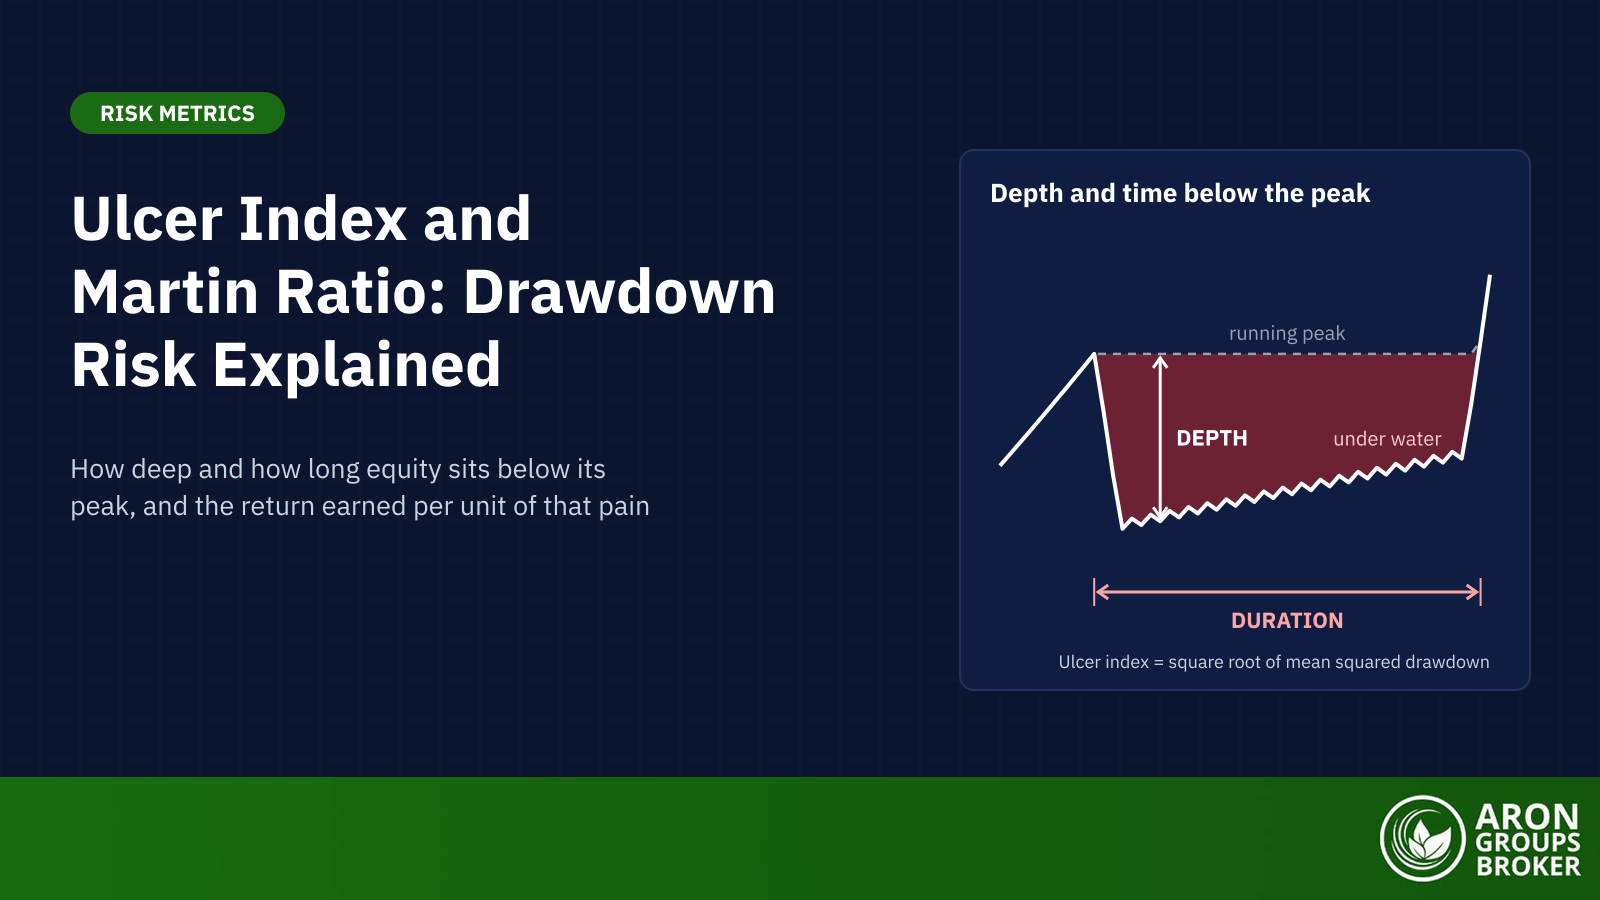
The ulcer index is a downside risk measure of how far an investment falls below its previous peak and how long it stays there. Peter G. Martin developed it in 1987. It is the root-mean-square of percentage drawdowns: zero at a new high, and higher the deeper and longer the slump.

Equity markets supplied a fresh example in 2026. According to Associated Press market reports, the S&P 500 closed at a record 6,978.60 on 27 January 2026. By 30 March it was 9.1% below that high. It did not set a new record until 15 April, 78 days after the January peak. A maximum drawdown figure captures the depth of that slide; the ulcer index also counts the roughly 11 weeks it lasted.

This guide covers the ulcer index definition and formula, a worked example on ten weekly closes and why time under water matters. It then explains the Martin ratio, compares the ulcer index with the Sharpe, Sortino and Calmar ratios, and sets out its limits.

bookmark
Key Takeaways
  • The ulcer index measures the depth and duration of drawdowns from running peaks. A lower value means shallower, shorter drawdowns.
  • It is the root-mean-square of percentage drawdowns. Squaring makes a 20% drawdown count four times as much as a 10% one.
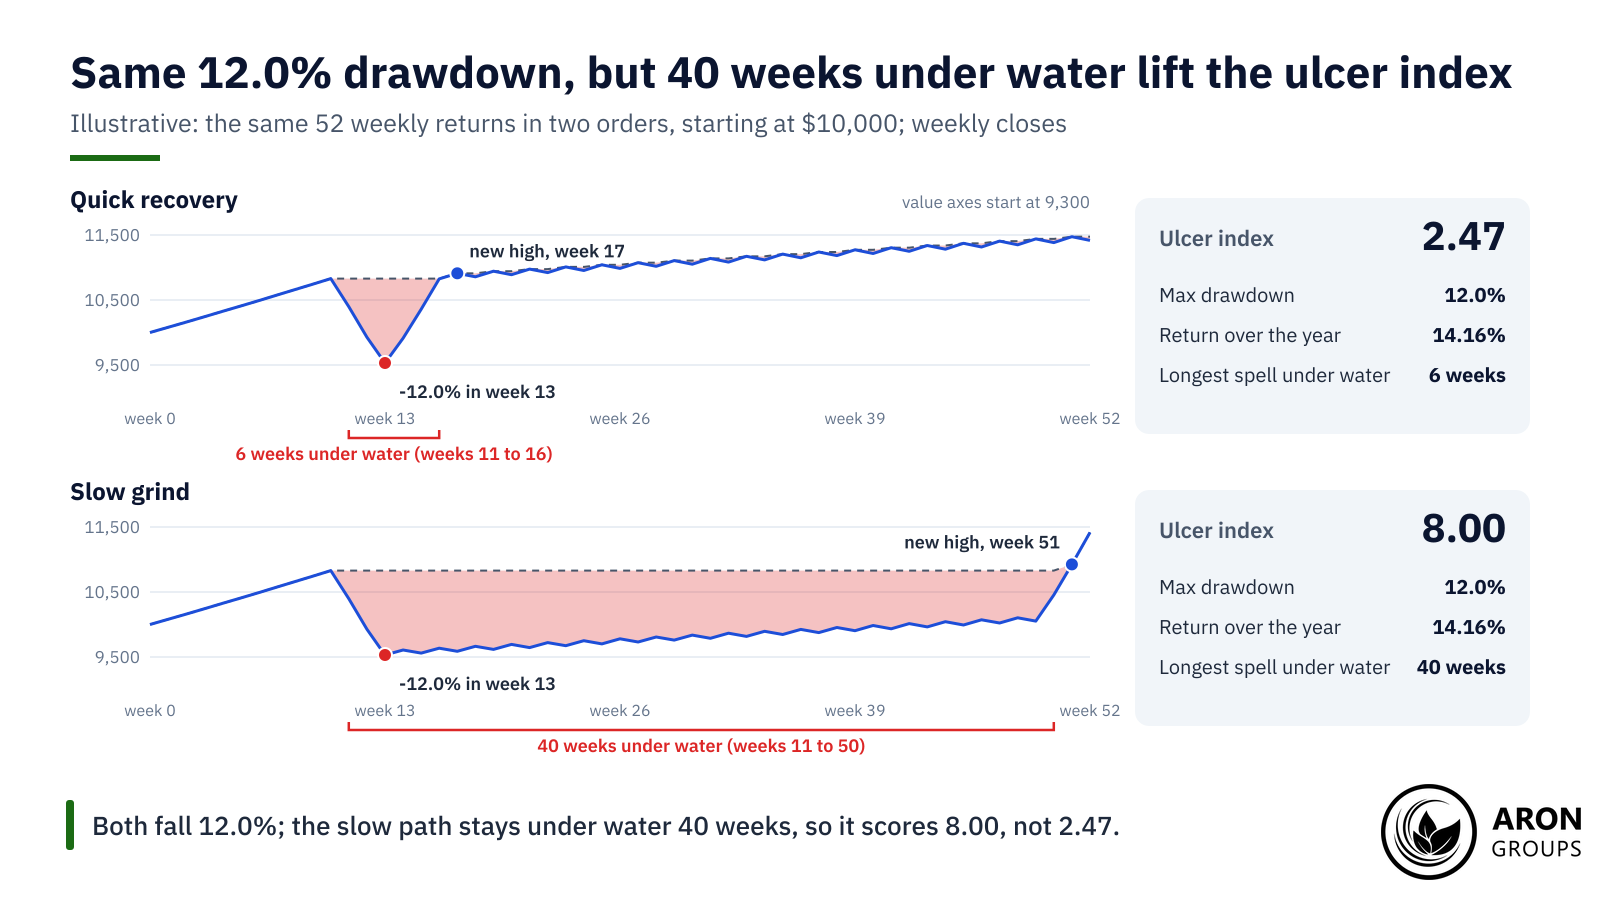
  • Two illustrative paths with identical returns and a 12.0% maximum drawdown score 2.47 and 8.00. The second stays under water for 40 weeks.
  • The Martin ratio, also called the Ulcer Performance Index, divides excess return by the ulcer index. Higher values mean more return per unit of drawdown pain.
  • Bands such as 5 and 10 are charting conventions, not Martin’s rules. Readings depend on the asset, the data frequency and the window.

What Is the Ulcer Index?

The ulcer index (UI) is a downside risk measure built from drawdowns, the percentage falls from the highest value reached so far. Martin’s Ulcer Index page defines UI as “a measure of the depth and duration of drawdowns in prices from earlier highs”. Gains above an old peak do not raise it, so a curve that rises every period scores zero.

sms-star

Risk Disclosure
Trading forex and CFDs carries a high level of risk and can result in the loss of all your capital. This content is educational and is not investment advice. Never risk money you cannot afford to lose.
Peter Martin and the Name

Peter G. Martin writes on his website that he developed the ulcer index in 1987. He first described it in The Investor’s Guide to Fidelity Funds, written with Byron McCann and published by John Wiley & Sons in 1989. Some sources, StockCharts among them, credit both authors with the 1987 index. The name alludes to the stress of watching savings stay below an old high, though Martin’s page does not explain it.

Depth and Duration: the Two Things It Scores

Depth is how far value sits below its running peak, the highest close so far. Duration is how many periods it stays there. Martin’s page puts the link plainly: the greater a drawdown and the longer the recovery to earlier highs, the higher the UI.

Depth matters because losses compound. A 10% drawdown needs an 11.1% gain to recover, and a 50% drawdown needs 100%. Our guide to capital preservation tabulates this asymmetry. The ulcer index, through squaring, also gives deep falls an outsized weight.

The Ulcer Index Formula

The ulcer index formula has three steps. Each close’s percentage drawdown, R, is 100 × close ÷ running peak, minus 100, which is zero at a new high. The squared drawdowns are averaged over all N closes, zeros included. The ulcer index is the square root of that mean: UI = √(ΣR² ÷ N).

Martin’s pseudo-code divides by every period, including those at a new high. He calls weekly price data a robust choice, accepts daily data and strongly discourages quarterly or longer intervals.

Mini Example: The Ulcer Index on Ten Weekly Closes

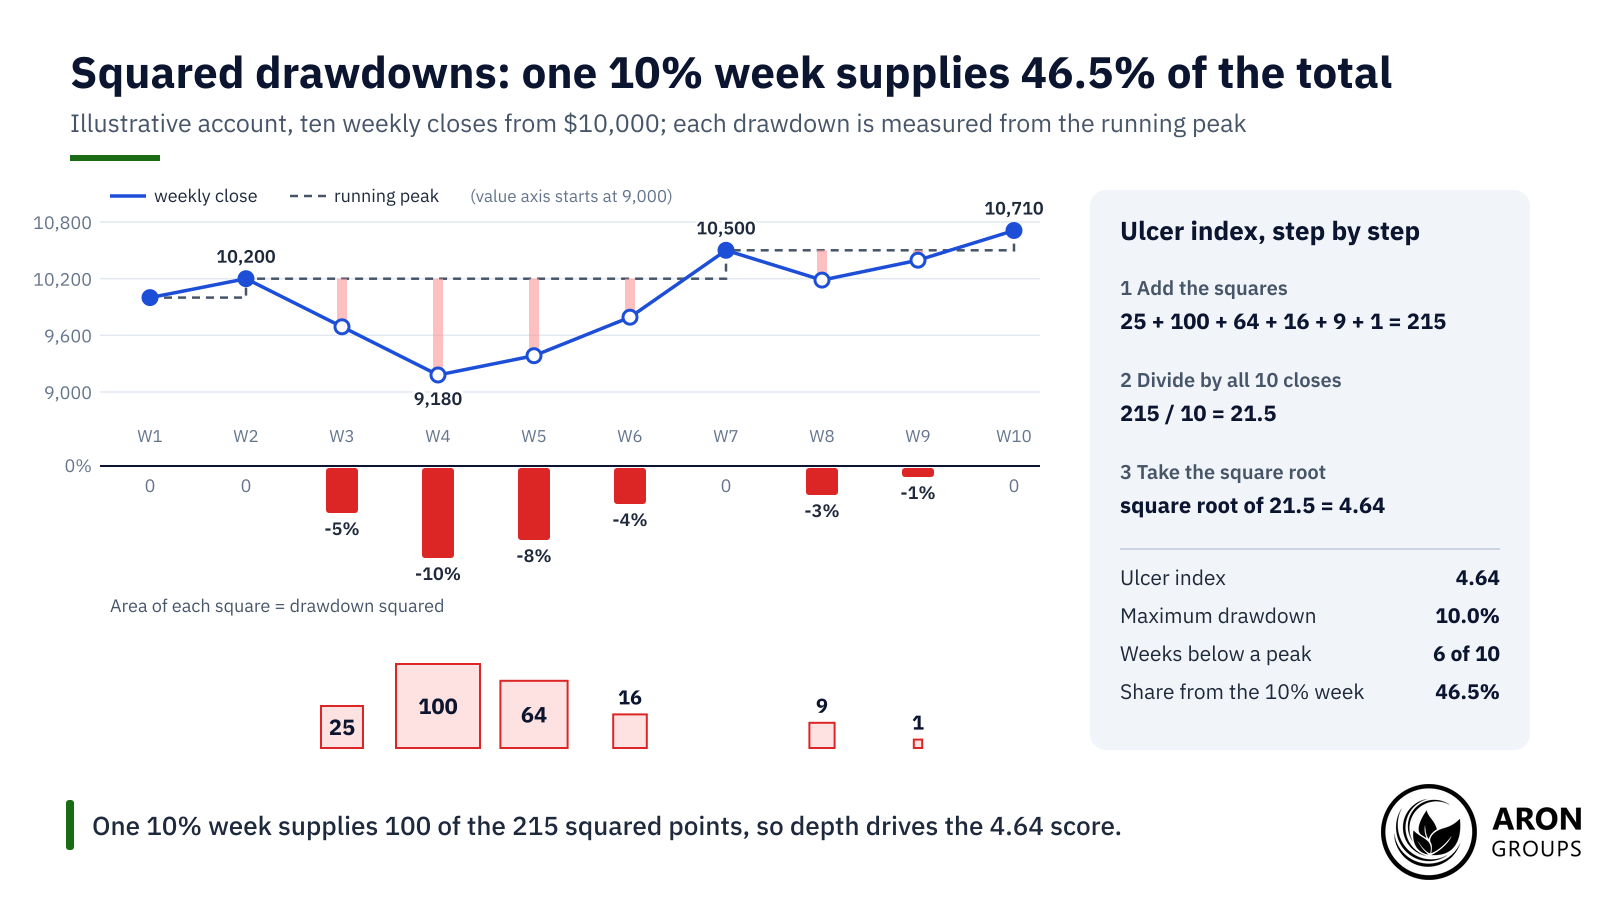
An illustrative account starts at $10,000 and is valued at ten weekly closes. It peaks at 10,200 in week 2, falls to 9,180 by week 4 and sets a new high of 10,500 in week 7. The table shows each step.

WeekClose ($)Running peak ($)DrawdownSquared
Week 110,00010,0000%0
Week 210,20010,2000%0
Week 39,69010,200-5%25
Week 49,18010,200-10%100
Week 59,38410,200-8%64
Week 69,79210,200-4%16
Week 710,50010,5000%0
Week 810,18510,500-3%9
Week 910,39510,500-1%1
Week 1010,71010,7100%0
Total215

Illustrative weekly closes; each drawdown is measured from the highest close so far.

The six drawdowns below a peak are 5%, 10%, 8%, 4%, 3% and 1%. Their squares sum to 25 + 100 + 64 + 16 + 9 + 1 = 215. Dividing by all 10 closes gives 21.5, and its square root gives an ulcer index of 4.64.

The maximum drawdown is 10.0%, and the account spends 6 of its 10 weeks below a previous peak. The deepest week supplies 100 of the 215 points, or 46.5%. The four-week slump from week 3 to week 6 supplies 95.3%.

Counting the zeros matters. If the four closes with no drawdown were dropped, the mean would be 215 ÷ 6 = 35.83 and the index 5.99. That version would overstate the stress of an account that spent four of its ten weeks at a peak.

Squaring turns the 10% week into 100 of 215 points, so one deep slump drives the 4.64 score.

Why Squaring Lets Deep Drawdowns Dominate

Squaring is what makes the ulcer index a root-mean-square rather than a plain average of drawdowns. A 20% drawdown adds 400 to the sum and a 10% drawdown adds 100, so the deeper week counts four times as much. Martin notes that squaring penalises large drawdowns proportionately more than small ones.

Martin’s Running Peak vs the 14-Period Default

Charting platforms often use a rolling version instead. StockCharts’ indicator defaults to 14 periods. Each close is compared with the highest close of the last 14 periods, and 14 squared drawdowns are averaged. That 14-period setting is a platform default, not part of Martin’s definition.

The two versions answer different questions. On the slow-grind path described below, a 14-week reading peaks at 10.26 in week 24. By week 39 it reads 0.35, although the account is still 8.5% below its high, because the old peak has left the window. Martin’s full-year figure is 8.00.

Why Drawdown Duration Matters

Drawdown duration is the time equity spends below its last peak, and maximum drawdown ignores it. Two illustrative one-year paths show the effect. Both start at $10,000, use the same 52 weekly returns in a different order and end 14.16% higher. Both fall 12.0% in the three weeks after week 10.

On the quick-recovery path, three strong weeks follow the slide at once and a new high comes in week 17. Its longest spell under water is 6 weeks, and its ulcer index is 2.47. On the slow-grind path, the strong weeks arrive only at the end. It spends 40 weeks under water and scores 8.00.

Same returns and the same 12.0% maximum drawdown, but 40 weeks under water lift the ulcer index from 2.47 to 8.00.

Duration matters especially to people who need their money by a set date. Investor.gov’s beginners’ guide to asset allocation notes that investors with longer time horizons can wait out slow economic cycles and market ups and downs. A shorter horizon leaves less room for a long slump. Behavioural finance adds loss aversion: losses tend to hurt more than equal gains please, and a long slump keeps that pain in view.

Q: Why can two strategies with the same maximum drawdown have different ulcer index values?
A: Maximum drawdown records only the deepest point. The ulcer index adds a squared term for every period below the peak. A slow recovery therefore raises it, even when the deepest point is the same.

Reading Ulcer Index Values

Lower is better: a lower ulcer index means shallower and shorter drawdowns, and zero means none at all. There is no official scale. Bands such as below 5 for low and above 10 for high appear as default inputs in community charting scripts. Martin’s own explanation contains no such bands.

The scale depends on the asset, the data frequency and the window. In Martin’s own test, buy-and-hold in the S&P 500 scored 8.85 over 1940 to 1997. A fixed cut-off of 10 would rate the broad US stock market as close to stressed over that period.

sms-star

Key Point
Ulcer index values are best compared on the same data frequency, window and asset class. A 14-bar daily reading and a full-history weekly figure answer different questions.
The Martin Ratio and the Ulcer Performance Index

The Martin ratio is annual return minus the risk-free rate, divided by the ulcer index. It is the drawdown counterpart of the Sharpe ratio, so it shows return per unit of drawdown pain. Martin’s page says the measure is known as the Ulcer Performance Index (UPI) or Martin ratio. Higher values are better.

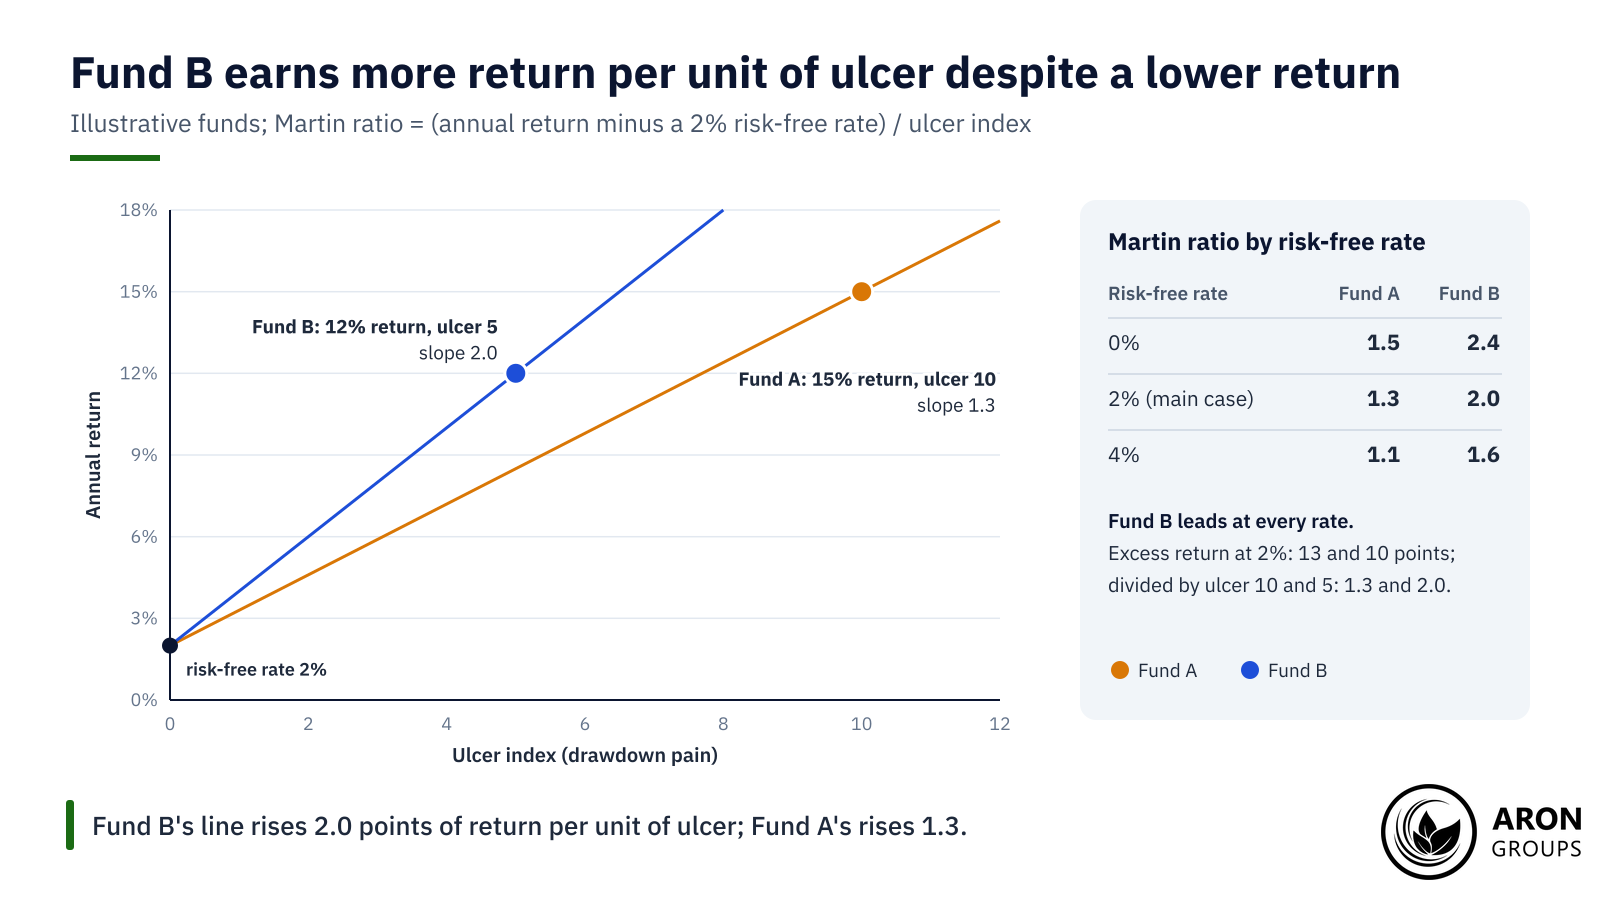
Two hypothetical funds show how the ranking can flip. Fund A returns 15% a year with an ulcer index of 10; Fund B returns 12% with an ulcer index of 5. With an assumed 2% risk-free rate, their excess returns are 13 and 10 points. Divided by 10 and 5, they give Martin ratios of 1.3 for Fund A and 2.0 for Fund B.

Plotted as annual return against the ulcer index, each Martin ratio is the slope of a line from the risk-free rate to the fund. The assumed rate changes the scores but not the order. With no risk-free deduction the ratios are 1.5 and 2.4. At 4%, near the top of the Fed’s 3.75% to 4.00% target range held on 28 October 2026, they are 1.1 and 1.6. Fund B leads in every case.

The Martin ratio is the slope from the risk-free rate: 2.0 for Fund B against 1.3 for Fund A.

Martin’s own test shows the effect on real data. From 1940 to 1997, a simple momentum timing system on the S&P 500 returned 14.79% a year against 12.59% for buy-and-hold, with dividends reinvested. Its ulcer index was 5.14 against 8.85, and its UPI 2.01 against 0.92.

Standard deviation saw the timing system as 18% less risky and its Sharpe ratio as 53% higher. The ulcer index saw 42% less risk and a 119% higher UPI. On Martin’s figures, the ulcer index valued the timing system far more highly than standard deviation did.

Ulcer Index vs Sharpe, Sortino and Calmar Ratios

Each risk-adjusted return measure divides a return by a different idea of risk. The Sharpe ratio, introduced by William Sharpe in 1966 as the reward-to-variability ratio, uses the standard deviation of all returns. The Sortino ratio, named after Frank Sortino, uses only downside deviation below a minimum acceptable return. As the CFA Institute’s Deborah Kidd notes, downside deviation divides the squared shortfalls by all periods, not just those below the target.

The Calmar ratio divides annual return by the maximum drawdown, traditionally over 36 months. Terry Young introduced it in 1991, and its name abbreviates California Managed Accounts Reports. MetaTrader 5’s recovery factor is a cousin: absolute profit divided by the maximum drawdown. Despite its name, it contains no measure of time. Because both keep just the worst fall, very different paths can share a score, as the table shows.

MeasureRisk it divides byWhat it capturesWhat it missesQuick vs slow path
Sharpe ratioStandard deviation of all returnsEvery swing, up or downOrder of returns; treats gains as risk1.04 vs 1.04
Sortino ratioDownside deviation below a targetLosing periods onlyOrder and duration of losses1.56 vs 1.56
Calmar ratioMaximum drawdown, traditionally over 36 monthsThe single worst peak-to-trough fallTime under water and every smaller drawdown1.18 vs 1.18
Recovery factor (MT5)Maximum drawdown, in moneyThe single worst fallTime, despite its name1.09 vs 1.09
Ulcer indexRoot-mean-square of all percentage drawdownsDepth and duration of every drawdownGains above the peak; risks not yet realised2.47 vs 8.00
Martin ratio (UPI)Ulcer indexExcess return per unit of drawdown painThe ulcer index’s blind spots4.92 vs 1.52

Illustrative one-year paths with the same 52 weekly returns; Sharpe, Sortino and Martin use a 2% risk-free rate.

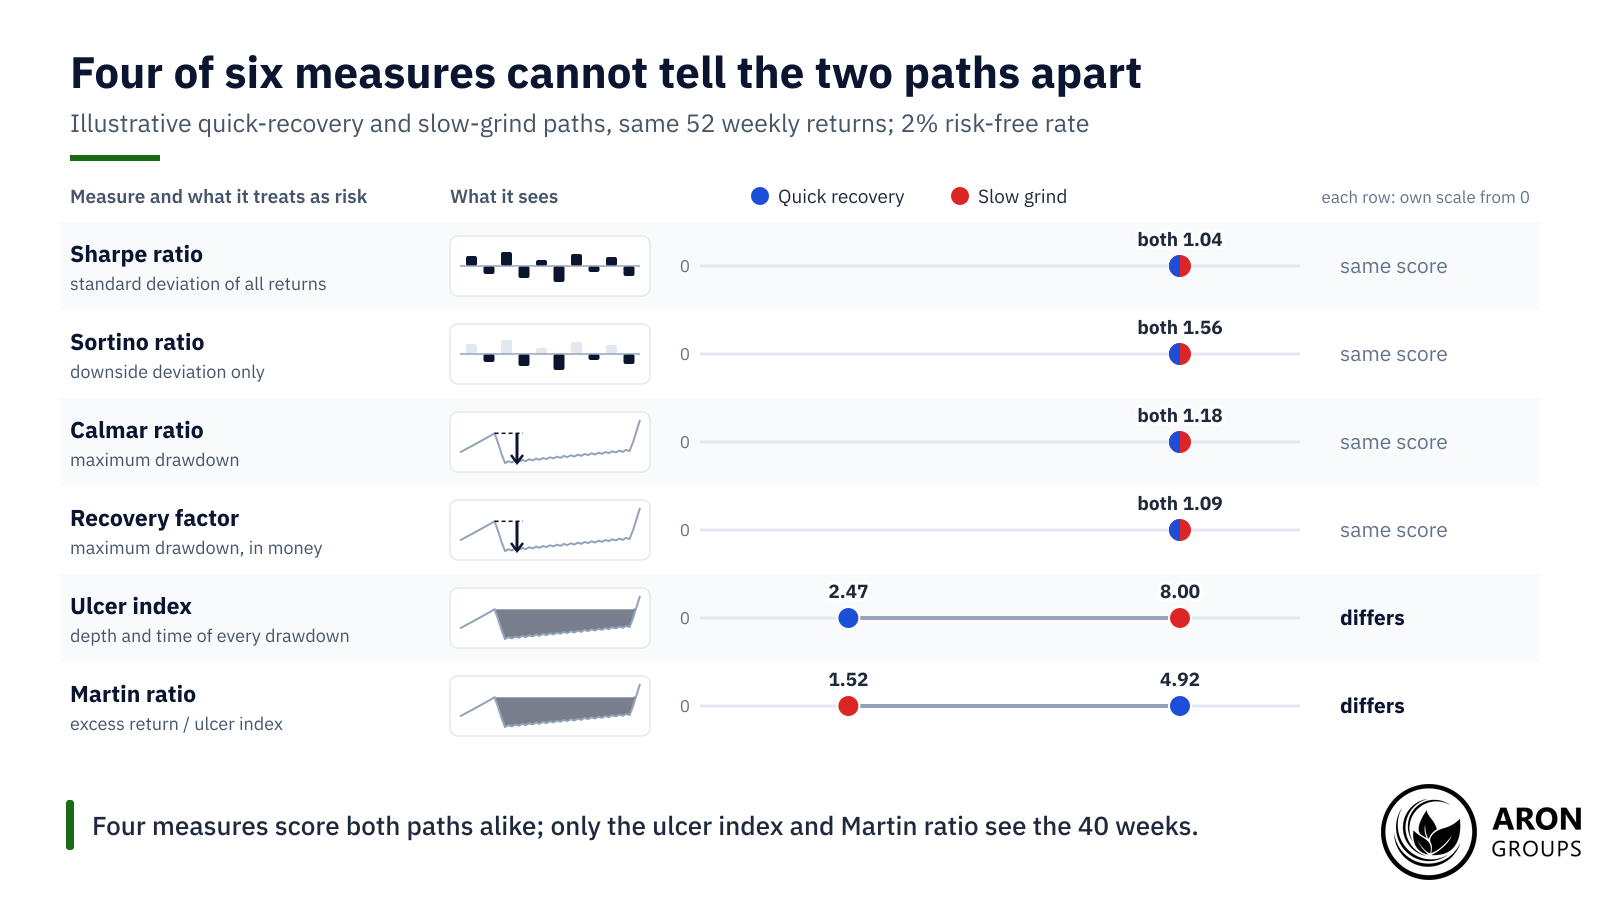
On the two illustrative paths, the Sharpe, Sortino and Calmar ratios and the recovery factor are identical. Each ignores the order of returns or everything except the single worst fall. The ulcer index sees 40 weeks of slow grind, and the Martin ratio drops from 4.92 to 1.52.

Four measures score the quick and slow paths alike; the ulcer index and Martin ratio register the 40 weeks under water.

US regulators already ask for depth in managed futures. A CFTC checklist for commodity trading advisers’ disclosure documents covers it. It asks whether the document shows the worst peak-to-valley drawdown of the most recent five calendar years and year to date. The ulcer index adds what that single figure leaves out: how long the slump lasted.

How Traders Use the Ulcer Index

The ulcer index is mainly a review tool. Traders apply it to a backtest or a live equity curve, on weekly or daily closes, to see how painful the path was. Ranking strategies by the Martin ratio favours those that recover quickly, which suits buy-and-hold investors and loss-averse traders.

It can also act as a filter. StockCharts’ documentation includes a scan that keeps only stocks with a 14-period reading below 10. Equity-curve rules that cut position size after a set drawdown could use the ulcer index as their trigger. Neither use makes it a buy or sell signal: it describes past pain, not future direction.

Backtests need extra care. An optimiser that maximises the Martin ratio tends to favour settings that happened to dodge past slumps, a form of overfitting. Testing on data the optimiser never saw is a common check.

The Honest Limits of the Ulcer Index

The ulcer index only sees closes that have already happened. Strategies that sell insurance-like payoffs, or add to losing positions, can show a smooth curve and a low score for long periods. One large loss can then change the picture, so a low reading is not evidence of low risk.

It also depends on choices. Weekly and daily data give different values, and a measure built on closes misses intraday dips, which is the gap between end-of-day and intraday drawdown. A 14-period window forgets old peaks, and longer histories tend to contain deeper drawdowns. Goldberg and Mahmoud (2014) cite earlier work by Burghardt and colleagues on this point. It found maximum drawdown distributions highly sensitive to track record length and data frequency.

In large samples the choice of measure may matter less than examples suggest. Eling and Schuhmacher (2007) ranked 2,763 hedge funds with the Sharpe ratio and 12 alternatives, including the Calmar and Sortino ratios. Rankings were virtually identical, with an average rank correlation of 0.97 against the Sharpe ratio. The ulcer index was not among the measures tested.

Leverage can deepen a drawdown faster than any weekly measure updates. ESMA’s 2018 decision to restrict CFDs cited national regulators’ analyses showing that 74% to 89% of retail accounts typically lose money. A history-based score does not change that arithmetic.

Tracking the Ulcer Index on Your Own Account

Aron Groups clients trade forex, gold, index CFDs and crypto CFDs on MetaTrader 5. Its trading report shows a maximum drawdown, the Sharpe ratio and the recovery factor, but no ulcer index. The History tab can save an account’s trades as an HTML report. A weekly balance series and its drawdowns can then be rebuilt in a spreadsheet.

A demo account, funded with virtual money, is a place to test how position size changes those numbers. Halving position size roughly halves each weekly return. On the slow-grind path, that cuts the ulcer index from 8.00 to 4.04 and the return from 14.16% to 7.02%, costs ignored. The 40 weeks under water stay the same, so here sizing changes depth, not duration. The drawdown calculator shows how a run of losses at a fixed percentage compounds.

Conclusion

The ulcer index adds the dimension that maximum drawdown leaves out: time. By squaring every percentage drawdown and averaging across all periods, it scores how deep and how long equity stays below its peak.

The Martin ratio turns that score into return per unit of drawdown pain. Neither number predicts the next slump, and both depend on the data chosen, but together they show how a return was earned.

Frequently Asked Questions

Short answers to common questions about the ulcer index and the Martin ratio.

What is a good ulcer index value?

Lower is better, and zero means no drawdown. No official threshold exists: 5 and 10 are conventions from charting scripts. Martin’s S&P 500 buy-and-hold figure for 1940 to 1997 was 8.85.

How is the ulcer index different from maximum drawdown?

Maximum drawdown is the single deepest fall from a peak. The ulcer index uses every period’s drawdown, so it rises with both depth and time under water.

What is the Ulcer Performance Index?

It is excess return divided by the ulcer index, also called the Martin ratio. Higher values mean more return per unit of drawdown pain, as with a Sharpe ratio.

Is the ulcer index a buy or sell signal?

No. It measures how painful past drawdowns were. It can filter markets or strategies, but it does not signal entries by itself.

Continue Reading
not-found
calendar 22 November 2026
Rate this article

Leave a Reply

Your email address will not be published. Required fields are marked *

No thanks