


Many retail traders struggle to understand why the price often hits their stop-loss before moving in the direction they predicted. This is rarely an accident; it results from Resting Liquidity interacting with institutional order flow.
In modern markets, price seeks out areas of high transaction volume to satisfy the needs of large-scale participants. Understanding where these pending orders are “parked” allows you to stop being the liquidity and start trading alongside it.

- Institutional players use resting liquidity as a primary target to fill massive positions without causing high slippage.
- Placing your exit orders slightly beyond obvious swing points can protect you from routine liquidity sweeps.
- Significant price breakouts are often powered by the sudden execution of accumulated pending orders rather than new market interest.
- A failed attempt to maintain price beyond a liquidity zone is often the first warning of a major trend reversal.
Understanding Resting Liquidity in Today’s Markets
Resting Liquidity is a fundamental concept in modern trading, representing the constant interaction between orders ready for immediate execution and those waiting at specific price levels to be triggered.
What Resting Liquidity Means in Trading Terms
Resting liquidity refers to all pending orders currently in the market that have not yet been filled. These are not immediate trades; instead, they are instructions waiting for the market to reach a specific price.
Common types include:
- Limit Orders: Orders to buy below or sell above the current price.
- Stop Orders: Often used for “stop-losses” or to enter a breakout.
- Market Maker Quotes: Prices provided by large institutions to keep the market moving.
As explained in Investopedia, think of resting liquidity as stored energy. While a market order happens instantly, a resting order stays inactive in the “order book.” When price finally hits these levels, the sudden execution of this stored volume often triggers sharp price movements or reversals.
Resting Liquidity vs Active Liquidity: Why the Distinction Matters
Active liquidity represents the immediate flow of trades. These are market orders that fill instantly at the best available price. This type of liquidity is what you see moving the “ticker” or the price line on your screen from one second to the next.
Resting liquidity consists of orders that are “parked” in the order book.
While active liquidity shows what is happening in the present, resting liquidity often acts as a map for where the market might go in the future.
| Feature | Active Liquidity | Resting Liquidity |
|---|---|---|
| Execution | Immediate (Market Orders) | Delayed (Pending Orders) |
| Visibility | Seen in the current "Tape" or Time & Sales | Hidden in the depths of the order book |
| Function | Facilitates current trade flow | Acts as a "magnet" for future price |
| Example | Buying 10 shares at the current ask | A stop-loss set 50 pips away |
The distinction matters because professional traders use resting liquidity to find “exit” or “entry” points for large positions. If there is a large cluster of resting sell orders at a certain level, a large buyer will be drawn to that price to ensure their order is filled efficiently.
How Resting Liquidity Develops Across Price Levels
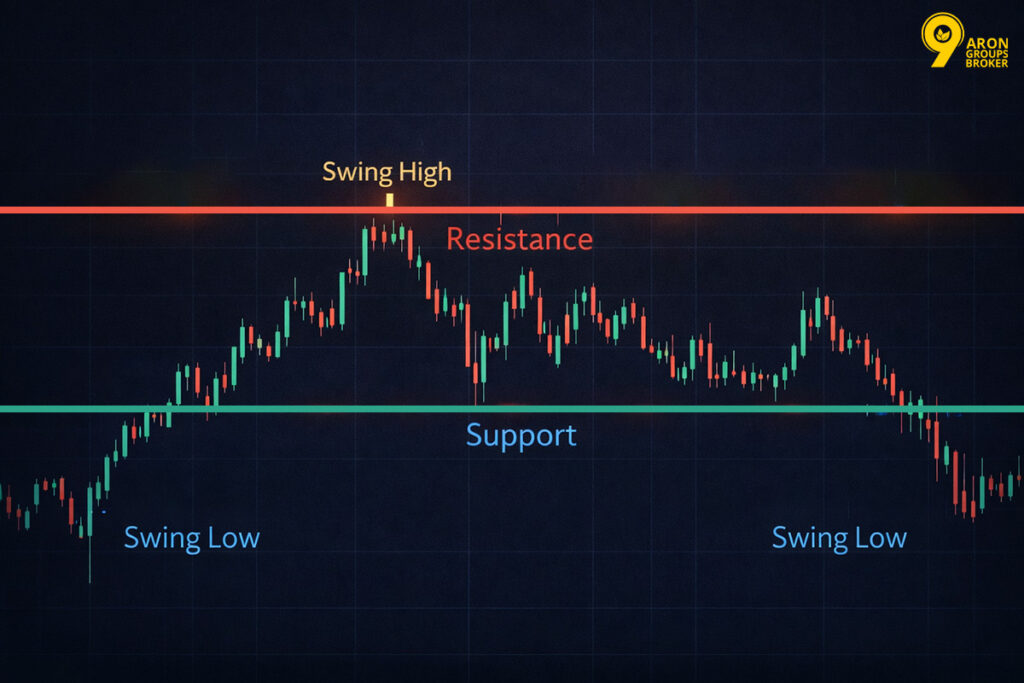
Liquidity does not spread evenly across a chart; it clusters in predictable pools. These clusters form because most traders use the same technical landmarks to place their orders.
- Swing Highs and Lows: Traders place stop-losses just above recent peaks or below recent troughs.
- Psychological Levels: Round numbers (e.g., 1.2000 or $100) naturally attract a high volume of limit orders.
- Support and Resistance: Areas where price has bounced multiple times become heavy zones for resting orders.
As these orders accumulate, they create a gravitational pull. Because the market requires volume to function, price naturally moves toward these clusters to clear orders. This is why you often see prices briefly pierce a well-known resistance level before reversing; it has simply moved there to tap into the resting liquidity.

Key Point:
Resting liquidity concentrates at obvious technical levels. Identifying these clusters allows you to anticipate where price is likely to head next before a move even begins.
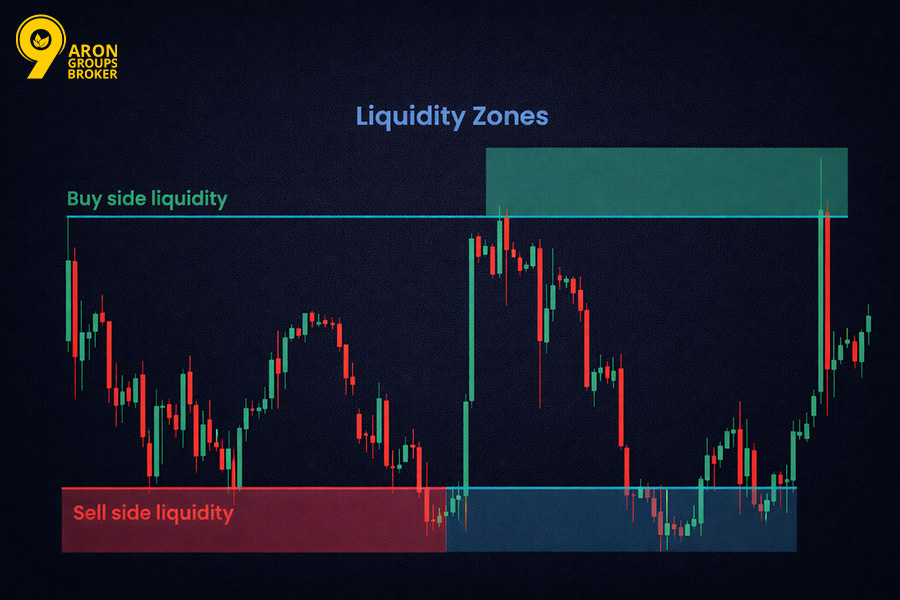
Buy-Side and Sell-Side Resting Liquidity Dynamics
Resting Liquidity in modern markets is categorised by its position relative to the current market price, creating a constant pull between buy-side and sell-side orders.
Where Buy-Side Resting Liquidity Typically Sits
Buy-side Resting Liquidity is made up of buy orders that are waiting to be filled. These primarily get into two specific areas:
- Support Zones: Limit buy orders from traders expecting a bounce typically sit near previous demand zones or moving averages.
- Above Swing Highs: This is a major area for Buy Stops. These are stop-loss orders from traders who are currently short. If the price hits these levels, these traders are forced to buy back their positions.
When the price reaches a cluster of buy-side Resting Liquidity above a swing high, the sudden trigger of these stop-loss orders often causes an aggressive squeeze or breakout. This movement is powered by short-sellers exiting and new buyers entering simultaneously.
How Sell-Side Resting Liquidity Builds Above Price
Sell-side Resting Liquidity represents all pending sell orders located above the current market price. This build-up occurs through a combination of different participant goals:
- Resistance Levels: Traders expecting a reversal place limit sell orders at key peaks or round-number price levels (e.g., 1.3000).
- Below Swing Lows: Traders with long positions place their stop-loss orders here. These sit as resting sell orders, ready to execute if the market drops.
- Institutional Entry: Large banks often place massive limit sell orders at these zones to enter short positions without moving the price too much against themselves.
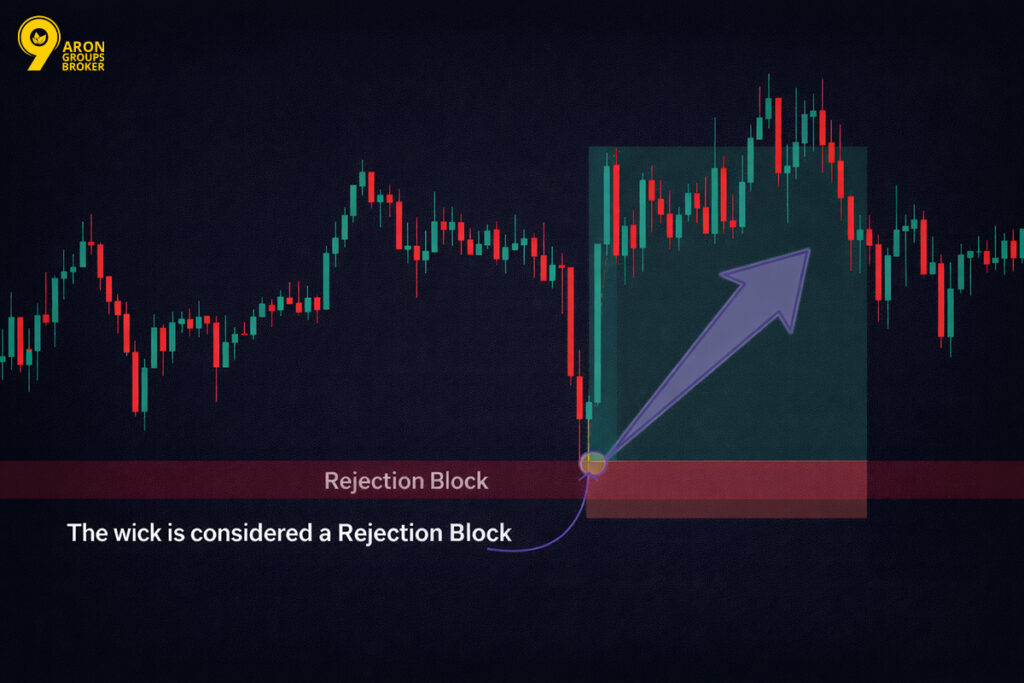
The concentration of these orders creates significant selling pressure. When price hits a heavy zone of sell-side Resting Liquidity, you will often see a sharp rejection, frequently visible on a chart as a long upper wick or a rapid reversal.
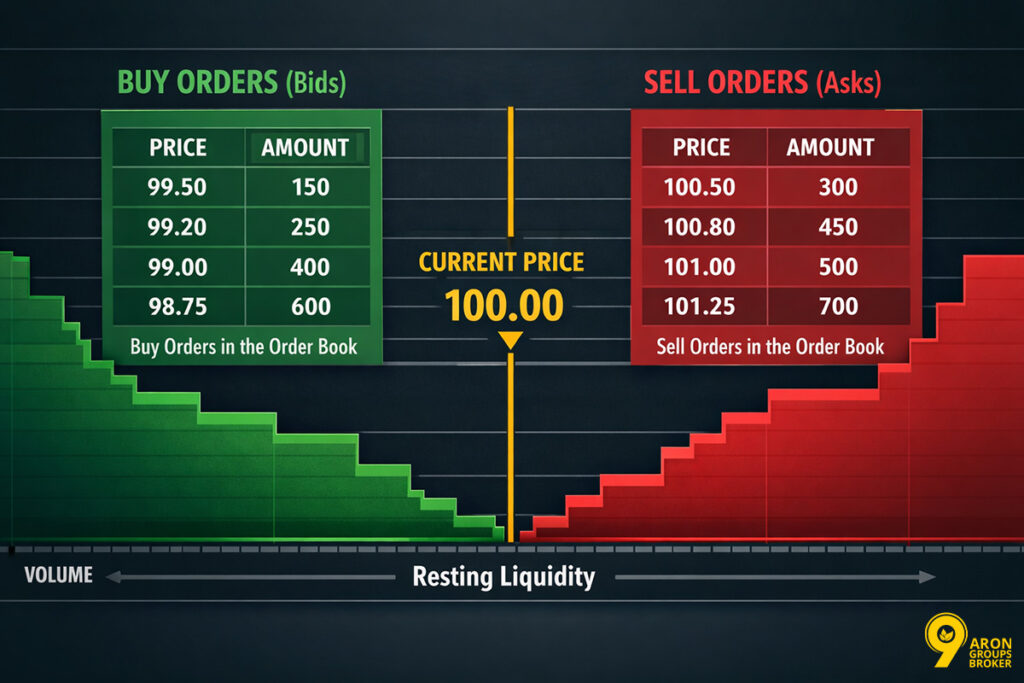
Order Clustering Between the Bid and the Ask
The interaction of Resting Liquidity is most visible in the spread, the gap between the Bid (the highest buyer price) and the Ask (the lowest seller price).
- The Order Book: Every resting order at every price level is recorded here. In active markets like major forex pairs, this data updates hundreds of times per second.
- Liquidity Walls: When a high volume of orders clusters at a specific price near the current bid or ask, it creates a wall. Price must consume all these orders before it can move higher or lower.
- Market Context: While short-term traders monitor these clusters in real time (Level 2 data), swing traders use them to identify where price is likely to stall or accelerate on higher time frames.
Important:
Order clustering is most reliable in high-liquidity instruments. In thin markets with low volume, the bid-ask spread is wider, making these Resting Liquidity walls less stable and harder to trade.
Key Areas Where Resting Liquidity Accumulates
Resting Liquidity does not distribute randomly; it settles in specific zones where many traders place their orders at once.
High-Probability Resting Liquidity Zones
Certain price areas consistently attract more pending orders because they are obvious to most market participants. This collective focus creates high-probability zones.
- Session Extremes: The high and low prices of the Asian, London, and New York sessions contain massive order clusters.
- Daily and Weekly Levels: Traders often place stop-losses just beyond the previous day’s high or the weekly opening price.
- Strong Reaction Points: Any area where the price previously moved sharply will likely attract new orders on a return.
When many traders look at the same chart and identify the same level, their combined orders create a self-reinforcing zone of Resting Liquidity.
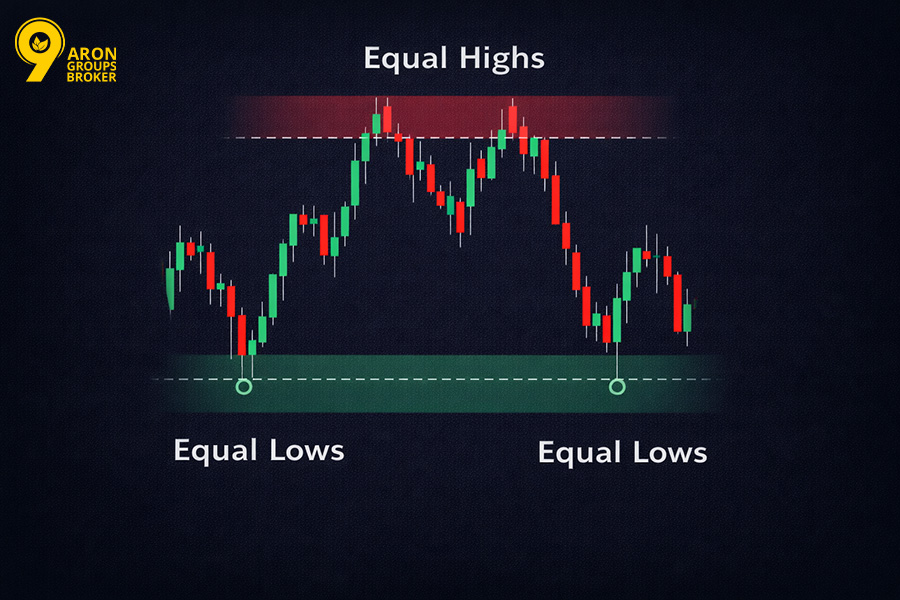
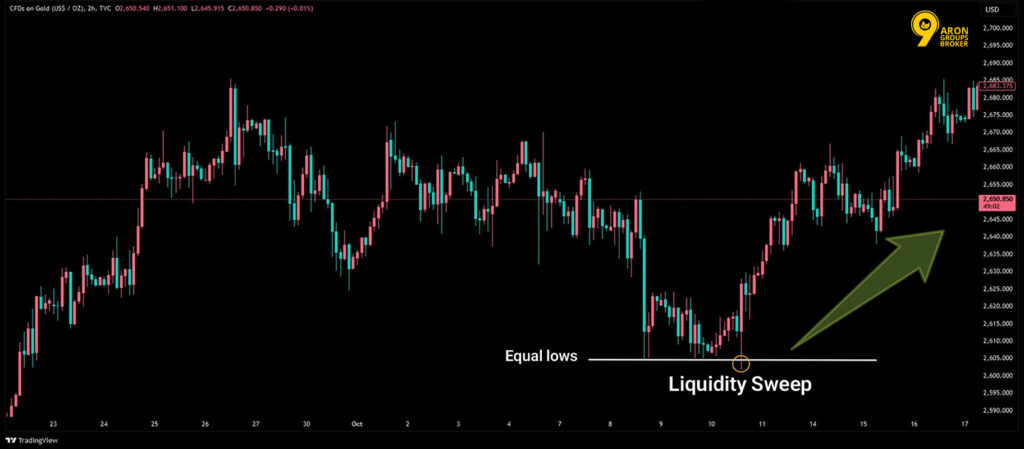
Equal Highs and Lows as Liquidity Magnets
Equal highs occur when price tests a resistance level multiple times without breaking through, creating a ceiling that attracts buy orders.
- Buy-Side Build-up: Short-sellers place stop-losses above equal highs, while breakout traders place buy stop orders at the same level.
- Sell-Side Build-up: Below equal lows, long traders hide their stop-losses, and breakout sellers place sell stop orders to catch a drop.
- The Sweep: Markets often treat these levels as magnets, moving through them to fill the orders before potentially reversing direction.
Key Point:
Equal highs and lows are not strong barriers. They are areas where large order clusters wait to be cleared by the market.
Round Numbers and Psychological Price Levels
Psychological levels, such as 1.1000 in EUR/USD or 2000 in Gold, attract a disproportionate number of resting liquidity orders. Human traders and institutions naturally prefer these round numbers when setting entry points, stop-losses, and take-profit targets.
This habit creates predictable order clusters that market research confirms as significant volume zones.
This effect also extends to “half-round” numbers like 1.0500 or 1.0750, which act as secondary hubs for institutional orders. While these levels see slightly less activity than major round numbers, they still function as meaningful zones where price often stalls or reacts.
These areas create visible liquidity walls that the market must repeatedly interact with as it moves through various price ranges.
Analysing Resting Liquidity Through the Order Book
The order book serves as a real-time record of the exact price levels at which buyers and sellers have placed their pending trades.
Limit Orders, Pending Orders, and Unfilled Liquidity
A limit order is an instruction to trade only at a specific price or better. It remains inactive until the market reaches that level.
- Limit Orders: These sit in the book and add liquidity by waiting for the market to come to them.
- Stop Orders: Once triggered, these turn into market orders. They remove liquidity by demanding an immediate fill from the available pool.
- Unfilled Liquidity: This represents the total volume of orders that the price has not yet reached or cleared from the book.
Understanding these types is vital. Limit orders provide a buffer that slows price, while stop orders can accelerate price movements once they are hit.
Using Order Book Depth to Identify Resting Liquidity
The order book, often called Level 2 data or market depth, displays the volume of resting buy and sell orders at various price levels. Traders use this real-time data to see where large clusters of orders are sitting, helping them anticipate where the price might move next.
Large resting sell orders above the current price act as temporary resistance. The market must work through this volume before the price can continue higher.
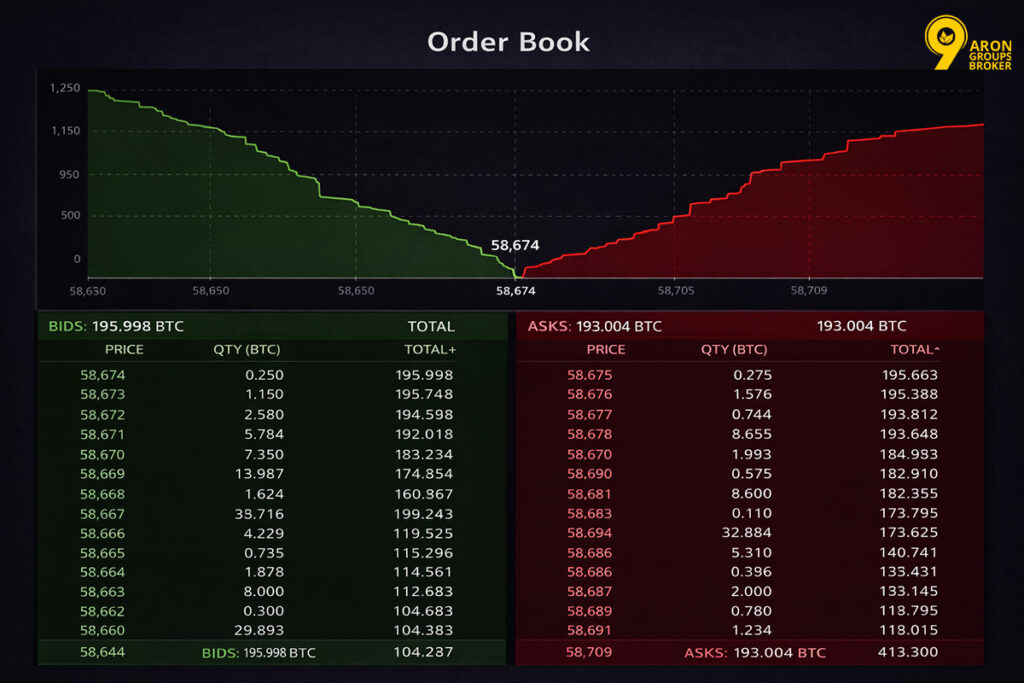
Conversely, large buy orders below the price provide temporary support. These visible concentrations are often called “order walls.” In some cases, only a fraction of a large institutional order is shown; these are known as “icebergs” because the bulk of the volume remains hidden.
Important:
Order book data in retail forex differs from centralised exchanges. Since forex is a decentralised, over-the-counter (OTC) market, there is no single master order book. Retail traders generally see only the order flow from their specific broker, which provides only a partial view of the global market.
The Hidden Side of Resting Liquidity
Not all resting liquidity is visible on your screen. Large institutions often use private methods to hide their intentions from retail traders.
- Dark Pools: These are private exchanges where large trades happen without appearing in the public order book.
- Order Slicing: Algorithms break massive orders into tiny pieces. This reduces market impact and hides the total volume from other participants.
- Liquidity Absorption: Price may move through a “strong” level easily if a hidden order on the other side absorbs all visible volume.
This hidden dimension explains why price sometimes ignores visible support or resistance. The visible data only tells part of the total market story.
Warning:
Order book data provides a partial view of resting liquidity. Hidden institutional orders and dark pool activity mean that visible depth alone is not a reliable trading signal.
How Price Reacts to Resting Liquidity
The way price behaves at liquidity levels depends on whether incoming market orders can overcome the volume of waiting pending orders.
Price Behaviour When Resting Liquidity Gets Triggered
When price hits a cluster of resting orders, the outcome depends on the balance between buying and selling volume.
If buyers reach a sell-side liquidity zone with enough force, they may execute all waiting orders without the price reversing. This process is known as absorption, where resting orders are filled but do not stop the current price direction. Absorption typically happens at the start of strong trends when institutional pressure is high.
Conversely, if the resting orders are larger than the incoming pressure, the market will run out of fuel to push further. Once the available supply or demand is exhausted, the price reverses. This creates a visible rejection pattern on the chart, often appearing as a pin bar or a candle with a long wick.
Absorption vs Rejection at Liquidity Levels
Distinguishing between absorption and rejection is vital for risk management, as both scenarios affect your trade outcomes differently. Because neither can be predicted with absolute certainty, traders must use consistent position sizing and stop-loss placement to protect their capital.
- Absorption usually occurs when the broader trend is strong, and the price approaches a level with high momentum. In this case, the resting orders are filled rapidly and act as fuel for the market to continue its current direction.
Rejection is more likely when the price lacks momentum or the broader trend opposes the move. When the pool of resting orders is larger than the incoming flow can handle, the price exhausts itself and reverses sharply. This setup is a common foundation for many liquidity-based trading strategies.
| Scenario | What Happens | Chart Pattern |
|---|---|---|
| Absorption | Resting orders fill, price continues | Strong candle closing through the level |
| Rejection | Resting orders fill, price reverses | Long wick, pin bar, or engulfing candle |
| Partial Fill | Some orders fill, price consolidates | Tight trading range or "flag" near the level |
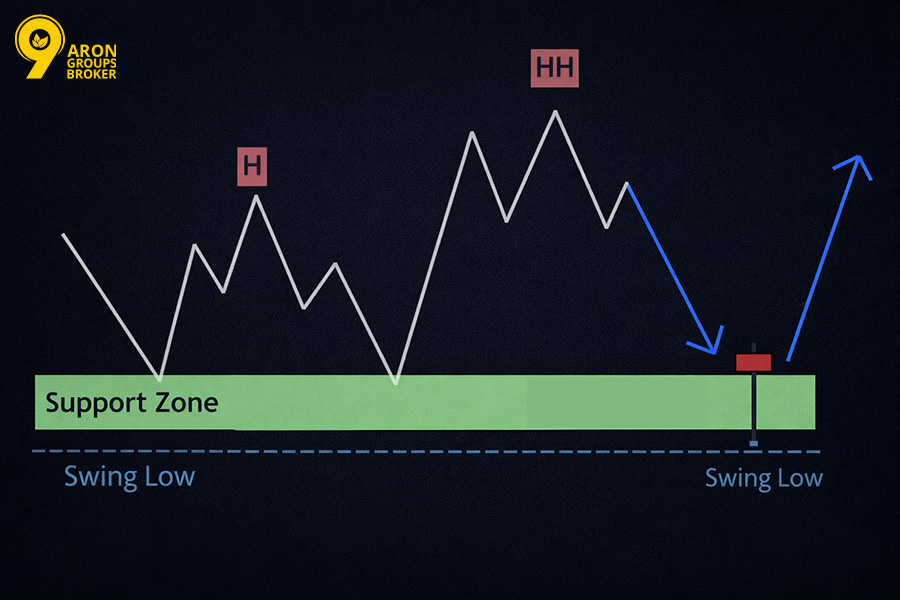
Failed Moves and Successful Liquidity Sweeps
A failed move happens when the price breaks a liquidity level, triggers the orders, but immediately reverses instead of continuing the breakout. This pattern suggests that the orders driving the initial break have been completely exhausted.
A successful liquidity sweep occurs when price spikes through a zone to trigger orders and then quickly changes direction. Large institutions often use these sweeps as “exit liquidity” to fill their own massive positions. The triggered orders provide the necessary volume for the institution to trade in the opposite direction.
To identify a genuine breakout, watch the price action after the break. If the price closes and holds beyond the level, it is likely a breakout. If it spikes through and closes back inside the range, it is usually a sweep or a failed move.
Resting Liquidity Sweeps and Market Structure Shifts
Liquidity sweeps are essential market events where price briefly penetrates a key level to trigger pending orders before reversing direction.
The Mechanics Behind a Resting Liquidity Sweep
A resting liquidity sweep is a deliberate move into a zone of concentrated orders to generate volume for larger participants. Large institutions require a counterparty to fill their significant positions without causing excessive price slippage or moving the market against themselves.
For Instance: An institution wanting to buy a large amount of currency needs a source of sell orders. They may push the price below a key support level to trigger retail stop-loss orders, which act as sell orders.
These triggered sell orders provide the necessary liquidity for the institution to fill their large buy position at a favourable price. This process is a standard professional practice for managing large-scale order flow in highly liquid global markets.
Important:
Sweeps are a natural part of market function. Understanding them helps you avoid placing orders in locations that serve as obvious targets.
Stop Hunts and Liquidity Grabs
- A stop hunt specifically targets the predictable stop-loss orders of retail traders clustered at obvious technical levels like recent highs or lows. Because retail traders often use the same reference points, these areas become highly visible targets for institutional flow.
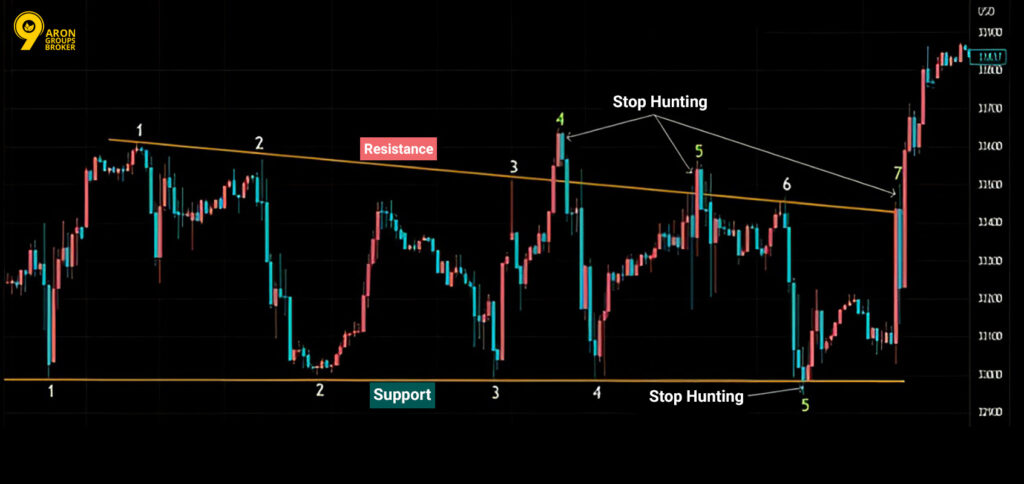
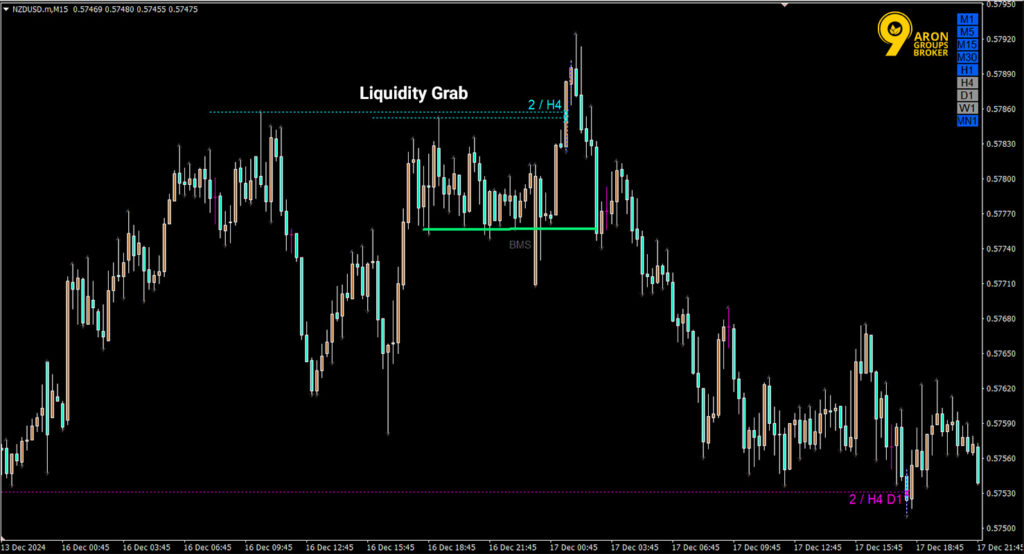
- A liquidity grab is a broader term covering the targeting of any resting pool, including limit orders and pending entry orders. Both patterns follow a similar sequence: price moves aggressively into a zone, fills orders rapidly, and then reverses sharply.
Traders can adapt by placing stop-loss orders beyond the most obvious price structures. Positioning stops further away requires more deliberate institutional effort to reach, though it does not entirely remove the risk of being stopped out.
How Resting Liquidity Drives Structural Market Moves
Market structure is the sequence of highs and lows that define a trend. Resting Liquidity provides the necessary fuel for these structural moves to develop and continue.
- Trend Momentum: In an uptrend, each new high creates a pool of resting buy orders from breakout traders and short-sellers’ stops.
- Order Triggering: When price sweeps above a high, it triggers these orders, providing the buying volume needed to sustain the move.
- Structural Shifts: A shift occurs when a liquidity sweep at a high fails to continue and results in a reversal.
- Trend Reversal: This breakdown in the sequence of higher highs and higher lows signals that the underlying order flow has fundamentally changed.
Trading Strategies Built Around Resting Liquidity
Successful strategies involve identifying where orders are hidden and planning entries around those zones to gain a professional edge.
Mapping Resting Liquidity to Anticipate Market Direction
Traders must map major resting liquidity pools on higher time frames, such as the daily or four-hour charts, before trading. This process helps identify where the market is most likely to move next.
- Identification: Mark recent swing highs, equal lows, round numbers, and session extremes on your chart.
- Proximity: Assess which zones are closest to the current price to determine the market’s likely short-term path.
- Bias: If the nearest pool is above price and the trend is bullish, expect a move higher to collect that liquidity.
Mapping is a probability assessment, not a certainty. It helps you align with the market’s gravitational pull from stored orders.
Positioning Trades Around Resting Orders
Once you identify a liquidity target, you can choose between two primary entry methods based on your risk tolerance.
- The Proactive Approach: Enter before the price reaches the zone, targeting the sweep itself as your profit objective. This offers high rewards but requires a very precise entry trigger.
- The Reactive Approach: Wait for the sweep to finish and enter only when the price reverses. This provides more evidence of a reversal but results in a less favourable entry price.
Traders who prefer less uncertainty usually wait for a rejection candle. This confirms that the resting orders were filled and the market is ready to turn.
Risk Management in Liquidity-Focused Set-ups
Risk management is essential to every strategy, especially given the volatility of liquidity zones. The primary danger is a genuine breakout, where price sweeps a level but continues in that direction rather than reversing.
To protect your capital, you must define a clear invalidation point before entering any trade. For a sweep-and-reversal setup, the stop-loss is typically placed just beyond the extreme point of the sweep candle. If the price reaches this level, the reversal idea is no longer valid, and the trade should be closed immediately.
Effective discipline also requires strict position sizing. Your total loss on any single trade should not exceed one or two per cent of your account equity. This approach ensures that a series of small losses does not lead to a major drawdown, keeping you in the game for future opportunities.
Warning:
No liquidity-based set-up carries certainty. Market conditions change, and institutional order flow can push prices well beyond expected reversal zones. Always use a defined stop-loss on every trade.
Q: Should I avoid placing stop-losses at obvious levels like swing lows?
A: Not necessarily. A stop below a swing low is technically valid because if the price breaks it, your trade logic has likely failed. The real issue is the “buffer.”
Placing a stop exactly at the low makes you a target for a sweep. Adding a small buffer beyond the level allows the market to “breathe” during a minor liquidity grab without prematurely closing your position.
Resting Liquidity in the ICT Trading Framework
The Inner Circle Trader (ICT) methodology is a structured approach that centres on resting liquidity in every trade decision.
How ICT Identifies Resting Liquidity Pools
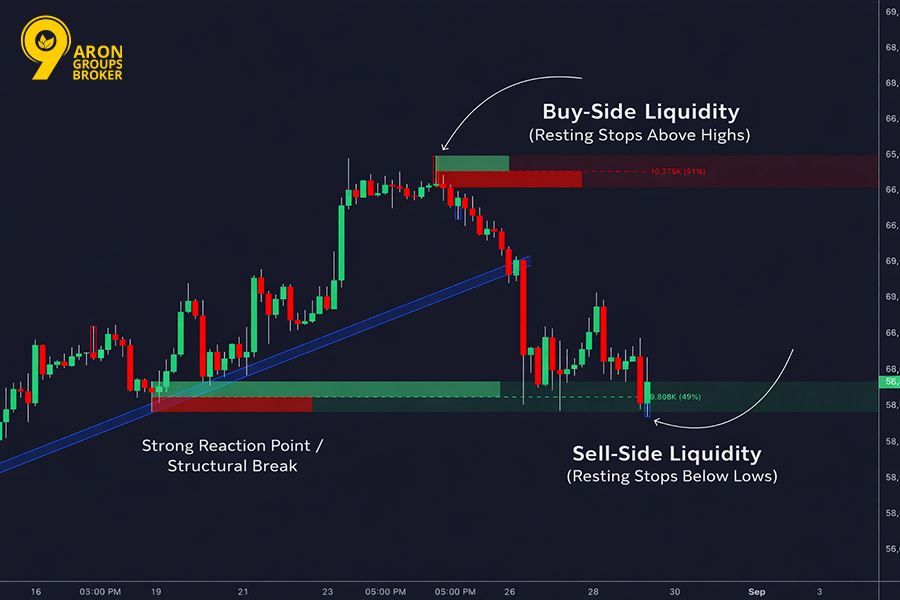
In the ICT framework, practitioners classify liquidity as either “Buy-side” (above current price) or “Sell-side” (below current price). These zones act as the primary targets for the market’s next move.
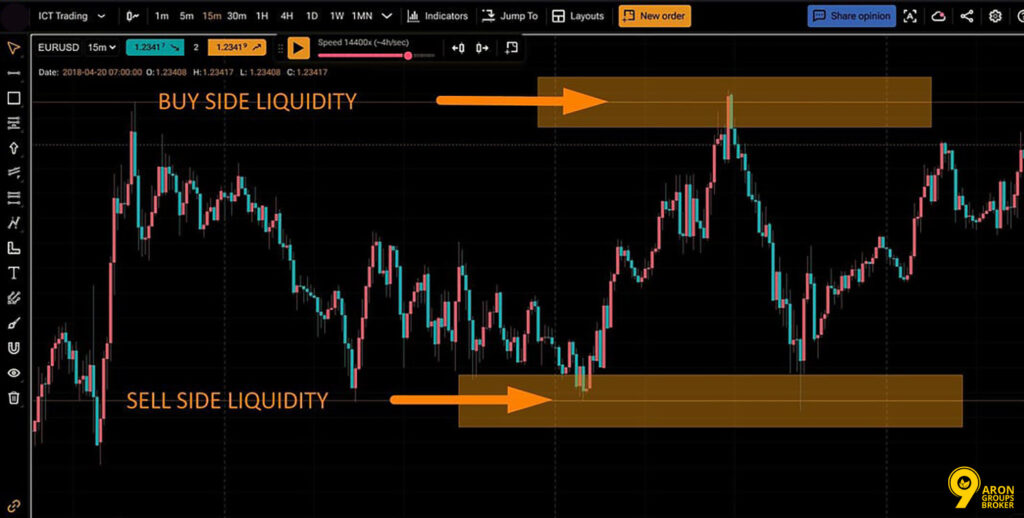
- Buy-side Liquidity: This refers to clusters of resting buy orders, typically stop-losses from short sellers, sitting above previous swing highs.
- Sell-side Liquidity: This represents resting sell orders, often stop-losses from buyers, located beneath previous swing lows.
- The Draw on Liquidity: Traders ask which pool price is most likely to be targeted next before searching for any trade entry.
By focusing on these targets, ICT traders move from a higher time-frame bias to a lower time-frame entry. This top-down approach ensures they are trading in line with institutional flow.
Liquidity Voids and Fair Value Gaps in Context
A Liquidity Void occurs when the price moves so rapidly that it leaves behind almost no resting orders at intermediate levels. Because these areas have thin order density, price often revisits and fills them quickly in the future.
A Fair Value Gap (FVG) is a specific three-candle pattern showing an imbalance between buyers and sellers. It is identified by the gap between the high of the first candle and the low of the third candle.
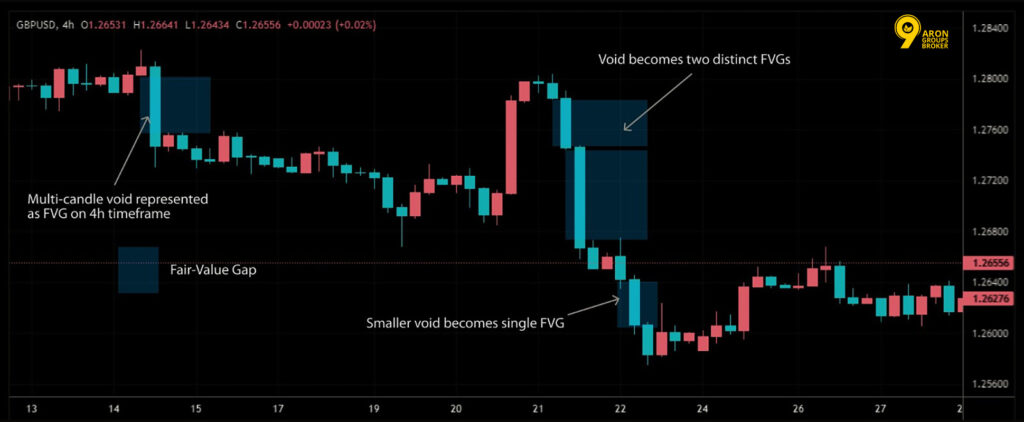
ICT practitioners treat these gaps as magnets. They expect the price to return to these unbalanced areas to fill resting orders before continuing its original directional move.
Applying ICT Liquidity Concepts in Live Markets
Using these concepts requires a disciplined process. Traders first identify the higher time-frame draw on liquidity before waiting for a specific lower time-frame signal.
- The Sweep and Shift: Price spikes through a known liquidity pool to trigger orders, then quickly changes direction on a smaller time frame.
- The Entry: After price sweeps liquidity and shifts structure (creating a new high or low), the trader enters on the first pullback.
- Simulated Practice: Because this framework uses unique terminology, beginners should study these patterns in a demo account to avoid common misidentification errors.
This method focuses on following the path of large-scale order flow rather than simply reacting to basic technical indicators.
Q: Is the ICT framework only useful for forex trading, or does it apply to other markets?
A: While developed for forex, these concepts apply to any liquid market. This includes equity indices, commodities like Gold, and major cryptocurrencies. The core requirement is high trading volume, which ensures that structural patterns and resting liquidity pools remain meaningful and reliable.
Conclusion
Mastering Resting Liquidity transforms your perspective, enabling you to anticipate market direction rather than simply reacting to prices. By identifying these liquidity magnets, you can avoid common retail traps and align your strategy with professional institutional flow.
Successful trading is about managing probabilities and identifying the path of least resistance. Incorporating liquidity analysis into your routine provides a significant edge, helping you enter trades with greater confidence and clarity.


