In the fast-paced financial markets, traders constantly seek ways to gain an edge. Lorentzian Classification is one such tool, combining physics and machine learning to predict price movements with greater accuracy. This guide will cover the optimal settings for the Lorentzian Classification indicator, explain its functionality, and demonstrate its application in your trading strategies.

- Lorentzian Classification uses advanced machine learning techniques to provide more accurate predictions than traditional indicators.
- The Lorentzian Distance metric filters out noise, making it ideal for high-impact news events.
- Use trend filters (e.g., EMA) and volatility filters to refine your signals and avoid false entries.
- The TradingView to MT5 Bridge enables you to use Lorentzian Classification across different platforms.
What is Lorentzian Classification? A Powerful Tool for Predicting Market Movements
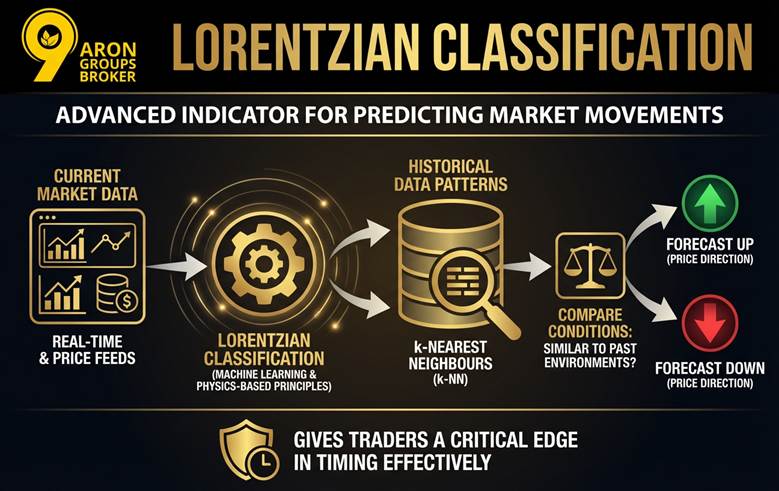
Lorentzian Classification is an advanced indicator that allows traders to predict market movements by analysing historical data patterns. Unlike traditional indicators like the RSI (Relative Strength Index), it uses machine learning and physics-based principles to deliver more accurate predictions in volatile market conditions.
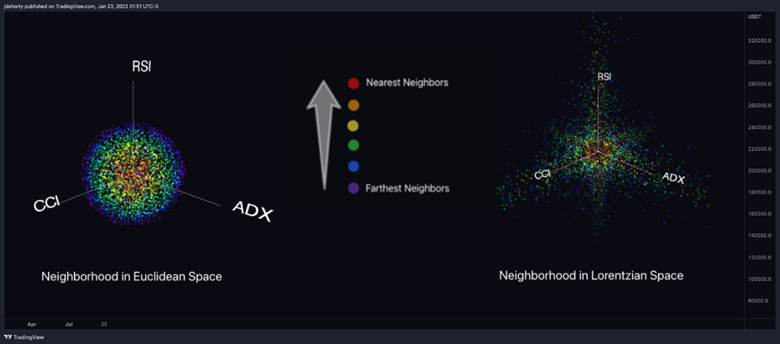
At the heart of Lorentzian Classification lies a method called k-Nearest Neighbours (k-NN). This technique involves searching through past market data to find conditions similar to the current market environment.
By identifying historical price movements, it forecasts potential future price directions, giving traders a critical edge in timing their trades effectively. This approach focuses on comparing current market conditions with those of the past and examining whether prices moved up or down during similar circumstances.

Key Point:
Unlike traditional indicators, Lorentzian Classification uses the Lorentzian Distance metric, which is far superior in filtering out noise, especially during high-impact news events.
How Does Lorentzian Classification Work in Trading? A Detailed Look
Now that we understand the basics, let’s explore how the Lorentzian Classification indicator operates in practical trading scenarios.
Pattern Matching and Signal Generation
When the Lorentzian Classification indicator is active, it scans historical market conditions that are similar to the current market environment. This “pattern matching” method allows the indicator to predict the probability of a price movement, either up or down. It then assigns a score to each candlestick, which indicates whether the market is likely to move in the same direction as previous similar patterns.
- Positive Scores (e.g., +6 to +8) indicate a strong buy.
- Negative Scores (e.g., -6 to -8) suggest a strong sell.
Filtering Out Noise and False Signals
The real power of Lorentzian Classification lies in its ability to filter out false signals and market noise. Traditional indicators may react to sudden price fluctuations or news-driven volatility, leading to misleading signals. Lorentzian Classification avoids this by focusing on significant patterns, allowing it to ignore irrelevant, smaller movements that might affect other indicators.
Q: How does Lorentzian Classification avoid false signals compared to traditional indicators like RSI?
A: Unlike traditional indicators such as RSI, which often react to brief price spikes or news volatility, Lorentzian Classification uses pattern matching and the Lorentzian Distance metric to focus on significant, reliable signals.
Practical Guide to Signal Hunting with Lorentzian Classification
Using the Lorentzian Classification indicator effectively in real-time trading requires understanding how to interpret its signals and combine them with additional filters for higher accuracy. Here’s a step-by-step approach to signal hunting with Lorentzian Classification:
Interpreting Entry Signals
The Lorentzian Classification indicator generates scores for each candlestick, which indicate the strength of potential market movements. For buy signals, look for scores of +6 or higher, which suggest a strong potential for price increase. Similarly, for sell signals, a score of -6 or lower indicates a strong probability of a downward price movement.
However, simply relying on these scores is not enough to make a profitable trade. It is essential to use filters that can help confirm the signals and avoid false entries, such as combining Lorentzian Classification with a volatility filter.
According to TradeSearcher, the effectiveness of Lorentzian Classification can be maximized when combined with a trend-following indicator, such as the 200 EMA, to filter out false signals during volatile conditions.
Using Volatility Filters for Better Accuracy
A volatility filter adds another layer of reliability to the Lorentzian Classification signals. It helps to ensure that the signals you act upon are not from price spikes or erratic market conditions. For example, using a Kernel Regression filter or Exponential Moving Averages (EMA) can smooth out the price action, helping to eliminate noise and providing more dependable trading signals.
Signal Validation' Checklist
Before entering a trade based on Lorentzian signals, confirm these three conditions:
- The Score: Is the classification score above +6 (for Long) or below -6 (for Short)?
- The Close: Has the signal candle fully closed? (Never trade on a moving candle).
- The Filter: Is price above the 200 EMA (for Buys) or below it (for Sells)?
How to Use Lorentzian Classification on MT4 and MT5: The Broker Bridge
While Lorentzian Classification was initially developed for TradingView, many traders prefer to use other platforms like MT4 or MT5. The good news is that you can still harness the power of this advanced indicator on these platforms by using a TradingView to MT5 Bridge.
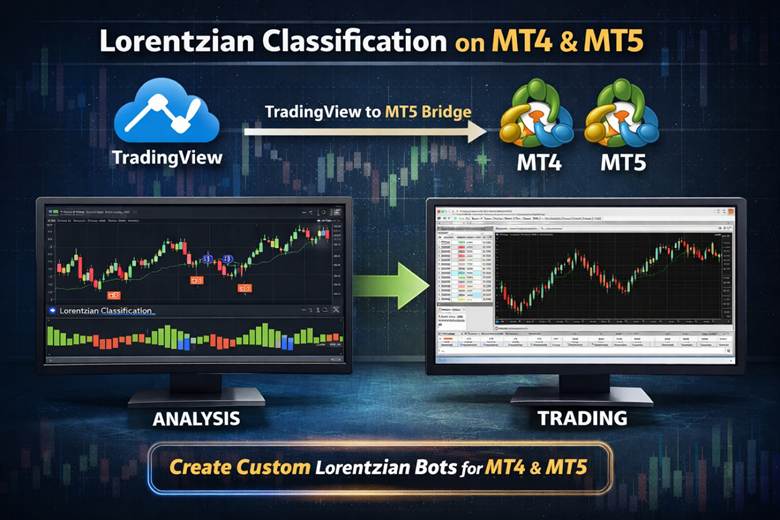
Using the TradingView to MT5 Bridge
The TradingView to MT5 Bridge allows you to perform your market analysis on TradingView and then execute your trades directly on MT5.
This solution gives you the best of both worlds: you can benefit from the robust analysis capabilities of Lorentzian Classification on TradingView, while still managing your trades on MT5, which may be your preferred platform.
With this bridge, you won’t have to compromise between using Lorentzian Classification and the platform you’re comfortable with. You can continue analysing market conditions using this advanced indicator and then make informed decisions when executing trades on MT5.
Custom Lorentzian Bots for MT4 and MT5
If you don’t have access to the MT5 version of Lorentzian Classification, there’s an alternative solution. You can create a custom Lorentzian bot using ChatGPT’s machine learning capabilities.
This approach allows you to adapt the Lorentzian Classification indicator to your unique needs and trading style, even on MT4 or MT5. With a tailored bot, you can enhance your trading experience without switching platforms or sacrificing functionality.
Q: Can I use Lorentzian Classification on MT4 or MT5?
A: Yes, you can use a TradingView to MT5 Bridge to perform analysis on TradingView and execute trades on MT5. Alternatively, you can create a custom Lorentzian bot using machine learning to adapt the indicator to your platform.
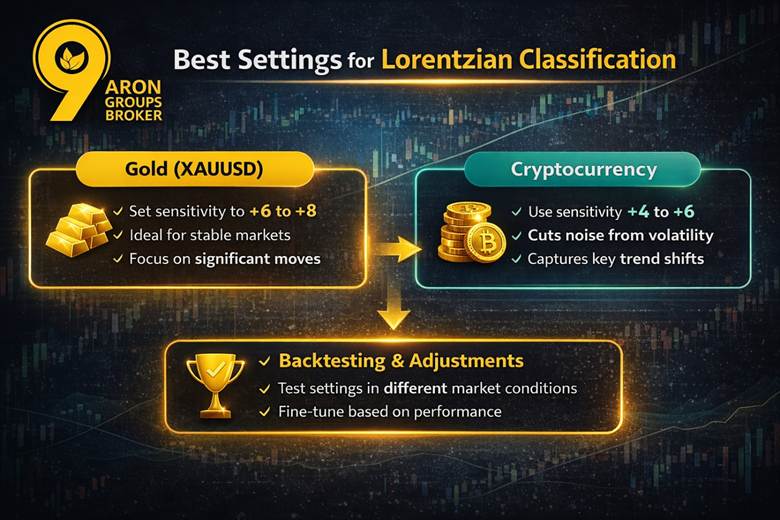
Best Settings for Lorentzian Classification
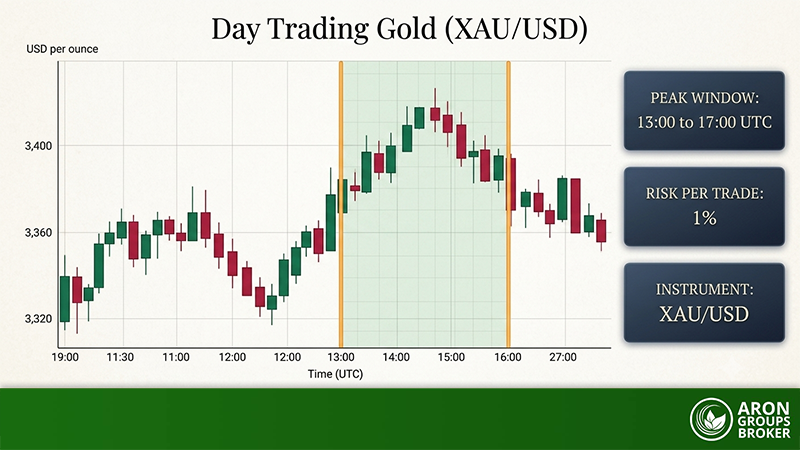
When using the Lorentzian Classification indicator for gold (XAUUSD) and cryptocurrency markets, it’s important to adjust the settings based on their volatility. Each market has unique characteristics, and fine-tuning the Lorentzian Classification settings helps achieve better performance.
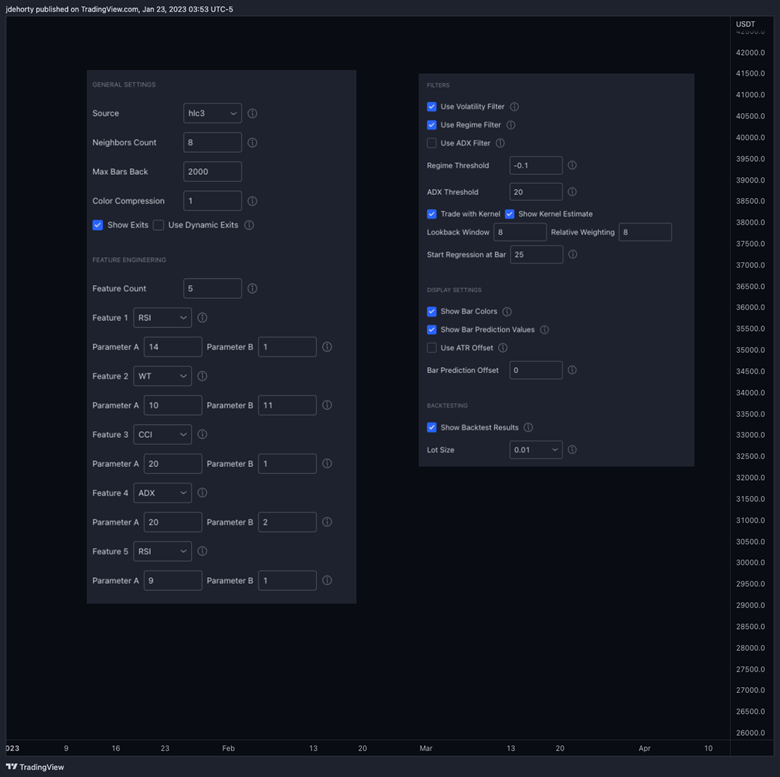
Recommended Settings for Gold (XAUUSD)
For gold (XAUUSD), where price movements are more predictable, use higher sensitivity settings to capture clear signals without overreacting to minor fluctuations.
- Gold (XAUUSD):
- Set the Lorentzian Classification indicator sensitivity to +6 to +8.
- These settings work best in stable, predictable market conditions.
- They help focus on significant price movements, avoiding minor fluctuations.
Recommended Settings for Cryptocurrency
Cryptocurrency markets are more volatile, so lower sensitivity settings are recommended to avoid reacting to erratic price changes and reduce false signals.
- Cryptocurrency:
- Use sensitivity settings between +4 to +6.
- Lower sensitivity helps filter out noise from sudden price movements.
- This ensures the indicator captures key trends in volatile markets.
| Asset Class | Volatility Profile | Recommended Sensitivity | Rationale |
|---|---|---|---|
| Gold (XAUUSD) | Moderate / Predictable | +6 to +8 | Focuses on significant moves; filters out minor chop. |
| Cryptocurrency | High / Erratic | +4 to +6 | Lower threshold helps capture trends early before volatility spikes. |
| Forex Majors | Low / Trending | +5 to +7 | Balanced approach for pairs like EURUSD or GBPUSD. |
Importance of Backtesting and Adjustments
While these recommended settings are a good starting point, backtesting is essential for finding the best configuration. Adjust the settings according to market conditions for the best results.
- Backtesting allows you to:
- Test different settings under various market conditions.
- Adjust sensitivity to fit specific volatility profiles.
- Refine settings for accurate and reliable performance.
According to TradingView documentation, the default optimised feature setup for Lorentzian Classification is more effective on 4‑hour to 12‑hour timeframes, making this a strong starting point when choosing settings for less volatile assets like gold, compared with highly volatile assets like crypto.
Backtesting is crucial to finding the best settings for your market of choice. Adjust sensitivity based on historical performance.
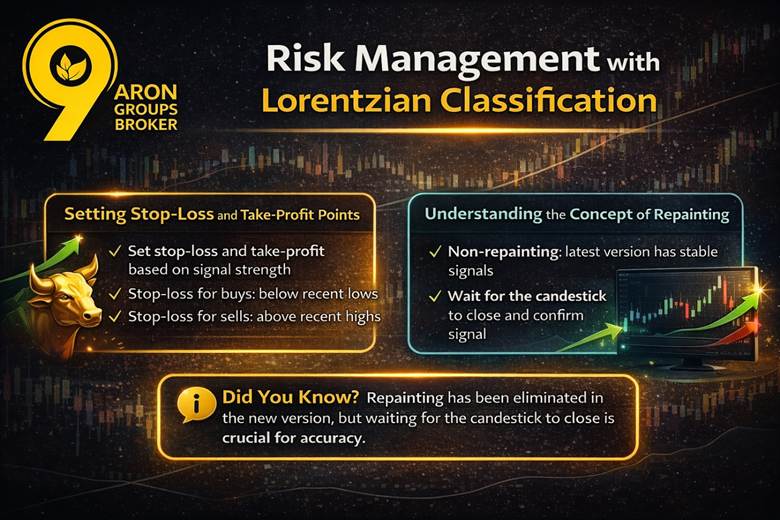
Risk Management with Lorentzian Classification
When trading with the Lorentzian Classification indicator, risk management is essential to protect your capital and maximise gains. Properly setting stop-loss and take-profit points based on the strength of the signals is crucial for maintaining control over your trades.
Setting Stop-Loss and Take-Profit Points
The strength of the Lorentzian Classification signal should guide your stop-loss and take-profit decisions. For strong buy signals (e.g., scores of +6 or higher), set your stop-loss just below recent lows to limit risk. For strong sell signals (e.g., scores of -6 or lower), position the stop-loss above recent highs.
- Stop-loss for strong buy signals: Set below recent lows to limit potential losses.
- Stop-loss for strong sell signals: Set above recent highs to protect against sudden price reversals.
- Take-profit: Set based on the distance from the entry point and overall market conditions, ensuring profits are locked in as the trend progresses.
Understanding the Concept of Repainting
Repainting is a common issue with many indicators, where signals can change after the candle closes. The latest version of Lorentzian Classification—powered by machine learning—resolves this issue. However, even with non-repainting signals, it is still critical to wait for the candlestick to close before acting on a signal. This ensures that the signal is accurate and prevents false entries from occurring.
- Non-repainting: The Lorentzian Classification now provides more reliable, stable signals.
- Wait for the candlestick to close: Always confirm the signal after the candlestick closes to avoid acting on incomplete data.
According to FX market risk management guides, trading signals — no matter how algorithmically derived — must be paired with strict risk management rules such as limiting risk to 1–2% of capital per trade and ensuring target take‑profit is at least twice the stop‑loss distance for a balanced risk‑reward ratio.
Conclusion
In conclusion, Lorentzian Classification is a powerful tool that offers traders an edge in navigating volatile market conditions. By leveraging its pattern-matching ability and Lorentzian Distance metric, it helps eliminate noise and provide more reliable trade signals. Combine it with trend and volatility filters, and you have a powerful indicator in your trading toolkit.
Experiment with the best settings for your chosen asset class, whether it’s gold, crypto, or stocks, and always practice sound risk management to maximise your trading success.