


Price charts play a crucial role in market analysis, and any change in their display can directly affect the accuracy of decision-making. Becoming familiar with the customization options and making proper use of metatrader chart settings in both versions 4 and 5 allows traders to view data more clearly and understand trends more effectively. This article provides a step-by-step guide on how to enhance your MetaTrader experience by adjusting chart appearance and using advanced tools, helping you conduct your analyses with greater confidence. Stay with us until the end to explore the full guide.

- Customizing charts makes market analysis easier and more accurate by aligning with each trader’s personal style.
- Proper use of visual tools such as colors, profiles, and templates creates a smoother and more professional MetaTrader experience.
- Optimizing metatrader chart settings has a direct impact on improving platform speed and reducing potential errors.
- Combining analytical tools with well-adjusted chart settings provides a reliable foundation for making informed trading decisions.
What Is a Chart in MetaTrader and Why Are Proper Settings Essential?
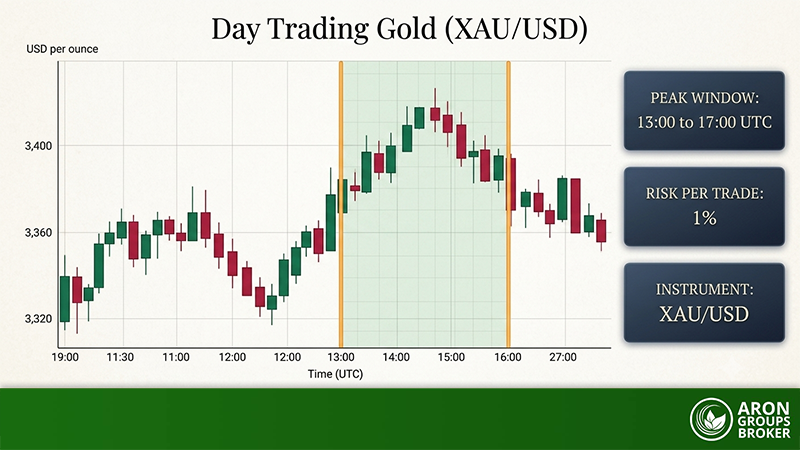
A chart in MetaTrader is simply a visual representation of price in forex market over time, displaying the open, high, low, and close (OHLC) levels for each period. This visualization allows traders to examine price movements more intuitively, recognize trends, spot volatility, and identify key market levels. For example, the platform can support up to 100 charts open simultaneously, giving traders flexibility in monitoring multiple assets at once.
If metatrader chart settings are not configured correctly, data may be displayed inaccurately, potentially misleading the analyst or slowing down the platform’s performance. By aligning chart settings with a specific trading strategy, traders can achieve greater precision in their analysis and reduce the risk of errors in decision-making. Since the foundation of technical analysis relies on clarity and accuracy in charts, having properly configured charts is considered one of the core requirements for successful market analysis.
Types of Charts in MetaTrader
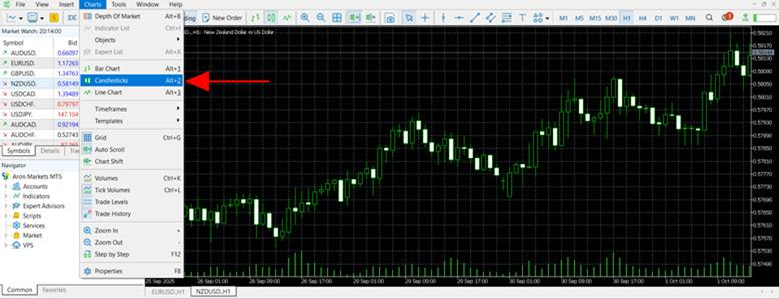
The MetaTrader platform offers three primary chart types, each presenting price data in a different way. Choosing the right one helps ensure that information is displayed clearly and analysis can be carried out with greater precision. Understanding these types of charts is also one of the most important steps in customizing and optimizing metatrader chart settings.
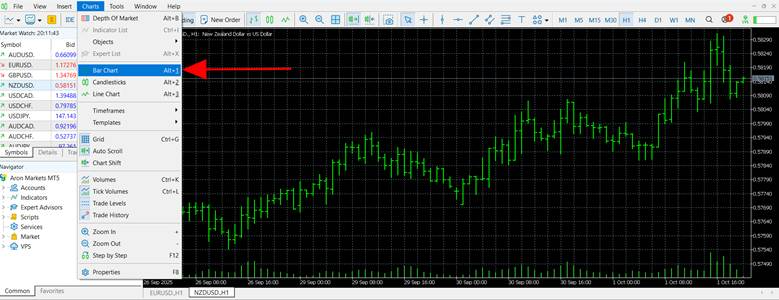
Bar Chart
The bar chart is one of the older and more traditional chart types used in financial markets. Each bar represents four key data points: the opening price, closing price, high, and low within a given period. Classic analysts often use it to study price ranges over time. However, compared to candlestick charts, bar charts offer less visual clarity, making quick recognition of trends more challenging.
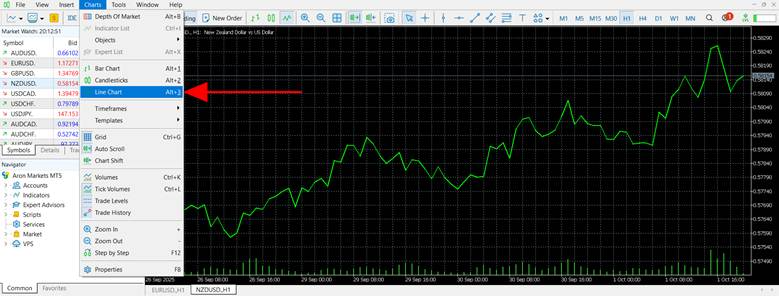
Line Chart
In a line chart, only the closing prices of each time period are plotted, and these points are connected to form a continuous line. Its simplicity makes it popular among beginners who want to get a broad view of market trends. The drawback is that it ignores the open, high, and low prices, which means it cannot capture the full detail of market fluctuations.
Candlestick Chart
Candlestick charts are by far the most popular format in MetaTrader. Each candle displays the open, high, low, and close values, with the body of the candle showing the difference between the open and close, and the wicks (or shadows) representing the highest and lowest prices.
Beyond just providing detailed data, candlestick charts visually reflect the balance of power between buyers and sellers, making them indispensable for technical analysis. Because of their clarity and psychological insights, candlesticks are a central feature in the optimization of metatrader chart settings, and many well-known patterns such as Doji or Engulfing formations are defined on this type of chart.
Basic Chart Settings in MetaTrader 4 and 5
After selecting the appropriate chart type, it is essential to adjust the basic chart settings so that the display of data matches the chosen trading style. This stage acts as the beginning of a technical analysis process and serves as the foundation for further customization. If this part is not configured properly, even the most accurate charts may fail to provide useful information for analysis.
Changing the Timeframe
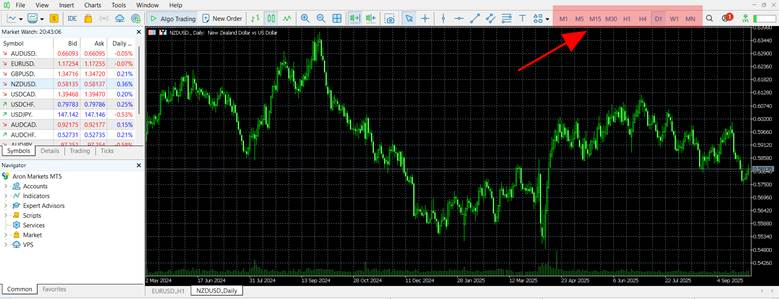
A timeframe represents the time interval that each candlestick or bar covers. In MetaTrader, traders can choose from multiple timeframes, ranging from one minute to one month. Short-term traders and scalpers typically prefer smaller timeframes because they reveal rapid price movements more effectively.
On the other hand, swing and long-term traders often rely on larger timeframes such as the four-hour or daily charts. Choosing the right timeframe is a crucial aspect of metatrader chart settings, as it changes the perspective of the analysis and makes trend recognition more straightforward.
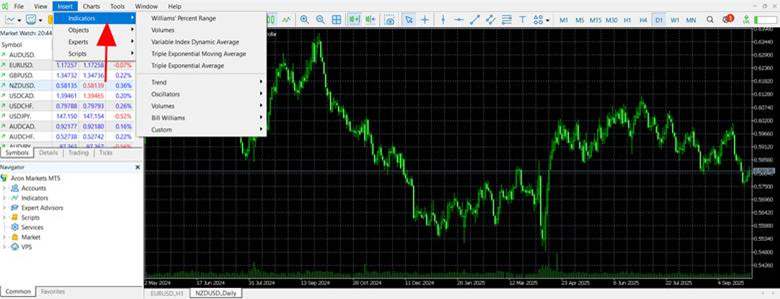
Adding Indicators to the Chart
In both MetaTrader 4 and 5, indicators can be added via the Insert menu or directly from the Navigator panel. Once placed on the chart, each indicator can be customized by adjusting line colors, calculation periods, and other parameters. Many traders also turn to resources such as mql5.com to download or create custom indicators, ensuring their toolkit is tailored to their specific strategy.
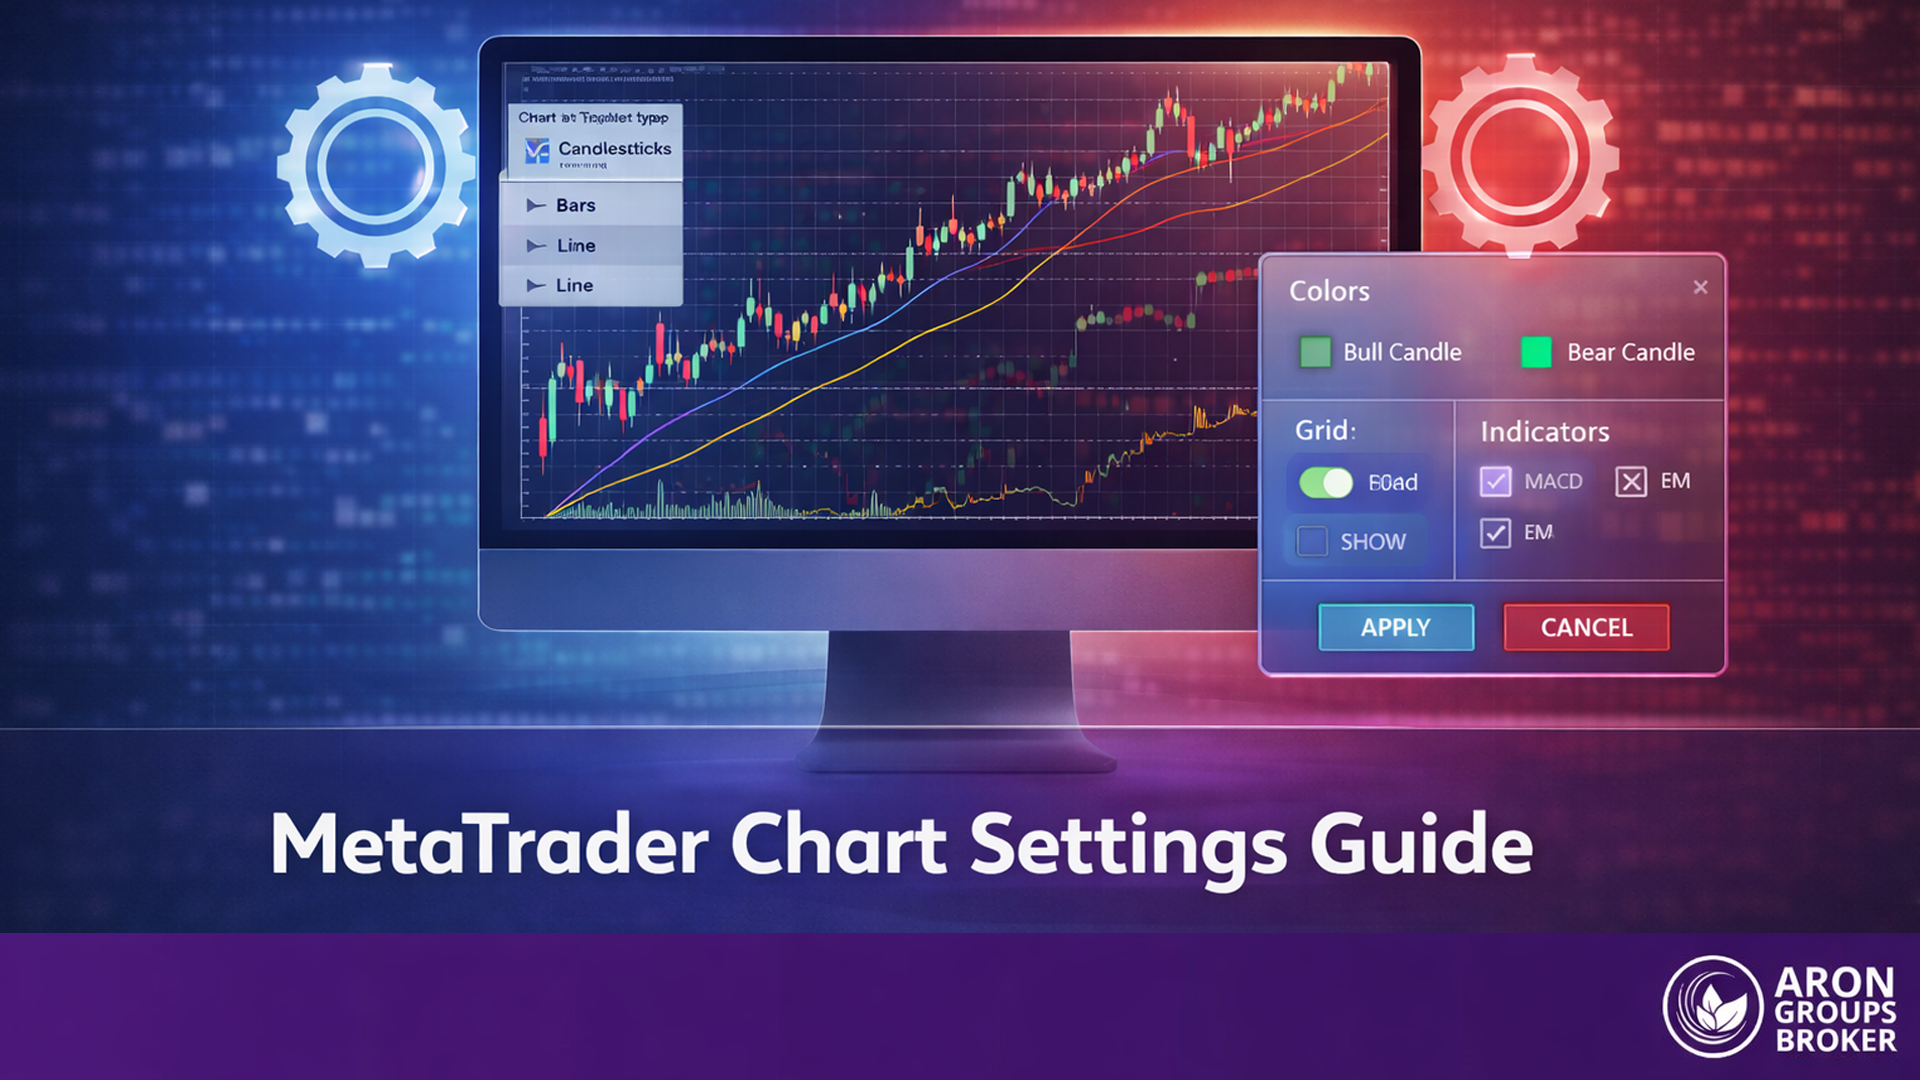
Changing Colors and Chart Templates
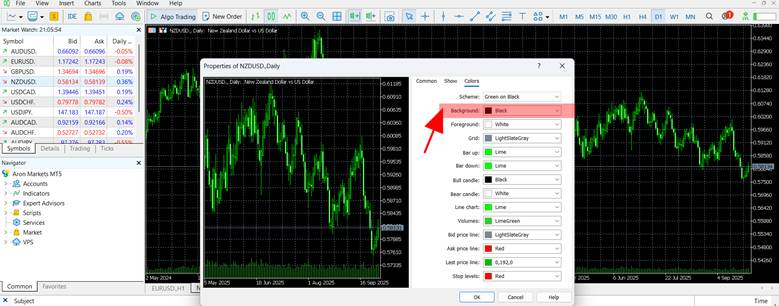
To change candlestick or background colors, simply right-click on the chart and select Properties. Under the Colors tab, you can adjust the background, bullish candles, bearish candles, and other visual elements.
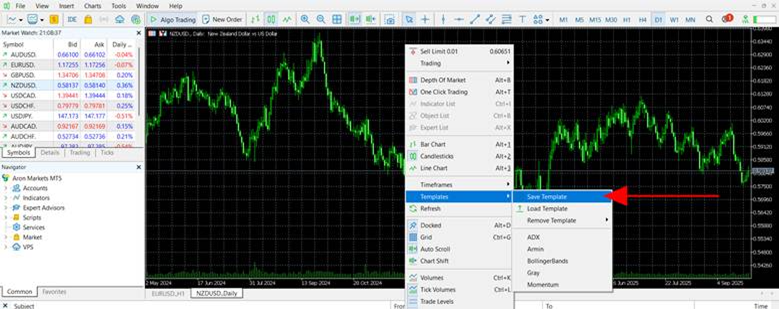
Once your preferred setup is created, you can save it as a template by right-clicking on the chart and choosing Template > Save Template. Give the template a name, and later you can reapply it on other charts using Template > Load Template. If you want this design to be the default for all new charts, save it under the name DEFAULT.tpl.
Templates save valuable time, allow quick access to personalized chart appearances, and ensure consistency across different charts. This makes them a core feature of metatrader chart settings, especially for traders who rely on multiple instruments and strategies.
Customizing Chart Appearance in MetaTrader 4 and 5
The appearance of a chart is one of the most important factors for both the speed and accuracy of analysis. When price data is displayed clearly and in an organized way, traders can make better-informed decisions. Both metatrader4 and metatrader5 provide a wide range of options for adjusting colors and saving templates, making it easy to personalize the trading environment. These features are a vital part of metatrader chart settings and play a major role in creating a comfortable and efficient workspace.
Changing Candlestick Colors
To adjust the colors of bullish and bearish candles, simply right-click on the chart and select Properties, or press the F8 key. In the Properties window, go to the Colors tab. The Bull Candle and Bear Candle options control the appearance of upward and downward candles, and they can be replaced with any preferred color. Choosing colors with high contrast is strongly recommended, as it increases chart visibility and makes it easier to identify market trends at a glance.
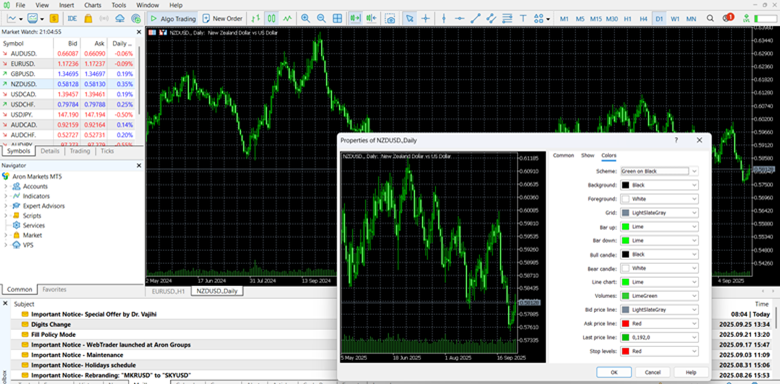
Changing the Background
In the same Properties window under the Colors tab, the Background option allows you to switch the chart background. Some traders prefer a white background for better visibility of lines and indicators, while others choose dark backgrounds to reduce eye strain during long trading sessions. What matters most is maintaining sufficient contrast between the background and candlesticks so that all chart elements remain clear and easy to read.
Saving and Loading Templates
Once you have customized a chart to your liking, you can save those settings as a template. To do this, right-click on the chart, go to Template, and select Save Template. Assign a name to your template, and later you can apply it to other charts by selecting Load Template from the same menu. If you save the template with the name default.tpl, every new chart you open will automatically use these settings. This feature saves time, ensures consistency, and is one of the most practical aspects of metatrader chart settings.
Advanced Chart Settings in MetaTrader
Advanced chart settings are designed for traders who want more detailed control over their charts. At this stage of metatrader chart settings, tools such as grid management, zoom, scroll, and the display of trade levels become important to keep charts both efficient and uncluttered.
Once a trader has mastered the basic adjustments, moving on to advanced settings provides greater precision and a cleaner layout. For professional users, these options are essential, as they enhance analysis speed and improve usability. Platforms like metatrader5 offer even broader customization, giving traders more flexibility to create their ideal chart setup.
Enabling or Disabling Grid Lines and Volumes
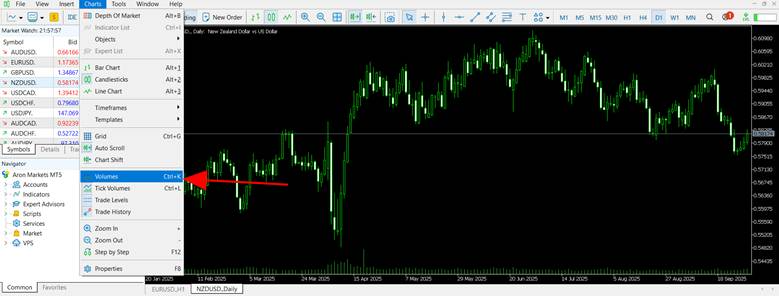
To manage grid lines, simply use the keyboard shortcut Ctrl + G, which toggles the background grid on or off. Some traders find it helpful, while others prefer to remove it to avoid distractions. Trade volume, or tick volumes, can be activated from the Charts menu and displayed at the bottom of the chart. Whether to show or hide these elements depends entirely on the trader’s analytical preferences.
Scrolling and Zooming on the Chart
Charts can be zoomed in and out using the mouse wheel, and holding down the Ctrl key while scrolling provides finer control over magnification. Horizontal scrolling can be done by dragging the chart with the mouse or by using the toolbar’s Auto Scroll option, which keeps the chart locked on the latest price action. The left and right arrow keys also allow smooth navigation across the chart’s history.
Displaying Order and Trade Levels on the Chart
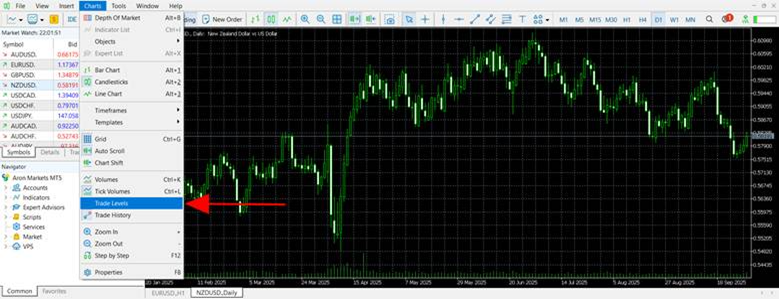
To see stop loss, take profit, and pending order lines directly on the chart, the Trade Levels option must be enabled. When active, these levels appear visually, allowing traders to manage their open positions more intuitively. Adjustments can be made simply by dragging the lines on the chart. In metatrader5, this feature is found within the chart settings, offering seamless integration for monitoring and modifying trade positions.
Using Analytical Tools on Charts in MetaTrader
Analytical tools help traders better understand market trends and identify precise entry and exit points. When combined with proper metatrader chart settings, these tools transform charts into a clear decision-making framework, making analysis more accurate and efficient.
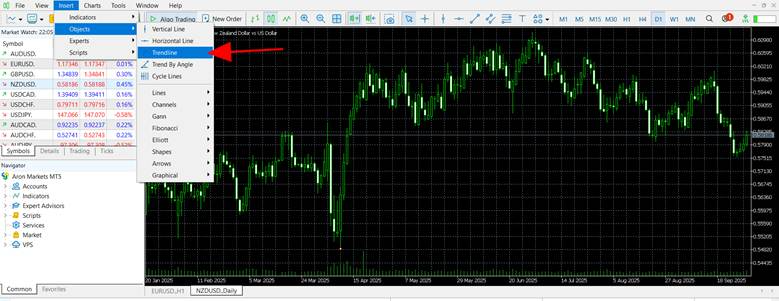
Drawing Trendlines and Channels
To draw a trendline, select the Trendline tool from Insert → Objects → Trendline, then mark the start and end points directly on the chart. Similarly, the Channel tool works by creating a parallel line to form a price corridor. Both tools are widely used to identify the overall market direction and highlight potential reversal zones, making them essential for visual market structure analysis.
Fibonacci Tools in MetaTrader
The Fibonacci Retracement tool is commonly used to identify potential price retracement areas. It can be accessed through Insert → Objects → Fibonacci → Retracement, and applied by marking the start and end of a price move. Standard levels such as 23.6%, 38.2%, 50%, and 61.8% appear on the chart, often acting as support or resistance zones. In metatrader5, these levels can be fully customized in terms of values, labels, and colors to align with the trader’s personal strategy.
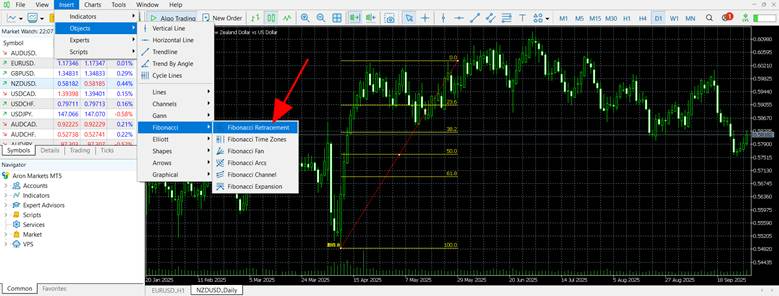

According to Babypips, combining Fibonacci retracement with a trendline can highlight stronger convergence zones, increasing the likelihood of price reaction at those levels.
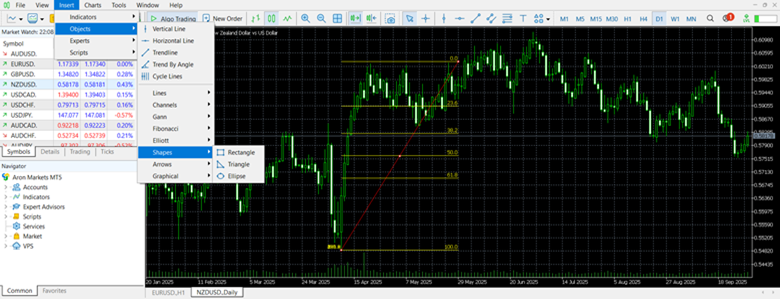
Adding Shapes and Text
For note-taking or emphasizing important areas on the chart, tools like rectangles, circles, arrows, and text can be added. These are available under Insert → Objects → Shapes. By clicking and dragging, traders can easily highlight zones, mark breakout areas, or add reminders directly on the chart. Using shapes and annotations helps keep charts organized and allows key insights to be reviewed quickly.
Using Profiles to Save Different Setups
Profiles in MetaTrader allow traders to manage multiple charts simultaneously, serving as a type of customizable workspace that can be saved and reloaded when needed. By navigating to File > Profiles > Save As, you can create a profile that stores all currently open charts along with their respective timeframes, indicators, and color schemes.
This feature is particularly useful for traders who apply different strategies. For example, one profile can be configured for scalping with lower timeframes and fast indicators, while another can be set up for long-term trading with daily or weekly charts. Switching between profiles takes just a few clicks, helping traders adapt quickly without reapplying settings from scratch. Using profiles not only improves workflow efficiency but also adds more organization to metatrader chart settings, saving valuable time during active trading sessions.
According to TradingPedia, in MetaTrader 4 profiles can be managed not only through the File → Profiles menu but also directly from the status bar, which allows for faster switching between different workspaces.
How to Reduce Lag and Improve MetaTrader Speed with Chart Settings
When too many charts or large volumes of historical data are loaded, the platform’s performance can slow down noticeably. To prevent this, it is recommended to adjust the Max bars in chart option under Tools > Options > Charts to around 5,000, which reduces the workload on your system while still providing sufficient data for analysis.
Closing unnecessary charts and keeping only the active ones open also helps keep the platform lighter and more responsive. In addition, restarting the platform daily frees up memory and ensures smoother operation. These practices are among the most effective ways to optimize metatrader chart settings for better performance, especially when running multiple strategies or working with resource-intensive indicators.
Customizing MetaTrader for Your Trading Strategy
Every trader needs to adjust charts differently depending on their strategy. For instance, in a trend-following approach, using moving averages is essential to identify market direction, while in breakout strategies, combining indicators with tools such as support and resistance levels may be more effective.
Testing these setups with the Strategy Tester allows traders to evaluate the strengths and weaknesses of each method before applying them to live markets. By making these tailored adjustments, customization within metatrader chart settings ensures that charts align precisely with the trader’s individual style, leading to more consistent and confident decision-making.
According to TradingOnRamp, when configuring indicators based on a specific strategy, it is recommended to first perform a backtest using historical data. This ensures that the effectiveness of the settings is evaluated before applying them on a live chart.
Conclusion
Properly configured charts make trends easier to recognize, speed up the analysis process, and reduce the risk of errors in decision-making. Familiarity with customization tools and consistent practice allows every trader to create an optimized trading environment tailored to their needs. For deeper learning, it is always recommended to follow reliable educational resources and take practical experience seriously. Ultimately, mastering metatrader chart settings can make a significant difference in the overall quality and effectiveness of trading performance.