


Have you ever noticed how prices in markets sometimes jump quickly, skipping over certain levels like a space? That’s a liquidity void. a spot where few trades occur due to imbalances caused by big players, often in ICT liquidity void setups.
It creates price inefficiency zones that pull prices back, offering chances in liquidity void trading. Unlike a fair-value gap, these signals indicate smart-money imbalances in forex. Curious how to spot and use them? Read on to discover simple strategies for beginners.

- Recognising a liquidity void in ICT trading highlights market gaps where price may return, offering beginners a way to anticipate reversals without complex tools.
- ICT liquidity void setups emphasise institutional imbalances, enabling traders to align with smart money flows for more informed decisions in volatile sessions.
- Effective liquidity void trading involves waiting for retests, which can enhance entry precision while managing exposure in major currency pairs.
- Understanding what liquidity void versus fair value gaps is helps avoid common pitfalls, fostering disciplined approaches in global financial markets.
Getting to Grips with Liquidity Voids
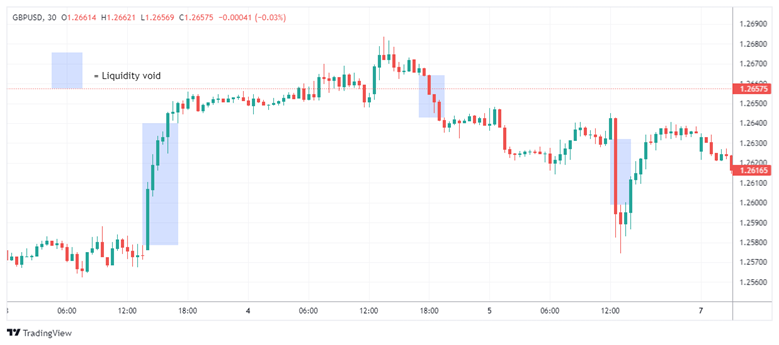
Liquidity voids represent areas on price charts where rapid movements occur due to insufficient orders, creating opportunities for traders to anticipate reversals.
These zones highlight market inefficiencies that often draw prices back for rebalancing. Beginners can start by recognising them as skipped price levels that signal potential entry points.

What Exactly Is a Liquidity Void?
If you are wondering what a liquidity void is, think of it as a price range with minimal trading participation.
The liquidity void, meaning centres on imbalance: buyers or sellers aggressively push the price, leaving behind an unfilled price zone.
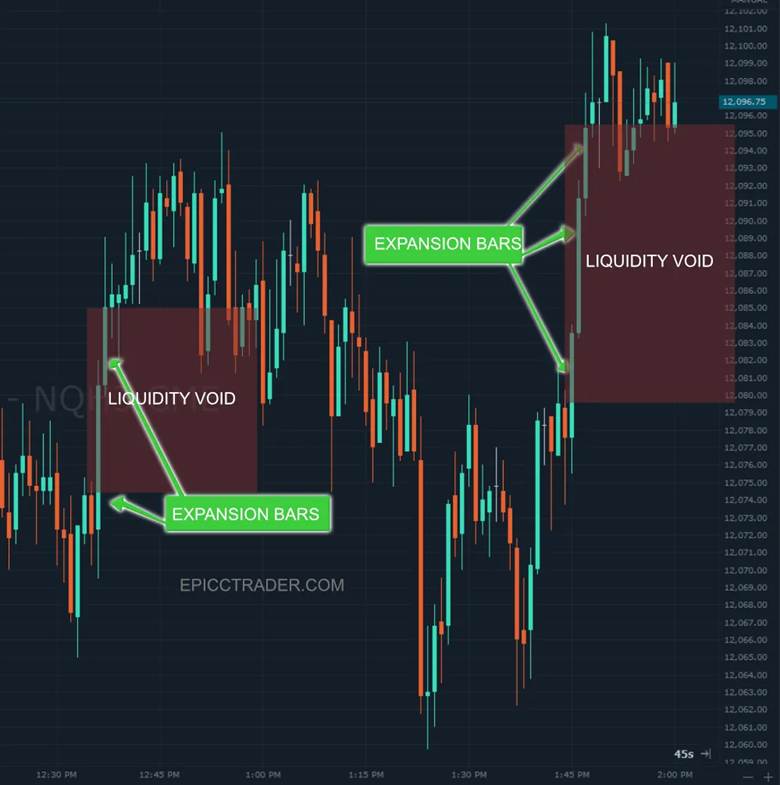
In chart terms, these areas often appear after wide candles or strong momentum bursts. Because fewer transactions occurred within that move, the market may later return to “fill” that gap in order flow.
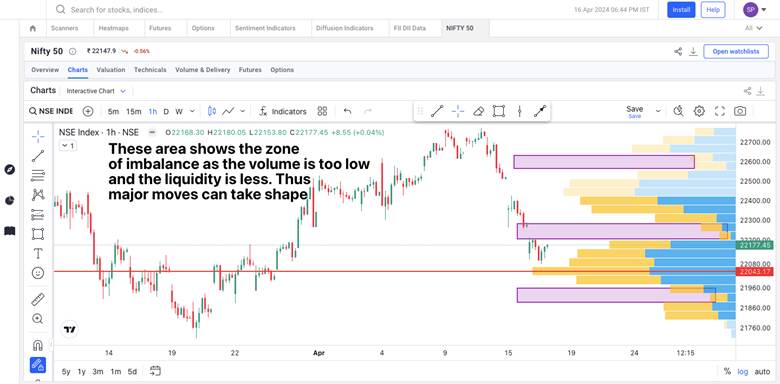
In volume-based tools, these zones may align with a low-volume node that forex traders identify on a volume profile chart.
A low-volume node reflects limited transactions at specific price levels, reinforcing the concept of skipped liquidity.
This creates an unfilled price zone that may later attract a price for filling. Such voids increase liquidity risk by amplifying volatility in thin liquidity areas.


Key Point:
Liquidity voids often form after sharp moves, but trading them requires confirmation to avoid false signals. Limit risk to 1% of capital per trade.
Understanding Liquidity Voids in Forex and Other Markets
A liquidity void in forex markets behaves slightly differently from equities or cryptocurrencies. Because forex operates 24 hours a day during the trading week, liquidity conditions shift depending on session overlap and macroeconomic releases.
In liquidity-void forex scenarios, strong economic data releases can create a liquidity vacuum that forex traders recognise as rapid displacement.
These fast moves often occur during the London session when volume surges.
In contrast:
- Stocks may show traditional exchange gaps due to opening hours.
- Crypto markets, although 24/7, can experience voids during weekend liquidity drops.
- Forex voids are often event-driven rather than session-opening gaps.
Q: How do voids differ in forex?
A: In forex, voids often align with major news, creating larger gaps than in stocks due to continuous trading; crypto voids resemble forex but amplify from decentralised exchanges. Always use stop losses to manage risks, as sudden spikes can lead to capital loss. Consider practising on a demo account first.
How ICT Views Liquidity Voids
Within ICT methodology, a liquidity void is not random. The ICT liquidity void theory suggests that large institutional participants, often referred to as “smart money,” create rapid displacement to trigger retail stop-loss clusters.
Under liquidity void ICT logic, these price moves represent engineered inefficiencies. The initial aggressive move produces a smart money imbalance, leaving behind a zone price that may be revisited later.
This interpretation fits within the broader smart money concept, where institutional order flow drives market structure.
According to TradingFinder, voids form post-consolidation breakouts, highlighting institutional footprints.
Key Insight:
ICT treats voids as magnets for price return, but only with confluence from higher timeframes to enhance reliability.
How Liquidity Voids Appear in the Market
To understand a liquidity void properly, traders must examine how it forms on live charts. These voids do not appear randomly. They develop when aggressive buying or selling overwhelms available orders at specific price levels.
This creates a structural gap in participation, often visible as a sharp imbalance followed by little trading activity inside the move.
A liquidity void in the ICT style occurs when the price breaks out of a consolidation phase and moves aggressively in one direction without returning.
Price Inefficiency Zones and Thin Liquidity Areas
A liquidity void in trading often forms inside what traders call a price inefficiency zone.
This happens when orders are not evenly distributed, leaving a thin liquidity area where price travels too quickly for balanced transactions.
These inefficiencies are typically visible through:
- Rapid wicks on candles show rejection after fast movement
- Wide-bodied candles with minimal overlap
- Volume drops immediately after a strong expansion
- Low participation between swing points
Tip:
Thin liquidity areas are more common during session transitions and lower-volume periods, increasing volatility risk. Consider using tools like a spread indicator to gauge depth before entering trades.
Sudden Price Moves and Displacement Voids
Another common formation mechanism is the displacement void. This occurs when a fast price move, forex traders observe,e pushes the price aggressively in one direction, sweeping through clusters of pending orders.
In liquidity void trading, these areas appear after:
- Major economic news releases
- Breakouts from consolidation ranges
- Stop-loss cascades above or below swing highs
The key factor is speed. When price accelerates without sufficient counter-orders, a liquidity void forms because the market did not transact evenly across that range.
Q: What triggers sudden price moves leading to voids?
A: Events like interest rate announcements or an economic crisis can spark fast price moves in forex, forming displacement voids by clearing order clusters.
Always incorporate risk management strategies, such as stop losses, since trading CFDs involves risk of capital loss.
Beginners should practise on a forex demo account to observe these without real exposure.
Spotting Imbalances and Smart Money Activity
Recognising imbalance in price action is essential for identifying a liquidity void early. Traders analyse candle structure, volume behaviour, and market structure breaks to detect where the price moved too efficiently in one direction.
Key signs include:
- Consecutive large directional candles
- Minimal pullbacks within a move
- Sharp breaks of structure
- Low relative volume between swing points
In many ICT models, these imbalances are linked to institutional positioning.
A smart money imbalance may occur when larger participants accumulate or distribute positions while retail traders react emotionally.
According to Medium, voids occur from aggressive repricing after liquidity absorption, appearing as air pockets on charts.
Understanding the liquidity void meaning requires recognising that these formations reflect structural inefficiency, not guaranteed reversals.
Traders must assess broader market conditions before assuming price will rebalance an imbalance in price action.
Finding Liquidity Voids in Your Trading
Traders can identify liquidity voids by scanning charts for skipped price areas. These zones signal potential reversals in forex markets. Practical tools like volume profiles help spot them accurately.
Chart Clues for Unfilled Price Zones
When asking what is a liquidity void in trading, one of the best starting points is simply watching how the price behaves on different timeframes.
Certain patterns frequently signal that the price moved through an area without balanced participation, creating a price delivery imbalance that may later attract attention from other traders.
| Clue | Description | Example |
|---|---|---|
| Rapid wicks on candles | Long upper or lower wicks indicate price rejection after fast moves | Candle with a long wick after a strong directional move |
| Wide-range candles with minimal overlap | Large bodies show price travelled far with little counter-trading | Bullish engulfing candle with no pullbacks |
| Gaps between sessions (higher TF) | Areas with empty space on weekly/daily charts | Weekend forex gap |
| Thin consolidations are breaking quickly | Small ranges followed by explosive movement | 15-min squeeze breakout |
According to LuxAlgo, liquidity voids are characterised by sharp price moves that leave behind little trading activity, often reflecting deeper imbalances than smaller patterns like fair value gaps.
Key Insight:
Always zoom out to higher timeframes. Unfilled zones there often attract prices more strongly. Practise spotting them on a forex demo account.
Low Volume Nodes and Delivery Imbalances
Volume profile tools can enhance your ability to confirm areas with weak participation. A low-volume node forex reflects a price level where few trades occurred relative to surrounding areas.
These nodes often coincide with liquidity voids, providing extra confidence that the market skipped these levels.
Low-volume nodes can be seen as horizontal gaps in volume profile histograms, which act like invisible highways where price can travel quickly.
When combined with rapid directional movement, these nodes often highlight price delivery imbalance, a situation where orders did not match evenly across price.
On Volume Profile, low volume regions help anticipate where price moves fast and faces little resistance.
Liquidity Voids vs Fair Value Gaps (FVG) – Key Differences
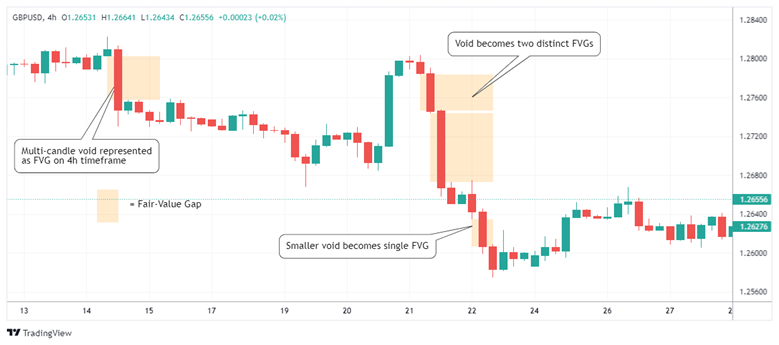
Liquidity voids represent broader price skips from aggressive sweeps. In contrast, fair value gap focuses on three-candle imbalances.
Voids cover multiple candles with low volume. FVG are smaller, often filling quicker in ranging markets.
The liquidity void vs fair value gap lies in scale and duration. Liquidity void vs fvg shows voids as larger inefficiencies. According to TradingView, FVGs fill quicker than voids.
Use the comparison table below to clarify these differences:
| Feature | Liquidity Void | Fair Value Gap (FVG) |
|---|---|---|
| Scope | Large, multi-bar skipped pricing | Defined 3-candle imbalance |
| Visual | Wide range, minimal overlap | Gap between candle wicks |
| Fill likelihood | Longer, often slower | Faster, smaller imbalance |
| Typical timeframe | Higher TF possible | Any TF, but more frequent on lower TF |
A fair value gap represents a narrower imbalance and may fill more quickly, while a liquidity void covers larger unfilled price zones, often reflecting a more significant market imbalance.
Trading Strategies That Work with Liquidity Voids
A liquidity void can offer structured trading opportunities, but only when approached with discipline and confirmation.
These zones reflect previous imbalance and may act as magnets for price retracement. However, not every void fills, and strong trends can continue without returning.
The goal of liquidity void trading is to combine structure, timing, and risk control rather than predict reversals blindly.
When and How to Enter After a Liquidity Void
The most common tactic is to wait for the price to revisit the thin liquidity area created by the original expansion. Entering immediately after a strong impulse increases exposure to volatility and slippage.
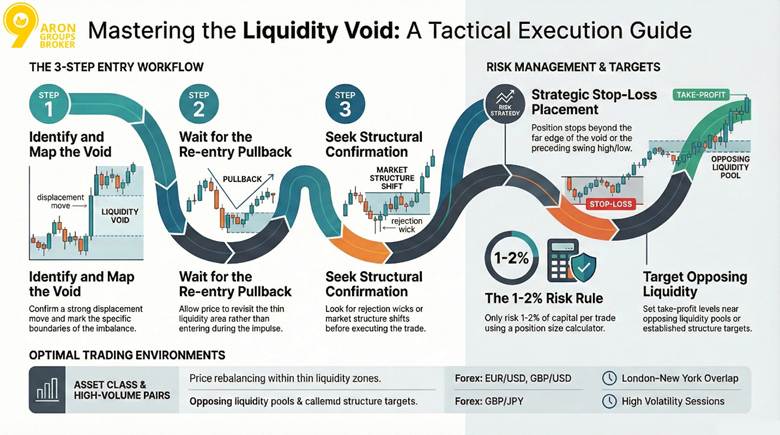
Follow these structured steps:
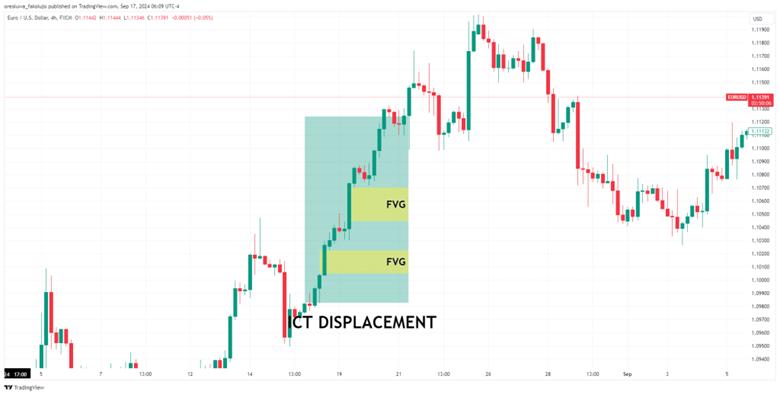
- Confirm the liquidity void by identifying a strong displacement move with minimal overlap.
- Mark the boundaries of the void on your chart.
- Wait for a pullback into the imbalance zone.
- Look for confirmation, such as rejection wicks or structure shifts.
- Enter with a defined stop-loss placement.
This approach reduces emotional entries and aligns with the logic behind liquidity void trading, allowing the price to rebalance before continuation.
Tip:
Avoid trading voids during major economic announcements unless your strategy specifically accounts for high volatility.
Setting Stop Losses and Take Profits Around Voids
Risk management defines the success of ict liquidity void strategies more than entry timing. Stops should never sit inside the imbalance, as the price may fluctuate while rebalancing.
For a displacement void, consider placing:
- Stop-loss beyond the far edge of the void
- Stop-loss beyond the swing high or low preceding the imbalance
- Take-profit near opposing liquidity pools or structure targets
When analysing smart money imbalance behaviour, institutions often return to mitigate part of a move before continuing in the dominant direction. This is why stops must account for potential whipsaws.
Key Point:
Always set stops to avoid whipsaws; risk only 1-2% per trade. Use a position size calculator for precision.
For additional guidance on disciplined trade management, review risk management principles before applying void strategies.
Applying Liquidity Void Tactics in Forex
A liquidity void forex setup works best in highly liquid currency pairs where volatility is sufficient to create a meaningful imbalance.
Major pairs such as EUR/USD, GBP/USD, and GBP/JPY often produce visible voids during session overlaps.
In liquidity-vacuum forex conditions, especially during the London–New York overlap, sharp expansions may leave clear imbalance zones. Traders should monitor economic calendars to avoid entering during unpredictable spikes.
Q: Best pairs for voids?
A: Volatile pairs like GBP/JPY and GBP/USD often produce clearer liquidity void structures. However, always monitor macroeconomic news releases to avoid false signals caused by temporary liquidity shocks.
Advanced Ideas and Common Pitfalls
For traders familiar with basic setups, liquidity voids offer layers of complexity through institutional tactics.
These include engineered vacuums that manipulate order flow and inefficiencies that signal hidden risks. Mastering them requires attention to market context to sidestep traps in volatile conditions.
Liquidity Vacuums vs Standard Market Gaps
Liquidity vacuums emerge as ICT-specific zones where rapid institutional sweeps create voids during active sessions, often in forex.
This differs from standard gaps, which form due to market closures and lack the same pullback potential.
Liquidity void in trading leverages these vacuums for entries, as price seeks to resolve inefficient price delivery.
Unlike gaps that may remain unfilled, vacuums attract retests due to underlying order imbalances. In practice, vacuums form intraday from news-driven volatility, while gaps appear in stocks over weekends.
Vacuums create a vacuum of liquidity where quick moves leave no equal orders. According to Bookmap, vacuums form air pockets during spikes, distinct from closure gaps.
Q: Can liquidity vacuums predict major shifts?
A: Yes, they often precede reversals in thin markets, but during an economic crisis, increased volatility can extend them, raising liquidity risk. Monitor for confluence to avoid premature trades.
Understanding Displacement Voids and Price Inefficiencies
Displacement voids manifest as sharp, one-sided surges that bypass levels, driven by institutional entries post-news.
These create price inefficiency zones where no balanced discovery occurs, setting up for potential fills. Liquidity void meaning extends here to areas of absent counter-orders, amplifying momentum temporarily.
Traders identify them through consecutive candles lacking retracement, often in major pairs. Such voids highlight institutional footprints, but require higher-timeframe alignment for validity.
voids from displacements reflect market inefficiency without opposite flow. displacements infuse momentum, leaving inefficiencies behind.
More Info:
These voids often precede trends, but fading them risks losses. Factor in interest rate changes, as they trigger displacements in currency markets.
Mistakes Traders Make with Liquidity Voids
Even experienced traders misinterpret what a liquidity void is when applying it in real time. The most common errors stem from impatience and overconfidence.
Frequent mistakes include:
- Entering before structural confirmation
- Ignoring higher timeframe bias
- Overleveraging during a visible imbalance in price action
- Treating every low-volume node forex area as a reversal signal
- Trading voids without assessing the volatility regime
Why Fading Strong Momentum Can Be Risky
Countering robust moves near voids exposes traders to crashes, as liquidity void vs fvg reveals voids endure longer in trends.
Smart money imbalance sustains direction, trapping faders who bet on quick reversals. Fair value gap may resolve faster, but voids in momentum phases amplify drawdowns.
Risk escalates when volatility spikes post-declines, leading to asymmetric losses. Consider if you understand CFD risks—trading involves capital loss potential, especially in prop trading environments.
Warning:
Momentum crashes hit hardest after declines; incorporate common trading mistakes avoidance by scaling exposure dynamically.
Multi-Timeframe Insights and Void Invalidation
Integrating multiple timeframes provides a comprehensive view of liquidity voids, revealing how institutional flows align or diverge across scales.
This approach enhances confirmation while highlighting scenarios where voids lose relevance due to overriding market forces.
Why Multi-Timeframe Analysis Matters for Liquidity Voids
Multi-timeframe analysis strengthens ict liquidity void setups by ensuring alignment between short-term entries and long-term structure.
Liquidity void ICT emphasises checking higher frames for overarching trends that validate lower-frame voids, reducing noise from isolated imbalances.
Price delivery imbalance on daily charts often overrides minor voids seen on hourly ones, guiding traders to prioritise macro context.
| Timeframe | Role |
|---|---|
| Weekly | Establishes macro bias and major liquidity pools |
| Daily | Identifies directional momentum and key imbalances |
| Hourly | Pinpoints precise entries near voids with confluence |
| 15-Minute | Refines timing for executions in active sessions |
According to FXOpen, higher timeframes offer clearer void validity through concentrated activity. Combining frames refines setups by confirming institutional shifts.
Q: How does multi-timeframe help avoid false voids?
A: It filters noise; a void on an hourly basis may be invalidated if daily shows strong trend continuation. In prop trading, this prevents challenge failures from isolated signals.
When a Void Doesn’t Fill – Understanding Invalidation
Voids remain unfilled when dominant trends bypass them, often in high-momentum phases where structure breaks.
Liquidity void ict views this as invalidation, signalling a shift away from thin liquidity areas toward new equilibria. Unfilled price zones persist if volatility sustains direction, bypassing retests.
According to Forex Factory, voids stay open under persistent momentum, requiring structural assessment.
Key Insight:
Invalidation signals shift; exit right away to preserve capital. Monitor for imbalance in price action breaks, avoiding fomo in trading traps.
Using Liquidity Voids Alongside Other ICT Tools
Liquidity voids gain power when layered with complementary ICT elements, creating high-confluence setups that align institutional flows.
This integration sharpens entries in forex by merging voids with imbalances and order clusters, though always with risk management in mind.

Combining Fair Value Gaps with Price Imbalances
Fair value gaps often nest within liquidity voids, providing confirmation through smaller-scale inefficiencies.
Liquidity void vs fair value gap highlights how voids encompass broader skips, while gaps pinpoint precise imbalances in price action zones for retests. Use gaps to validate void strength, entering when the price approaches the overlap.
According to Babypips, ICT emphasises spotting imbalances where supply and demand diverge, aiding void analysis.
Smart Money Confluence and Void Setups
Layer voids with order blocks where institutions accumulate, boosting liquidity void trading reliability.
Smart money imbalance near voids signals reversals, especially when blocks form at void edges. This confluence elevates probability in ranging markets.
Voids indicate extreme order lacks, converging with the smart money concept for institutional insights.
Making the Most of Thin Liquidity Areas for Entries
Thin liquidity areas often emerge during low-volume sessions or after holidays when participants return slowly.
These conditions amplify the effects of imbalance because fewer resting orders exist, making the liquidity void in forex more pronounced.
When combining voids with other structures, consider entering after the price makes a controlled retracement into a thin liquidity area.
The presence of a low-volume node forex, where the volume profile shows minimal traded volume, reinforces the idea that the price will continue to seek deeper liquidity elsewhere.
More Info:
Thin areas post-holidays or during session transitions can amplify void behaviour, making retracement targets more predictable.
Always contextualise a liquidity void in forex with broader conditions. High-probability entry zones emerge when a void aligns with a trend, an order block, or a fair value gap within the same region.
conclusion
Understanding a liquidity void teaches traders patience and structure, as a liquidity void becomes clearer with practice rather than guesswork. Recognising liquidity void ICT patterns and price inefficiency zone behaviours helps traders avoid emotional reactions and improves timing. Integrating voids with economic calendars enhances foresight into volatility around key events. Practice these concepts on a demo account before live execution, and explore Aron Groups’ tools for risk-managed trading.


