icon icon Home
icon icon Accounts
icon icon Quick start
icon icon Symbols

How Momentum Scanners Spot Explosive Stocks Before They Go Parabolic

Author
Abe Cofnas
Abe Cofnas
calendar Last update: 15 April 2026
watch Reading time: 18 min

A momentum stock scanner is a real-time tool that picks up on sudden bursts in price movement, rising volume, and signs of breakout pressure; before the rest of the market catches on.

By the time a stock appears on a “top gainers” list, most of the early upside is usually already baked in. A momentum scanner helps you catch that early action by focusing on things like RVOL (relative volume), expanding volatility, float dynamics, and pressure near the high of the day.

This guide walks you through how to use a momentum scanner in a hands-on, practical way.

bookmark
Key points:
  • Momentum is a liquidity event, not just price acceleration.
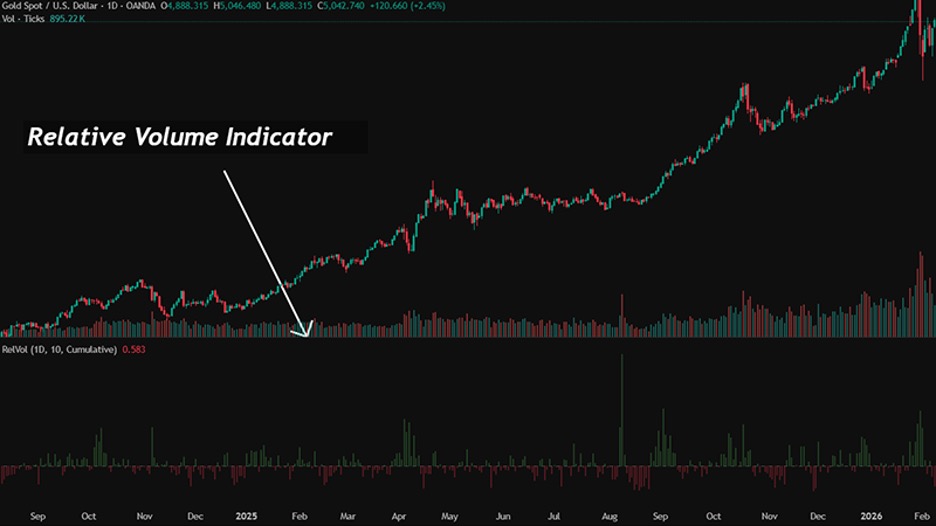
  • RVOL without structural compression is unstable.
  • Float rotation rate matters more than float size alone.
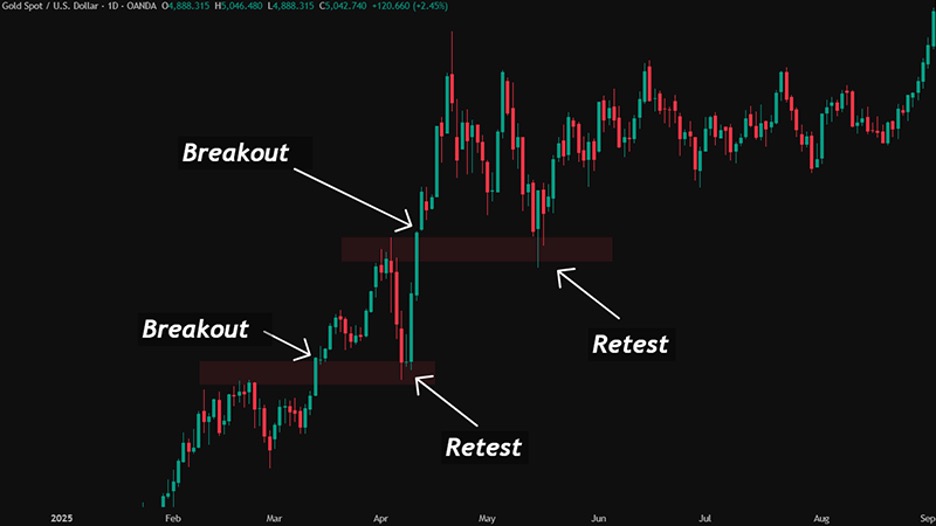
  • True HOD breakouts show higher lows into resistance before expansion.
  • Catalyst-driven momentum sustains longer when sector correlation confirms flow.
  • Risk-adjusted momentum trading prioritises liquidity depth and spread stability.

Understanding Momentum Scanners

A momentum scanner helps you spot sudden bursts of market activity as they happen, so you can focus on actual trade opportunities instead of endlessly scrolling through charts.

What Is a Momentum Scanner?

It’s a real-time tool that ranks stocks based on how quickly they’re moving, how unusual the trading volume is, and how much their price range is expanding. The scanner updates constantly and highlights stocks where interest and activity are picking up fast.

Most scanners look at key metrics like percent change, relative volume (RVOL), how much the price range is stretching, and pressure near the high of the day (HOD) to detect momentum early.

sms-star

Did You Know?

Most explosive stocks are detected by a momentum scanner before they appear on retail top gainers lists. By the time social media notices, early liquidity has already rotated.

Scanners vs Screeners: Key Functional Differences

A scanner works in real time. It shows you what’s happening right now. A screener, on the other hand, usually updates with a delay or only at the end of the trading day.

Screeners filter stocks based on fixed data points like market cap or valuation. Momentum scanners focus instead on fast changes in liquidity and volatility, which is what matters if you’re trading short-term moves.

sms-star

NOTES:

  • A screener finds potential candidates.
  • A momentum scanner catches real movement as it happens.
  • If you're trading intraday volatility, relying on a static screener means you'll always be behind the curve.

FeatureMomentum Scanner

Screener

Data Type

Real-time

Static or end of day

Purpose

Detect active movement

Filter by criteria

Use Case

Intraday trading

Research and swing

Speed

HighLow to Moderate

Why Momentum Matters for Active Traders

Momentum happens when there’s an imbalance in buying and selling, and more traders start jumping in. As that participation grows, prices can move quickly through key levels.

A real-time momentum scanner keeps you focused on the stocks where actual liquidity is showing up; not just theoretical setups, but real trades happening right now.

Mini Example: Spotting Early Strength on a Live Scanner

Imagine a stock doing nothing before the market opens, just moving sideways. Suddenly, RVOL (relative volume) spikes above 3.0. Then, the price breaks out of its opening range with strong, expanding candles.

The momentum scanner picks this up before the crowd notices, giving you a head start on a potential move.

Core Drivers Behind Market Momentum

Momentum builds when more traders start jumping in, creating an imbalance in buying and selling. When price breaks out of a tight range (compression) into a strong move (expansion), and the structure is clean, you’ve got the ingredients for a real momentum move.

Relative Volume (RVOL) and Early Momentum Signals

RVOL (Relative Volume) tells you how today’s trading activity compares to normal levels. When RVOL suddenly spikes, it signals unusual interest; often a clue that a move could continue.

Relative Volume

But don’t jump in just because RVOL is high. Look for a solid price structure too.

sms-star

Tips & tricks:

  • In fast-moving markets, volume usually shows up before the price takes off.
  • Strong RVOL plus clean structure increases your odds of catching a real breakout.
  • If the price is moving without strong volume behind it, the move probably won’t last.

Volatility Expansion and Range Breaks

Momentum really kicks in when the price breaks out of a tight range and starts moving with force. The best setups usually show a period of calm followed by strong, confident candles that follow through.

On the flip side, long wicks and wild, spiky moves often mean the price action is unstable or unreliable.

H3: Catalysts: Earnings, News, and Sector Rotation


For momentum to last, there’s usually a clear reason behind it, like earnings reports, breaking news, company guidance, regulatory changes, big-picture economic events, or sector-wide moves.

When a whole sector is moving (not just one stock), it’s a strong sign that the momentum has real backing and isn’t just a one-off spike.

stock market

Float Turnover and Liquidity Dynamics

A stock’s float (the number of shares available to trade) affects how fast it can move. But turnover, how quickly that float is being bought and sold, is what tells you what’s happening right now.

When turnover speeds up, it means ownership is shifting fast, and momentum can really start to build.

sms-star

Risk Warning:

  • Low-float stocks can jump 20% to 50% in just minutes.
  • But they can also get halted just as quickly.
  • Fast movement means more opportunity, but also higher risk if your execution isn’t sharp.


Q: Why do low-float stocks move faster?

A: Lower share supply means new demand pushes price harder, especially when liquidity is thin.

Mini Example: News Catalyst Triggering a Momentum Surge

A piece of news drops before the market opens. Suddenly, volume jumps, RVOL shoots past 4.0, and price gaps up through a key resistance level.

Once the market opens, buyers hold the line, and volatility expands. The scanner picks it up immediately because everything lines up: a strong catalyst, rising volume, and solid structure.

Essential Features of High-Performance Momentum Scanners

High-performance scanners combine fast data, selective filters, and alerts that match execution.

Real-Time Alerts and Live Tracking

Momentum moves fast, and if you’re late, the edge is gone.

A quality scanner needs to update instantly and send alerts without delay. Live tracking lets you see key signals, like percent change, rising RVOL, and accelerating price action—as they’re unfolding, not after the move is already over.

Gap Up and Gap Down Detection

Gaps are formed when a stock opens much higher or lower than its previous close; they can signal that the market is quickly re-evaluating a stock’s value.

A solid momentum scanner will catch these pre-market or market open gaps immediately. But catching the gap isn’t enough; you still need to confirm it with strong volume and price structure.

If the gap doesn’t have follow-through, it’s not real momentum; it’s just noise.

Q: Are gap-up stocks good momentum trades?

A: Yes, if the volume backs it up and price holds steady, especially above the pre-market high.

High-of-Day (HOD) Breakout Identification

When a stock breaks above its high of the day with strong volume and controlled price action, momentum can really kick in.

But not all breakouts are created equal. The best ones form after a period of tight, controlled movement near the highs, not from a sudden, vertical spike.

sms-star

Trading Tip:

  • The strongest breakouts come after tight consolidation just below the high.
  • If the price shoots up without structure, you’re likely chasing exhaustion, not real expansion.


Price Action and Relative Strength Filters

Just looking at the percent change isn’t enough because it doesn’t tell the full story.

Stronger signals come from:

  • Stocks showing relative strength compared to others,
  • Tight price action (compression) before the breakout,
  • A series of higher lows pressing up into resistance,
  • And a widening price range as the breakout begins.

Keep your filters simple and focused; too many rules can kill your trade opportunities.

Mini Example: Gap-and-Go Scanner Setup

Here’s what a simple momentum scan might look for:

  • The stock is up at least 5% from yesterday’s close.
  • RVOL is above 2.5 (showing strong participation)
  • Float is under 50 million (for speed and volatility)
  • It breaks above the pre-market high.

When all of these conditions line up, you’ve got a focused list of high-potential plays. It doesn’t guarantee success, but it increases your odds.

Stock Momentum Scanners

Stock momentum scanners zero in on equities that are making big, fast moves in both price and volume. They help you quickly spot the best intraday trading opportunities with high potential.

Best Momentum Scanners for Equities

The best momentum scanners aren’t always about brand names; they’re about performance.

Look for tools that offer Fast data feeds, Reliable alerts and Customizable filters.

Speed and reliability matter far more than fancy features or branding when it comes to real-time trading.

Low-Float and Small Cap Momentum Setups

Small-cap stocks with low float (under 50 million shares), RVOL above 2.0, and some range expansion can absolutely explode in price.

But with that speed comes real risk. These stocks can get halted mid-move, and slippage can be brutal if liquidity is thin.

sms-star

Always check liquidity before trading these names, it’s not optional.

HOD Breakouts and Intraday Continuation

You’re more likely to get a strong continuation move when a stock tightens up near its high of the day, then breaks out cleanly with volume.

But if the price action lacks structure, those breakouts often turn into fakeouts or traps.

H3: Technical Indicators: RSI, MACD, and Volume Signals

Tools like the Relative Strength Index (RSI), Moving average convergence/divergence (MACD), and volume analysis can help confirm a trade, but they don’t work well as triggers, especially in fast-moving markets. Use them lightly; if you rely too much on indicators, you’ll often miss the move.

sms-star

Practical reminders:

  • Indicators are for confirmation, not entry.
  • If your trade setup needs multiple indicators to feel “safe,” you’re probably already too late.


Q: Should I rely on RSI or MACD for momentum scanning?

A: Use them as confirmation only. Price structure and volume expansion are more important intraday.

Mini Example: Small Cap HOD Breakout Trade

How Momentum Scanners Spot Explosive Stocks Before They Go Parabolic

After the open, the stock forms a base. Then RVOL climbs above 3.0, and you start seeing higher lows pushing up near the high of the day (HOD).

Finally, there’s a clean breakout, volume expands, confirming the move.

  • Entry: On breakout confirmation
  • Stop loss: Just below the base
  • Exit: Take partial profits as the stock extends

It’s a structured trade based on momentum and price action.

Crypto Momentum Scanners

Crypto momentum scanners track continuous flow and sudden liquidity shifts across exchanges. Their job is to surface high-volatility opportunities.

Continuous Momentum Cycles and Exchange Flows

Because crypto markets never officially “open” or “close,” momentum tends to come in waves during different global trading sessions.

Scanners track these bursts in volume and sudden breakouts. But be careful, thin order books can create misleading signals, so always check liquidity depth before acting.

Breakout Scanners for High-Volatility Tokens

Crypto scanners typically look for quick percentage changes over short timeframes, sudden volume spikes, and price breaking out of a recent range.

But be cautious, if a fast move doesn’t come with sustained volume, it often snaps back just as quickly.

sms-star

Crypto Reality Check:

  • Momentum in crypto often speeds up during liquidation cascades (when traders are forced to sell or buy).
  • Once that forced flow ends, those moves can reverse aggressively.


Volume Surges and Liquidation Cascades

When liquidations hit (meaning traders are forced to buy or sell), it can look like a clean breakout on the chart.

But don’t be fooled. These are high-risk momentum plays: they might offer big rewards, but sharp and sudden reversals are very common.

H2: Forex Momentum Scanners

Forex momentum scanners watch for clean breakout moves during session transitions (like the London or New York opens) and during periods of macro-driven volatility.

They’re designed to catch strong price action when trader participation lines up at key times.

H3: Session-Based Momentum Patterns

In forex, momentum tends to cluster around two key times: the London open and the New York–London session overlap.

During off-hours, signals are less reliable simply because fewer traders are active, which means thinner volume and weaker follow-through.

H3: News Releases and Volatility Spikes

Big economic news can instantly shift market pricing. The first spike that follows is often driven by emotion, not logic.

Real momentum only shows up if there’s continued buying or selling after that initial burst.

Market Behavior Tips and Tricks:

  • The first candle after major news is usually emotional.
  • The second move is what tells you if traders are truly getting involved.

H2: Leading Platforms and Tools for Momentum Scanning

Not all scanners are built the same. The big differences usually come down to Speed of the data feed, Alert quality and Filter flexibility.

Choose the tool that fits your market (stocks, crypto, forex) and aligns with how you trade.

H3: Thinkorswim Momentum Scanner Settings

Thinkorswim gives you a lot of flexibility when building a momentum scanner, but too much complexity can work against you.

In fast markets, simple setups perform better. The cleaner your logic, the easier it is to execute under pressure.

sms-star

Want to build a highly effective High-of-Day (HOD) momentum scanner in Thinkorswim?

Enter the following parameters in the Scan tab:

  • % Change (Net Change): > +4.0%
  • Volume: > 500,000 (helps ensure liquidity)
  • Shares (Float): < 50,000,000 (supports higher volatility)
  • Price: $2.00 to $20.00 (common retail trading range)

Custom Study: Set the condition to close is greater than or equal to high from 1 bar ago, this triggers the HOD condition.

High-of-Day Scanners in TradingView

TradingView is great for visual traders; it offers a smooth charting experience and easy confirmation of setups.

However, the speed of your data depends on your subscription plan and market coverage. Make sure it’s fast enough for real-time momentum plays.

H3: Webull Top Gainers and Momentum Filters

Webull’s top gainers’ list works well if you need a quick list of top gainers or just a basic scan.

But if you’re looking for more advanced filtering, like detailed float or RVOL customization, you might find it a bit limited.

H3: Trade Ideas Real-Time Momentum Alerts

Trade Ideas stands out for its speed and sophisticated real-time alerts.

It’s a powerful tool with strong performance, but be prepared for a steeper learning curve and a higher price tag.

H3: Stock Titan Scanner with Live News Feeds

Stock Titan’s real-time news feed helps you avoid chasing random spikes.

When volume surges, the news overlay lets you quickly validate why, so you’re trading based on real catalysts, not noise.

H2: Optimising Momentum Scanner Settings

Optimizing a scanner means narrowing your focus and making sure your momentum filters are aligned with your risk rules.

The goal is to point out alerts that are actually tradable, not just exciting.

H3: Universe Filters: Price, Float, and Liquidity

Start by cutting out stocks that are simply untradable, those with super low liquidity, huge bid/ask spreads and price ranges that don’t suit your strategy.

  • Float affects how fast a stock can move.
  • Liquidity affects whether you can actually get in and out.

Make sure the stocks in your universe match your account size and your ability to execute efficiently.

H3: Momentum Filters: Percent Change and RVOL

Keep core momentum filters compact. Percent change shows pressure, RVOL confirms participation, and range expansion confirms volatility.

Example configuration:

  • Minimum 4 percent intraday gain
  • RVOL above 2.0
  • Expanding five-minute range
FilterTypical SettingWhy It Matters
Price3 to 25 dollarsAvoid illiquid micro caps
RVOLAbove 2.0Confirms participation
FloatBelow 75MIncreases expansion speed
Percent ChangeAbove 4 percentDetects active movement
SpreadBelow 0.5 percentControls execution risk

Q: What are the best momentum scanner settings for day trading?

A: A practical core is percent change plus RVOL plus a clean breakout condition, then add spread and liquidity guardrails.

Risk Filters: Spread and Halt Probability

Fast movers can be untradable if the spread is wide or halts are likely. Add maximum spread and minimum dollar volume filters so signals remain executable, not just exciting.

Alert Logic and Notification Timing

Early alerts give more reward potential but more noise. Late alerts give better confirmation but worse pricing. Pick one edge and build consistent rules.

sms-star

Execution Principle:

  • Early alerts improve reward potential.
  • Late alerts improve confirmation.
  • Choose one and execute it consistently.


Lorem ipsum dolor sit amet, consectetur adipiscing elit. Ut elit tellus, luctus nec ullamcorper mattis, pulvinar dapibus leo.

Mini Example: Building a Day Trading Scanner

Example scan:

  • Price between 3 and 25 dollars
  • Float under 75 million.
  • RVOL above 2.5
  • Intraday gain above 5 percent
  • Break of HOD

Then trade only when the structure confirms, and the spread stays controlled.

H2: Free vs Paid Momentum Scanners

Free tools can work for basics, but paid scanners often improve reaction time and filtering depth.

H3: Best Free Momentum Scanner Workflows

Use top gainers plus volume filters, then manually check RVOL and structure on charts. This can work if you are disciplined and fast.

H3: Limitations of Free Tools

Delays, limited alerts, and shallow filters can reduce edge in fast momentum. If your style depends on speed, delays cost money.

H3: When Paid Scanners Provide an Edge

Paid tools improve feed speed, alerts, and filter combinations. They do not replace discipline.

sms-star

Cost vs Edge:

  • A paid momentum scanner does not create profitability.
  • It improves speed and structure.
  • Discipline creates consistency.


Q: When should I upgrade to a paid Momentum scanner?

A: When you trade frequently and need real-time alerts plus deeper filtering to stay ahead of crowding.

Common Mistakes When Using Momentum Scanners

Most losses come from late entries, ignoring liquidity, and ignoring context.

Chasing Extended Moves

A scanner shows acceleration, not a good entry. If the price is far from the structure, you are often buying exhaustion.

sms-star

Common Retail Errors:

  • Most momentum losses come from buying strength without structure.
  • Parabolic charts attract emotion, not asymmetric risk.


Confusing Illiquidity with Momentum

Illiquid spikes can look like momentum. True momentum shows sustained volume and controlled expansion. Always check the spread and dollar volume.

Ignoring Catalyst Context

Catalysts explain why the flow is entering. Without a reason, continuation is less reliable and fades faster.

Over-Optimising Scanner Filters

Too many filters can remove real trades and create a fragile system. Markets change, and rigid systems break.

Risk Management for Momentum Trading

Momentum requires strict risk management because slippage, spread expansion, and halts can change outcomes in seconds.

Position Sizing for Fast Movers

Use risk-based sizing. Define stop first, then position size. This keeps losses consistent when volatility expands.

sms-star

Capital Protection Rule:

  • Define risk first.
  • Size second.
  • Enter last.

Managing Slippage and Spread

Market orders can slip badly in thin liquidity. Check the spread, dollar volume, and pace. Use limit orders when possible, but accept that volatile market moves can cause slippage or lead to requotes.

Halt Risk and Liquidity Traps

Low-float names can halt during extreme volatility. Plan exits before entry and respect liquidity traps when volume collapses after a spike.

Q: What is the halt risk in low-float momentum stocks?

A: The chance of a temporary trading pause triggered by extreme volatility, common in low-float parabolic moves.

Daily Loss Limits and Trade Cut-Off Rules

Define a daily loss limit and a cut-off rule. Momentum offers many signals, and without limits, overtrading becomes the real enemy.

Mini Example: Managing Risk in a Parabolic Move

Entry is on confirmation; stop is below the structure; size is based on fixed risk; partials are taken into extension; and exposure is reduced if liquidity thins or halts become likely.

Conclusion

A momentum scanner is not a prediction tool. It is a real-time detection system that highlights where participation, volatility, and liquidity are expanding now.

Explosive moves are more likely when volume confirms imbalance, catalysts provide context, and structure supports continuation. A good scanner compresses the market into a focused watchlist, but execution and risk control decide results.

FAQ

What Is the Best Momentum Scanner for Beginners?

Pick a tool with clear filters, real-time updates, and simple alerts. Learn execution before chasing complexity.

Are Free Scanners Sufficient for Day Trading?

They can be, but delays and limited alerts reduce the edge in fast conditions. Active traders often benefit from real-time feeds.

How Do I Build an HOD Scanner in Thinkorswim?

Use percent gain, RVOL thresholds, and a condition that price breaks the session high, then confirm with volume expansion and structure.

Which Metrics Matter Most: RVOL, Float, or Volatility?

RVOL confirms participation, float influences speed, and volatility shows expansion. Strong momentum aligns all three.

Momentum Scanner vs Screener: Which Is Better?

A screener is best for research. A momentum scanner is built for real-time detection and intraday execution.

How Can I Catch Breakouts Without Chasing?

Wait for consolidation near highs, rising RVOL, and a clean confirmation break. Define risk first and avoid extended prices far from the structure.

Continue Reading
not-found
calendar 15 April 2026
Rate this article
Plugin not installed

Leave a Reply

Your email address will not be published. Required fields are marked *

No thanks