


Many traders wait for a stock to break above a clear resistance level before buying. This often means missing the initial price surge. The pocket pivot strategy, developed by Chris Kacher and Gil Morales, allows you to enter a stock while it is still basing.
By identifying these internal structural shifts, you can secure a lower entry price and a better risk-to-reward ratio.

- Enter growth stocks while they are still basing to capture upside ahead of the crowd and traditional breakouts.
- Confirm institutional buying by ensuring today’s volume surpasses the highest down-day volume of the last 10 sessions.
- Focus on tight, orderly bases and moving average support rather than chasing extended prices.
- Maintain strict discipline by never buying more than 5% above the trigger point.
Understanding the Pocket Pivot Framework
Before placing a single trade, you need to understand what a pocket pivot is and, equally importantly, what it is not. This section lays the conceptual foundation.
Definition of Pocket Pivot and Its Role in Growth Stock Trading
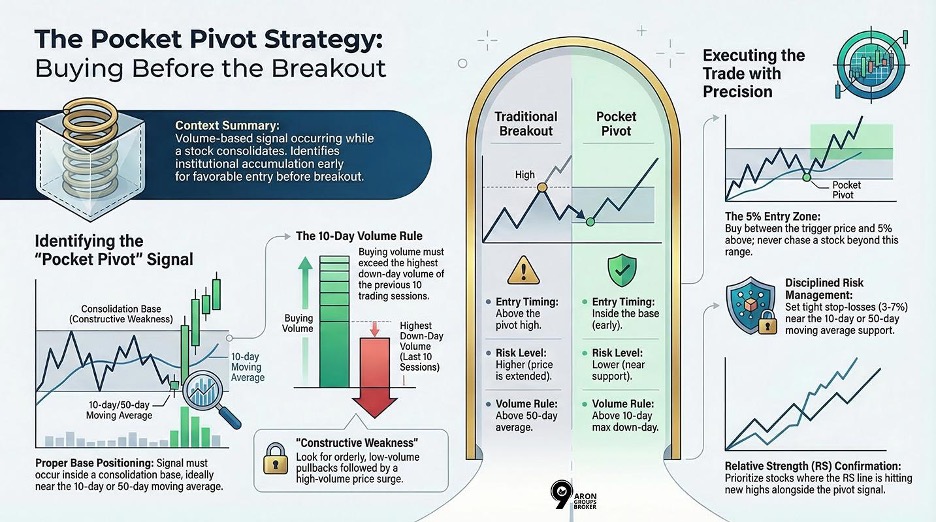
A pocket pivot is a specific volume-and-price event. It occurs while a stock is still within a base or consolidation phase. In simple terms, a pocket pivot buy point appears when a stock has an upward day. The volume must exceed the highest down-volume.

The volume must be higher than any down-volume day seen in the previous 10 trading sessions. This shows strong institutional demand.
A pivot point marks a price level where direction may change. This strategy adds a strict volume condition.
This condition filters out random noise from genuine accumulation signals. It ensures you only follow the most significant price movements. In growth stock trading, the pocket pivot’s meaning is vital.
Leading stocks often show repeated signals during their base-building phase.
- Spot signals early to build a position at a favourable cost.
- Enter well before the formal breakout occurs.
- Reduce the overall risk associated with chasing high prices.
Differences Between Pocket Pivot and Traditional Breakout Patterns
The William O’Neil CAN SLIM approach popularised the concept of traditional breakouts. This involves buying when a stock clears the top of its base. While valid, pocket pivots focus on internal structure.
They allow for earlier entries within the consolidation pattern, rather than waiting for the breakout.
| Feature | Traditional Breakout | Pocket Pivot |
|---|---|---|
| Entry timing | At or above the pivot high | Inside the base |
| Risk level | Higher (extended price) | Lower (within support) |
| Stop placement | Further from the entry | Tighter, near 10-MA or 50-MA |
| Volume requirement | Above 50-day avg | Above the highest down-day (10 sessions) |
| Entry price | Near the top of the base | Mid-to-lower within the base |
| Crowd awareness | High - widely followed | Low - fewer traders watching |
How Base Formation Signals Potential Pivot Pocket Setups
A base, or consolidation zone, is a long period of sideways price movement. This follows a strong prior move higher. Bases take many shapes:
- flat bases,
- cup-and-handle formations,
- or double-bottom patterns.
The stock is resting and absorbing selling pressure.
This phase allows the stock to build energy for a potential move higher. Pocket pivot setups almost always occur within these bases. As the stock consolidates, institutional investors quietly accumulate shares. Each time they buy, volume picks up on an up-day.
These bursts of buying volume leave a visible footprint on the chart. This footprint is the pocket pivot signal you are looking for. The quality of the base matters. A deep, erratic base with many high-volume down-days is a clear warning sign for traders.
An ideal base is tight and controlled. Down-day volume should be low as the stock holds near its 10-week or 10-day moving average. This suggests that large institutions are holding the stock rather than distributing it. This creates a strong pocket pivot volume signature.
Avoid pocket pivot setups in stocks with wide, loose price action. Avoid those below their 50-day moving average as they lack structural quality.
Structural Preconditions for a Valid Pocket Pivot
Not every volume surge qualifies as a pocket pivot. Specific structural conditions must be in place first to ensure the setup is technically sound.
Price Positioning Within Consolidation and Constructive Weakness Zones
A valid pocket pivot buy point must occur while the stock is inside its base. It should not be extended above it. The ideal position is within the lower half to the middle of the consolidation range. This ensures the stock is not overextended.
Understanding Constructive Weakness
Constructive weakness refers to orderly pullbacks where selling is calm, and volume is low. The stock stays near a key moving average. This controlled drift lower strengthens the setup. It shows that sellers are not aggressively dumping shares, suggesting the next move is higher.
Reliable Entry Signals
A constructive pullback followed by a pocket pivot on a high-volume up-day is a highly reliable early entry signal. This sequence resets risk by bringing the price closer to its moving average support before the next advance begins.
Evaluating Pocket Pivot Volume Relative to Prior Declines
This volume rule is the heart of the pocket pivot definition. It separates a genuine accumulation signal from everyday price noise by comparing current buying pressure against prior selling pressure.
When the current volume exceeds the heaviest down-day volume over the last 10 sessions, it signals that buyers are more active than sellers have been recently. This confirms that demand is overwhelming supply.
Q: How do I calculate volume if there were no down-days?
A: If there are no down-days in the prior 10 sessions, the stock is in a steady uptrend with no meaningful selling. In this case, the volume bar simply needs to be above-average for a valid pocket pivot to occur. However, be cautious. A stock with zero down-days over 10 sessions may be extended, which raises the risk of entry. Always check the broader base structure before committing capital.
Confirming Moving Average Support at 10-MA and 50-MA
Moving averages act as dynamic support levels. The 10-day (10-MA) and 50-day (50-MA) are the most relevant reference points for these trades.
Short-Term Pocket Pivots
For a short-term pocket pivot, the ideal setup for the stock is to trade above its 10-MA. The 10-MA itself should be trending upward. A pocket pivot occurring right on or just above the 10-MA is particularly strong. This moving average provides a well-defined stop-loss level.
Long-Term Confidence
The 50-MA matters for longer-term confidence. A stock bouncing off its 50-MA on a pocket pivot shows that institutional buyers are active. This is known as a support test at the 50-MA. Such a move often precedes significant price advances in the market.
A pocket pivot signal below both the 10-MA and the 50-MA is invalid. Moving average support is a non-negotiable precondition.
The Pocket Pivot Buy Point Explained
Understanding where to buy is as important as knowing what to look for. The pocket pivot buy point has specific rules that make it actionable and repeatable.
Identifying a Pocket Pivot Buy Point for Practical Entry
The pocket pivot buy point is the price where the stock crosses the prior day’s close. This applies only if volume conditions are met in real time.
Most traders wait until the last hour. They confirm volume is on track to exceed the required threshold before entering.
- Entry range: From the session’s low up to 5% above the trigger price.
- Risk warning: Buying beyond 5% is chasing the stock. Avoid this as it adds unacceptable risk.
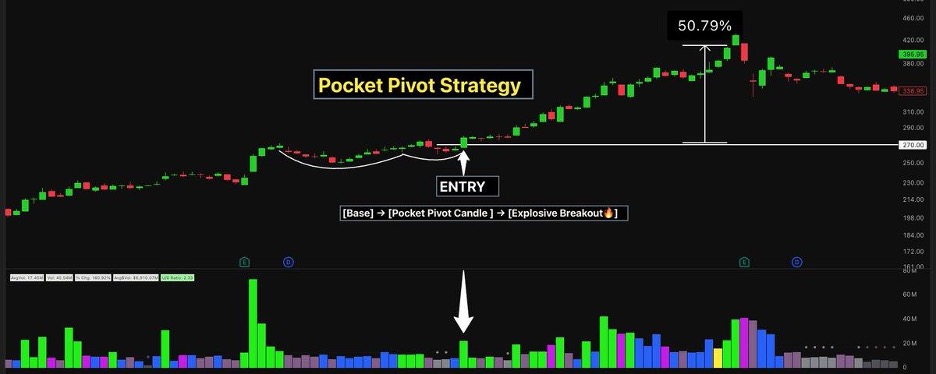
On a daily chart, this looks like a tall green candle. It shows much higher volume than recent down days. This visual is easy to spot. Review examples on platforms like TradingView or Chartmill to train your eye.
Timing the Buy Point to Maximise Probability of Success
Timing matters. Entering too early, in the first 30 minutes, risks buying into a false move before volume confirms. Entering too late means taking an excessive risk. This happens if the stock has already run 5% or more from its trigger.
The best entry window is mid-to-late session. This is between 2:00 PM and 3:30 PM Eastern Time. By then, volume trends are clearer. The day’s price action has also settled into a more defined direction.
For traders in other zones, this is the final two hours of the New York session.
- Set a price alert at the trigger level.
- Set a volume alert when cumulative volume nears the threshold.
This lets you act without watching the screen all day.
Using Relative Strength as a Secondary Confirmation Signal
The Relative Strength (RS) line, most prominently used in the IBD (Investor’s Business Daily) methodology, measures how a stock is performing compared to the broader market index.
Strong Confirmation Signals
A pocket pivot is significantly stronger when the RS line is trending upward at the time of the signal. Even better is when the RS line reaches a new high on the day of the pocket pivot. This is a reliable secondary confirmation signal.
Identifying Yellow Flags
If a stock shows a pocket pivot but its RS line is lagging or declining, this is a yellow flag. The stock may still move higher, but it is showing less leadership than ideal. This suggests the setup is not perfect.
In a market full of strong opportunities, a lagging RS line is a valid reason to pass on the trade.
Q: Can a pocket pivot work in a declining or bear market environment?
A: Pocket pivots in a bear market carry substantially higher failure rates. In a market correction or downtrend, even technically valid pocket pivot signals can be overtaken by broader selling pressure. The majority of experienced practitioners, including Chris Kacher and Gil Morales, recommend reducing position size significantly or avoiding pocket pivots altogether during confirmed market downtrends. The strategy works best when the major market indices are in a confirmed uptrend, and the general environment is supportive of growth stock leadership.
Executing Pocket Pivot Trades Effectively
This section covers market conditions and risk management. It also explains an advanced variant known as the buyable gap-up.
Applying Pocket Pivot Strategies During Bullish Market Phases
The pocket pivot strategy works best during confirmed bull markets. When indices rise, and market breadth is positive, growth stocks break out more reliably.
H4: Identifying a Bullish Phase
A bullish phase occurs when the S&P 500, Nasdaq Composite, and Dow Jones Industrial Average trade above their respective key moving averages.
Key indicators include:
- Follow-through day: A strong up-day on higher volume than the previous session.
- IBD Methodology: This signal suggests the start of a new uptrend.
Focusing on leading sectors offers the best risk-adjusted returns. Look for high-quality setups in these areas:
- Technology;
- Healthcare innovation;
- Consumer discretionary.
Targeting these sectors within a bullish market dramatically improves your odds of success.
Always check the broader market trend before trading. Acting against the prevailing market direction is a common, avoidable mistake in growth stock trading.
Risk Management and Stop Placement Around the Entry Zone
Risk management separates profitable traders from those who blow up accounts. For pocket pivot trades, place the stop-loss carefully. Typically, place it just below the 10-day moving average. For a slightly wider stop, use the 50-day moving average. This depends on where the signal occurs.
A common rule limits the stop-loss distance. For a standard pocket pivot near the 10-MA, limit stops to 3-4%. This is the maximum drop below the purchase price. For a pivot off the 50-MA, a wider stop is acceptable. A 5-7% range is acceptable due to stronger structural support.
Position Sizing
Your position sizing should reflect the stop distance. If your stop is 5% below entry, calculate accordingly. If you are comfortable risking 1% of your account, do this math. Divide 1% of the account value by the 5% stop. This equals a position size of 20% of capital.
1% 5% = 20%
This structured approach keeps losses manageable. It helps even when the trade does not work out.
Do not widen your stop-loss after a trade moves against you. A stock falling significantly below the 10-MA shows distribution. It is not showing accumulation. Cut the loss and move on.
Incorporating Buyable Gap-Ups Into Pocket Pivot Execution
A buyable gap-up is a variation of the pocket pivot that occurs when a stock opens significantly above its prior day’s close, typically due to strong earnings or a major positive catalyst. When accompanied by heavy volume, a buyable gap-up can be treated as a pocket pivot-style entry.
The key distinction is timing:
You are buying the open or within the gap’s first 30 minutes, before the stock has moved too far. However, the 5% entry limit still applies.
Buyable gap-ups are most powerful when the stock is already in a healthy base before the catalyst. A stock that gaps up from a fundamentally sound base with surging volume represents one of the most compelling short-term entry signals in technical trading.
Using Tools to Identify Pocket Pivot Opportunities
Manual chart reading has its limits, especially when markets are active and hundreds of stocks are in play. Pocket pivot indicators, scans, and screeners allow traders to filter the universe of stocks efficiently and focus attention where it matters most.
Applying a Pocket Pivot Indicator in Charting Software
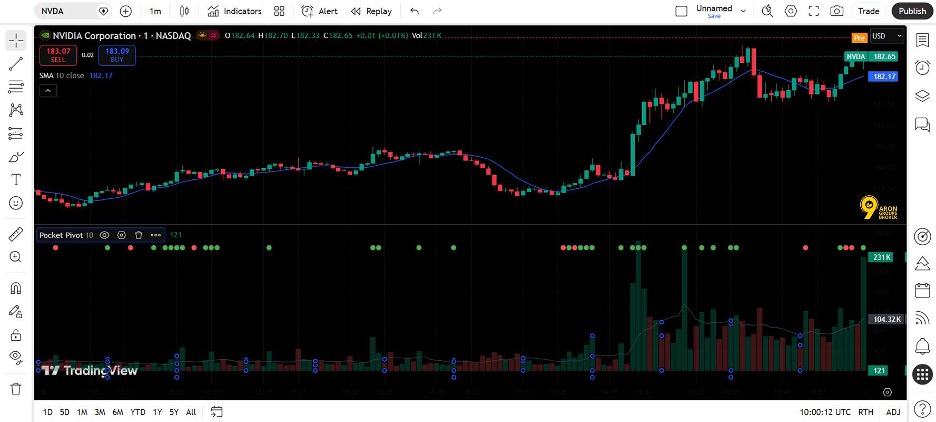
The Pocket Pivot Indicator is a programmatic tool that automatically detects specific volume signatures. It identifies an “up-day” where the volume exceeds the highest “down-day” volume of the previous 10 trading sessions.
When this condition is met, the indicator places a visible marker, typically a dot or arrow, directly below the relevant price candle.
Popular Platforms & Implementation
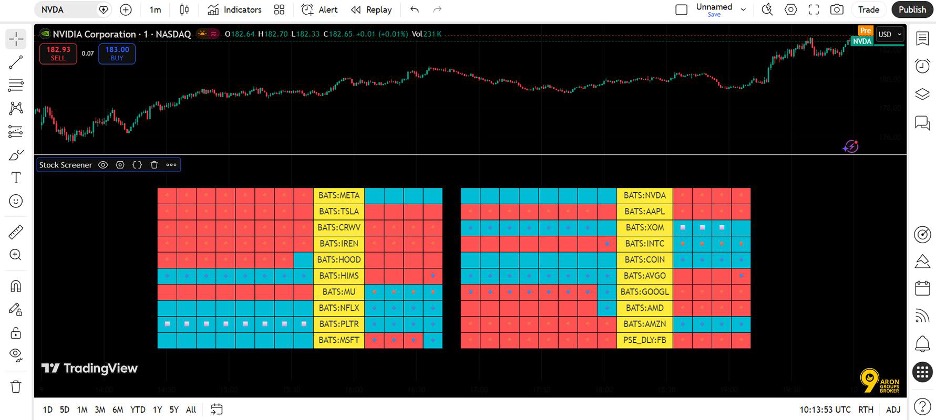
- TradingView: Hosts several publicly available scripts, including community-built tools that replicate the Kacher-Morales logic. These scripts:
- Run in real-time.
- Apply to both daily and weekly charts.
- Often, overlay moving averages to provide the necessary context for the 10-session volume rule.
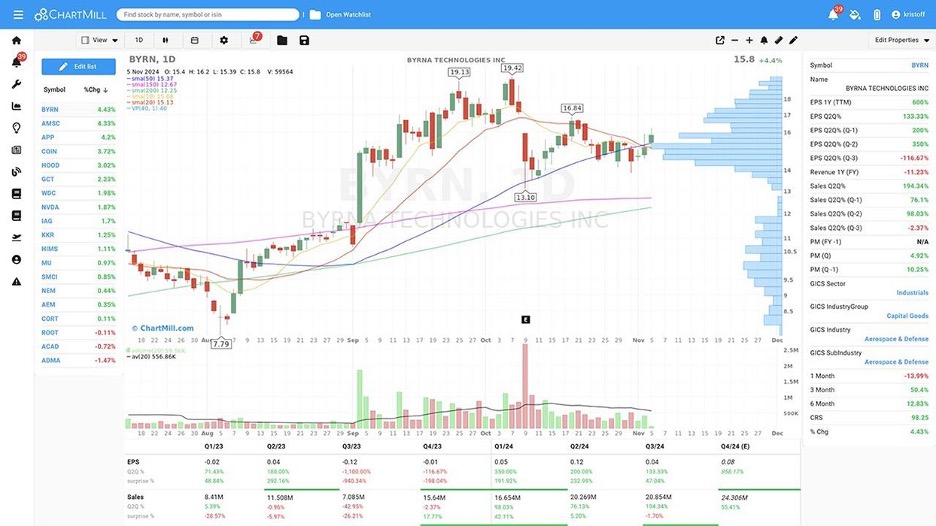
- Chartmill: This technical analysis platform features a built-in pocket pivot indicator within its charting and screening interface. It highlights the signature directly on the chart, simplifying visual confirmation for traders of all experience levels.
Running Efficient Pocket Pivot Scans for High-Relative-Strength Stocks
A pocket pivot scan is a filter applied to a stock screener or data platform to surface candidates meeting the pocket pivot volume rule on any given trading day. Running this scan at the end of each session provides a focused watchlist to review each evening.
Core Scan Parameters
The following criteria are typically used to filter for high-quality pocket pivot setups:
- Up-Day Condition: Close price must be greater than the open price ($Close > Open$).
- Volume Rule: Volume must be greater than the maximum down-day volume of the last 10 sessions.
- Price Trend: Price must be above the 10-day moving average.
- Relative Strength: Stocks should rank in the top 20-30% of the entire market.
- Quality Filter: A minimum price filter (e.g., above $10.00) to remove low-quality penny stocks.
Supported Platforms
Several professional-grade platforms support these specific scan parameters:
| Platform | Provider |
|---|---|
| ThinkorSwim | TD Ameritrade / Charles Schwab |
| TC2000 | Worden Brothers, Inc. |
| Chartmill | Chartmill Technical Analysis |
On an average trading day, the scan typically returns between 10 and 40 candidates. However, this number can rise sharply during strong bull markets when many stocks simultaneously show accumulation signals.
Designing a Pocket Pivot Screener for Leadership Stocks
A pocket pivot screener goes further than a simple scan by layering on fundamental and technical quality filters. The goal is to narrow the results down to true market leaders with superior earnings growth, strong revenue acceleration, and industry group leadership.
To find genuine leaders in healthy industries, combine the core volume rule with these additional parameters:
- Earnings Power: EPS (earnings per share) growth of at least 25% in the most recent quarter.
- Sales Momentum: Revenue growth above 20%.
- Liquidity & Price: Price above $10.00 and average daily dollar volume above $10 million.
- Group Strength: Industry group ranked in the top 40 (IBD or equivalent rankings).
By stacking these conditions, you shift from a list of stocks that merely meet a technical definition to a list of fundamentally superior companies. This meaningfully increases the probability of success, as pocket pivots are most powerful during a bull market cycle.
| Scan Parameter | Rule |
|---|---|
| Price Condition | Close > Open |
| Volume Condition | Volume > Highest down-volume in last 10 sessions |
| Trend Filter | Price above 10-day MA |
| Relative Strength | Top 30% of market |
| Price Filter | Above $10 |
| Liquidity Filter | Daily dollar volume > $10M |
Fundamental quality is not optional. A pocket pivot in a low-quality company with declining earnings is a low-probability trade. Always screen for earnings strength alongside the technical signal.
Q: Which platform is best for building a pocket pivot screener as a retail trader?
A: The “best” platform depends on your specific needs and budget:
- TradingView: The most accessible starting point due to its massive library of community Pine Script indicators and customizable screener tools.
- TC2000: Highly regarded by active growth traders for its real-time scan engine and clean charting interface.
- MarketSmith (IBD): Purpose-built for combining fundamental and technical screening, though it carries a higher subscription cost.
- Chartmill: Offers a well-documented pocket pivot filter specifically, making it ideal for traders who prefer a simpler, ready-made setup.
Analysing Behavioural Patterns in Pocket Pivot Stocks
The most insightful part of learning pocket pivot trading comes from observing how leading stocks behave over time. Repeated patterns in price and volume tell a story, and understanding that story gives you a meaningful edge.
Recognising Repeated Pocket Pivot Volume Clusters in Leading Stocks
The world’s most successful growth stocks, those that go on to gain 100%, 200%, or more, rarely produce a single pocket pivot. Instead, they generate a series of pocket pivots throughout their base-building phase.
These clusters of volume signals indicate repeated accumulation and the absorption of available supply at each price level.
Understanding Volume Clusters
A volume cluster is defined as two or more pocket pivot signals within the same base, ideally separated by periods of constructive weakness.
Key characteristics of a strengthening stock include:
- Successive Signals: Each new pocket pivot that holds above the prior signal’s low is a sign of building strength.
- Approaching Breakout: These clusters often signal that the eventual breakout leg is approaching.
Historical Precedents
Studying historical charts of stocks like Apple, Amazon, and NVIDIA during their great advancing phases reveals this pattern repeatedly. Base after base, these stocks produced pocket pivot clusters before each major breakout. Recognising this behaviour in real time is a skill that develops with deliberate practice.
Spotting Weak Follow-Through and Failed Pocket Pivot Signals
Not every pocket pivot signal leads to a profitable trade. Understanding what failure looks like is just as important as recognising the signal itself. A failed pocket pivot typically shows one or more of the following warning signs:
1. Weak Follow-Through
The stock produces the pocket pivot signal but fails to advance meaningfully in the following sessions. Instead, it drifts back below the 10-day moving average (10-MA) on rising volume.
This indicates that the initial buying was not sustained, and distribution may be resuming.
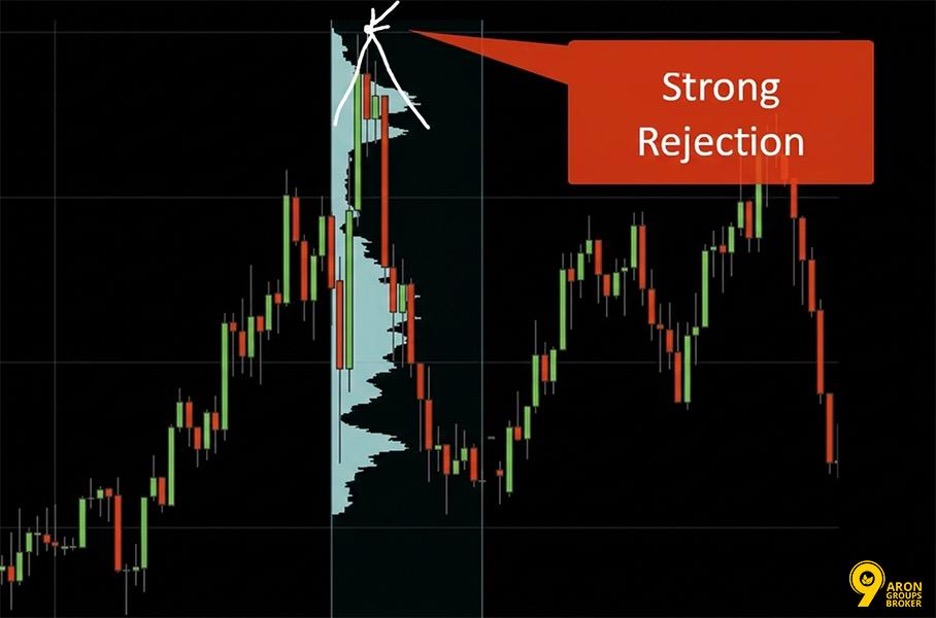
2. V-Shaped Reversal (Intraday Failure)
The stock surges on the pocket pivot day but immediately reverses and closes near the low of the session. A close in the lower half of the day’s range on a pocket pivot day is a serious warning sign.
While the volume is present, the price action suggests selling pressure is overrunning the buyers.
3. Broad Market Deterioration
The trade may be technically valid, but if the overall market shifts into distribution mode in the days following your entry, even strong pocket pivots can fail. Always monitor the broader market trend alongside individual stock behaviour.
A pocket pivot that closes in the lower third of the session's price range is a major red flag. Volume without price follow-through suggests the signal may be a false positive or a distribution event disguised as accumulation.
Conclusion
Mastering the pocket pivot strategy offers a distinct edge by allowing traders to enter leading stocks before the crowd. By focusing on volume signatures within a base and adhering to strict risk management, you can secure favourable prices with lower risk.
Whether using manual analysis or automated screeners, success relies on patience and discipline. Start by identifying these volume clusters in quality stocks to refine your timing and improve your overall market performance.