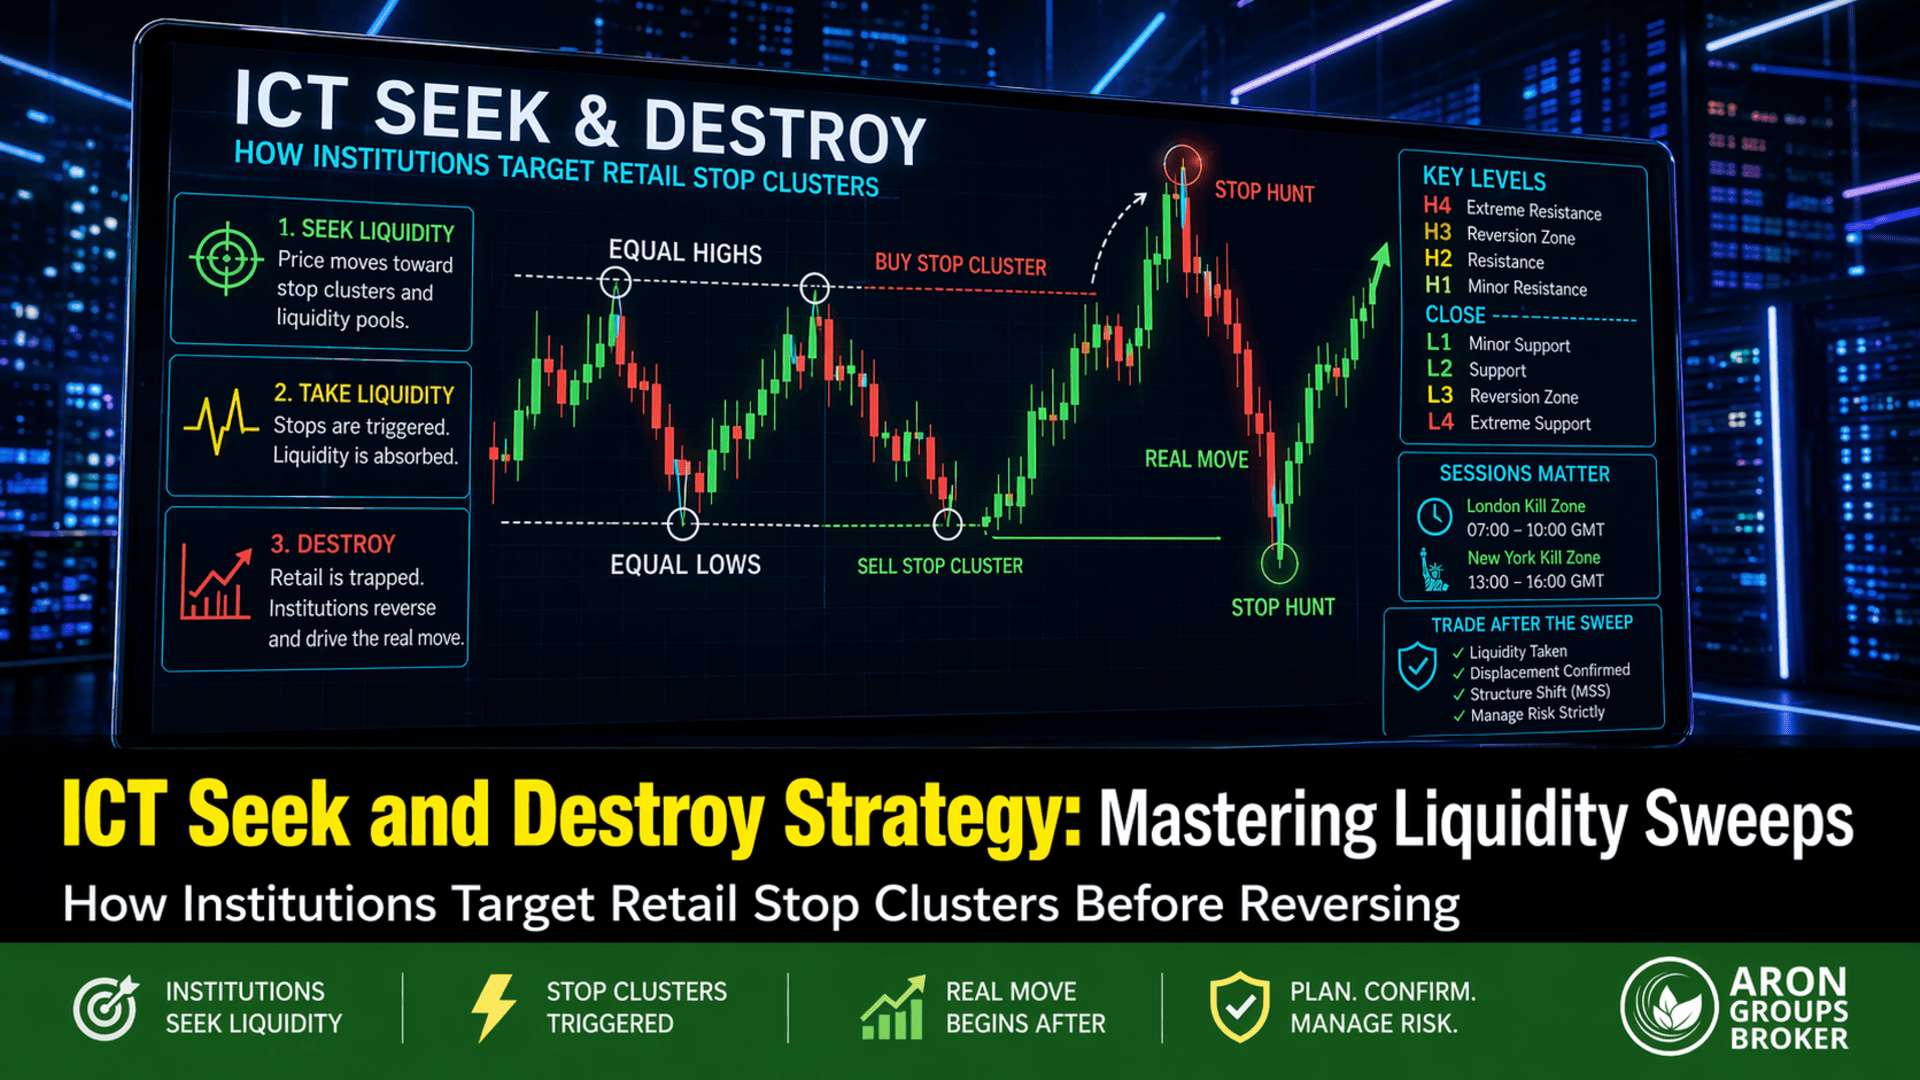


Price in financial markets is driven by liquidity, not randomness. The ICT Seek and Destroy model explains how institutions target predictable retail stop-loss zones—such as equal highs and lows—to generate the liquidity needed for large positions. This often appears as a stop hunt, where price moves against traders, triggers their stops, and then reverses sharply.
By understanding this process, traders shift from reacting to price to anticipating liquidity movements. This approach helps identify ICT Retail Trap patterns, avoid false breakouts, and execute trades with better timing across Forex, Gold, and crypto markets.

- In the ICT Seek and Destroy model, price moves toward stop clusters and liquidity pools before making a true directional move.
- In the ICT Seek and Destroy model, high-probability trades occur only after liquidity is taken and confirmed with displacement and market structure shift.
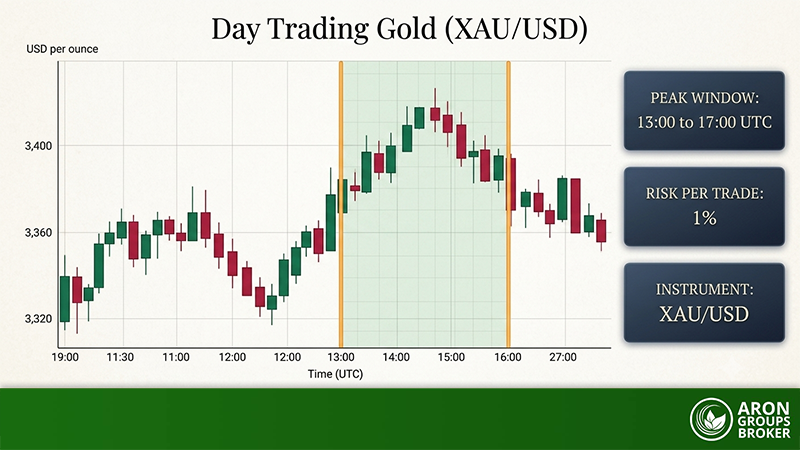
- Most stop hunts and real moves happen during London and New York sessions, not during low-liquidity periods.
- Higher-timeframe bias and macroeconomic events (e.g., NFP, CPI) determine direction, while lower-timeframe setups define entry.
What Is ICT Seek and Destroy, and Why Does It Matter in Modern Trading?
ICT Seek and Destroy is a specific market condition described by Inner Circle Trader, in which price action becomes erratic and directionless during the week—typically Monday to Thursday—while liquidity builds on both sides of the market. This environment often precedes high-impact economic events, such as NFP or FOMC meetings.
During this phase, the price does not trend cleanly. Instead, it moves above highs and below lows, repeatedly triggering stop losses. This creates frustration for retail traders and leads to a series of false signals. The real move usually comes later—often on Friday or immediately after the news release—when the price performs a final liquidity sweep and then expands strongly in one direction.
This concept matters because it prevents traders from forcing trades in low-probability conditions. Instead of chasing setups midweek, you recognise when the market is in “Seek and Destroy mode” and wait for the true directional move after liquidity has been fully engineered.
The Core Concept Behind Seek and Destroy ICT
The core idea is simple: the market first seeks liquidity, then destroys weak positions before delivering the real move.
In this model, price deliberately trades through both sides of the range during the week. For example:
- Monday high = 1.1050
- Tuesday low = 1.0980
- Wednesday → price breaks above 1.1050 (buy stops triggered)
- Thursday → price drops below 1.0980 (sell stops triggered)
At this point, both buyers and sellers have been trapped.
The final phase occurs after a key catalyst. Price makes one more aggressive move into liquidity (often a sharp spike), then reverses and trends cleanly. This is the “destroy” phase, where retail positions are eliminated, and institutions deploy capital in the true direction.
How Smart Money Uses Liquidity Pools Against Retail Traders
In a Seek and Destroy environment, institutions are not immediately pushing prices in one direction. Their primary objective is to accumulate liquidity from both sides before committing to a position.
This is achieved through a structured process:
- Price creates a range → traders place stops above and below
- False breakouts occur → both long and short traders are induced
- Stops are triggered on both sides → liquidity is collected
- Final expansion → institutions move price with minimal resistance
Understanding Stop Hunt ICT: The Mechanics Behind Stop Cluster Sweeps
A Stop Cluster Sweep ICT occurs when prices aggressively move into an area where many stop losses are concentrated. This creates a surge in market orders, allowing institutions to fill positions efficiently.
What Is a Stop Cluster and Where Does It Form
A stop cluster is a concentration of stop-loss orders placed at similar price levels. These clusters are predictable because retail traders tend to follow similar strategies.
Common locations include:
- Below equal lows (sell stops from long positions)
- Above equal highs (buy stops from short positions)
- Trendline breaks
- Support and resistance levels
- Previous session highs/lows (London, New York)
How Institutions Trigger Stop Loss Cascades
Institutions deliberately push prices into stop clusters to access liquidity. Price first moves slowly toward these levels, then spikes sharply, triggering stop losses. This creates a surge of orders, which institutions absorb before reversing the market. The rapid move often triggers a chain reaction, with multiple stops firing and retail traders exiting in panic or entering too late.
ICT Retail Trap Mechanics: How Liquidity Is Engineered from Trader Behaviour
The ICT Retail Trap is not accidental. It is a repeatable structure built on predictable retail behaviour. Most traders follow similar rules—buy support, sell resistance, and place stop losses just beyond obvious levels. This uniformity creates visible liquidity zones that institutions can systematically exploit.
Predictable Retail Patterns That Form Stop Clusters
Retail traders tend to behave in patterns, and these patterns leave footprints on the chart. The most common formations include equal highs and equal lows, which naturally attract stop-loss placement.
Typical liquidity formations include:
- Equal highs where short sellers place stop losses above
- Equal lows where buyers place stop losses below
- Trendline touches where breakout traders stack orders
- Range highs and lows during consolidation phases
Market Psychology Behind Liquidity Traps in Forex and Crypto
The effectiveness of ICT Retail Traps comes from trader psychology. Most traders seek confirmation and safety, which, ironically, leaves them vulnerable.
Key psychological drivers include:
- Fear of missing out (FOMO): entering after a breakout
- Need for confirmation: waiting for “clean” patterns
- Herd behaviour: copying widely taught strategies
In crypto markets like Bitcoin, this effect is even stronger due to higher volatility. A breakout above a level like 30,000 often attracts aggressive buyers. Institutions use this surge in demand to distribute positions, leading to sharp reversals.
Identifying ICT Seek and Destroy Setups Before Execution
Recognising a Seek and Destroy setup requires shifting from indicator-based thinking to liquidity-based analysis. The goal is to identify where stops are likely to be placed and anticipate the move toward them before it happens.
Instead of chasing price, you map liquidity zones and wait for price to interact with them. The best setups occur when liquidity aligns with market structure and timing.
A typical workflow:
- Identify equal highs/lows or obvious support/resistance
- Mark liquidity zones above and below the price
- Wait for the price to approach these zones during active sessions
- Look for a sharp sweep followed by displacement
Liquidity Zones, Equal Highs/Lows, and Market Structure Clues
Liquidity zones are the foundation of ICT Seek and Destroy. These zones are visible areas where stop losses accumulate.
The most reliable signals include:
- Equal highs → potential buy-side liquidity
- Equal lows → potential sell-side liquidity
- Break of structure (BOS) or market structure shift (MSS)
- Imbalance or fair value gaps after displacement
Session Timing: London and New York Kill Zones Explained
Kill Zones are specific high-liquidity time windows when institutions actively move the market. The most important are:
- the London session (07:00–10:00 GMT), where initial liquidity sweeps often occur,
- and the New York session (13:00–16:00 GMT), where the true directional move is usually confirmed.
Typically, price targets Asian session highs or lows during London to trigger stops, then reverses or continues strongly in New York. This sequence reflects the Seek (liquidity grab) and Destroy (real move) phases.
In simple terms, liquidity levels define where price moves, and Kill Zones define when it happens.
Executing the ICT Seek and Destroy Strategy with Precision
Execution is where most traders fail in the ICT Seek and Destroy model. Identifying liquidity is not enough; precision comes from waiting for confirmation after the manipulation phase is complete. The correct sequence is: liquidity sweep → displacement → confirmation → entry.
In a typical setup, price first targets a liquidity pool (equal highs or lows), triggers stop losses, and then shows a strong move in the opposite direction. This move, known as displacement, signals that institutions have entered the market.
Entry Confirmation After Liquidity Sweep and Displacement
Entry confirmation is based on price behaviour, not indicators alone. After liquidity is taken, you need evidence that the market has shifted direction.
The most reliable confirmations include:
- Displacement candle: strong, impulsive move away from the liquidity zone
- Market Structure Shift (MSS): break of a short-term high/low
- Fair Value Gap (FVG): imbalance created during the move
Stop Loss Placement and Risk Management with Numeric Examples
Stop loss placement in ICT is logical, not arbitrary. It must sit beyond the liquidity already taken, ensuring the trade is protected from repeated sweeps.
Basic rules:
- Place stop loss below the sweep low (for buys)
- Place stop loss above the sweep high (for sells)
- Avoid tight stops inside the liquidity zone
Numeric example:
- Entry: 1.1005
- Sweep low: 1.0985
- Stop loss: 1.0975 (below liquidity)
- Target: 1.1050 (previous high)
Risk calculation:
- Risk = 30 pips
- Reward = 45 pips
- Risk/Reward = 1:1.5
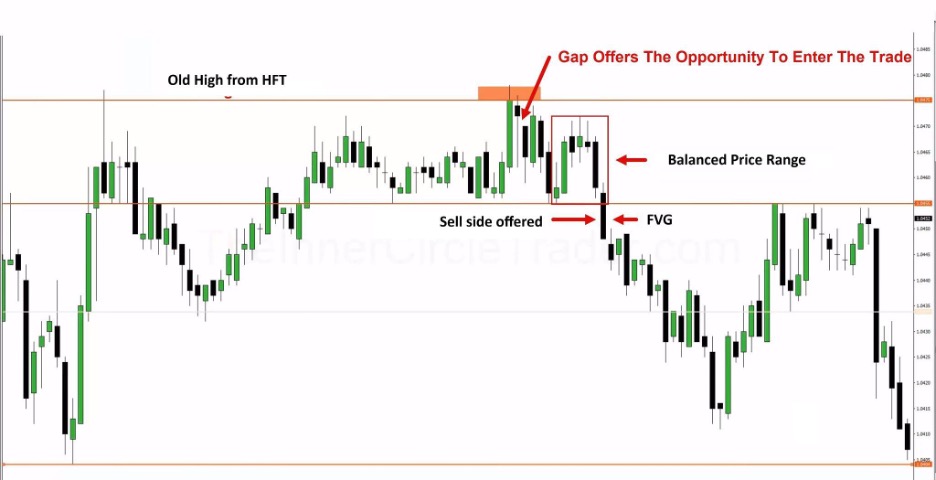
ICT Seek & Destroy Indicators: Proper Use and Limitations
Many traders search for an “ICT Seek and Destroy indicator” expecting a plug-and-play solution. In reality, no official indicator exists because the model is built on liquidity, timing, and market structure rather than automated signals.
Tools such as the ICT Seek & Destroy Profile Friday Indicator (TFlab) are third-party visualisation aids. They can highlight weekly highs and lows, potential liquidity zones, and typical Friday expansion behaviour, but they do not capture the full logic behind institutional price delivery.
- Download ICT Seek & Destroy Profile Friday Indicator for MT5 from ForexFactory
- Download ICT Seek & Destroy Profile (TFO) from TradingView
The limitation is structural. Indicators rely on fixed algorithms and historical data. They cannot interpret why the price is moving, nor can they adapt to macroeconomic events, session intent, or evolving market structure. As a result, they may show where liquidity exists, but not whether the price will sweep it or respect it.
A practical approach is to use these tools as a support layer, not a decision engine:
- Mark equal highs/lows manually to define liquidity pools
- Use session tools to track London and New York Kill Zones
- Confirm setups with displacement and market structure shift (MSS)
For example, if EUR/USD forms equal highs at 1.1050 and price sweeps to 1.1065 during London, the indicator may highlight the level—but only manual analysis (e.g., RSI divergence + bearish displacement) confirms the trade.
The core principle is clear: indicators help you see faster, but not think better. ICT methodology focuses on why price moves—seeking liquidity and triggering stops—while indicators only reflect what has already happened. Over-reliance leads to early entries and false signals, especially in Seek-and-Destroy conditions where manipulation is intentional.
| Category | Proper Use (Best Practice) | Limitation (What It Cannot Do) |
|---|---|---|
| Role in Strategy | Use as a visual aid to map weekly range and liquidity zones | Cannot act as a standalone trading system |
| Core Function | Highlights highs/lows, potential stop clusters, and Friday expansion zones | Does not understand true liquidity intent |
| Market Context | Helps organise the chart structure for easier reading | Cannot interpret macro events (NFP, FOMC) |
| Timing | Assists in spotting potential areas before Kill Zones | Cannot determine exact timing (London vs New York execution) |
| Price Behavior | Shows where price might react | Cannot explain why price reacts (inducement vs real move) |
| Accuracy | Useful when combined with MSS, displacement, and session timing | Produces false signals if used alone |
| Flexibility | Speeds up analysis for beginners | Fixed logic → cannot adapt to changing market conditions |
| Decision-Making | Supports manual confirmation | Cannot replace discretionary judgment |
| Learning Value | Good for understanding liquidity visually | Limits growth if over-relied on |
| Professional Use | Used as a secondary confirmation tool | Never used as a primary edge |
Key Tools to Simulate ICT Seek and Destroy
While no single indicator is sufficient, a combination of tools can approximate the model:
- Session indicators (London and New York Kill Zones)
- Horizontal levels for equal highs/lows
- RSI or MACD for divergence confirmation
- Volume/tick volume for detecting liquidity spikes
- Fair Value Gap (FVG) tools for imbalance zones
Used together, these tools create a structured framework that aligns with ICT logic—without replacing the need for discretionary analysis.

Effective execution in the ICT Seek and Destroy model depends more on risk discipline than entry frequency. Each trade should risk no more than 1–2% of total capital, with position size adjusted according to the stop-loss distance rather than a fixed lot size.
Common Execution Errors in ICT Seek and Destroy Trading
Even with a correct understanding of liquidity and structure, execution errors can significantly reduce performance. Most losses in the ICT Seek and Destroy model come not from wrong analysis, but from poor timing and lack of context awareness.
Premature Entries Before Liquidity Is Taken
The most common mistake is entering too early—before the liquidity sweep occurs. Traders identify a level (e.g., support at 1.1000) and enter immediately, expecting a reversal. However, in the Seek and Destroy model, price is highly likely to move through that level first to trigger stops.
Example:
- EUR/USD support at 1.1000
- Trader buys at 1.1002
- Price drops to 1.0985 → stop loss hit
- Then rallies to 1.1050
The analysis was correct, but the timing was wrong.
This happens because traders react to levels instead of waiting for liquidity confirmation. Without a sweep and displacement, the setup is incomplete.
Ignoring Higher Timeframe Bias and Macroeconomic Catalysts
Another major error is trading without considering the higher timeframe trend or key economic events. Seek and Destroy setups do not exist in isolation—they are influenced by broader market direction and news flow.
For example:
- The daily trend in gold is bullish
- Trader takes a short after a minor liquidity sweep
- Price pulls back briefly, then continues upward
The trade fails because it goes against the higher timeframe order flow.
Macroeconomic catalysts add another layer:
- NFP, CPI, or FOMC can trigger large liquidity sweeps
- These events often define the “destroy phase”
- Ignoring them leads to unexpected volatility
Correct approach:
- Align trades with higher timeframe bias (H1, H4, Daily)
- Be aware of major news releases
- Use news as a timing factor, not a surprise
In ICT logic, direction comes from the higher timeframe, while entry comes from lower timeframe liquidity events.
Conclusion
The ICT Seek and Destroy model provides a structured framework for understanding how institutions interact with liquidity. Instead of viewing the market as random, it frames price movement as a sequence: accumulation, manipulation, and expansion.
The key advantage of this approach is clarity. You stop reacting to price and start anticipating where liquidity lies and when it is likely to be targeted. This shift improves timing, reduces false entries, and aligns your trades with institutional behaviour.