


A stock doubles in price. Then it consolidates quietly for weeks, forming a tight range with little fanfare. Then it breaks out again. This pattern, observed decades before algorithmic trading existed, formed the basis of one of the most enduring breakout systems in technical analysis. The Darvas box trading strategy was built on exactly this observation: price action tends to consolidate before explosive moves, and traders who know how to identify those consolidation zones gain a structural edge.
This article explains how Darvas box trading works, from its origins with Nicolas Darvas through to practical setup on modern platforms including MT4, MT5, and TradingView. It covers the rules, pattern identification, entry and exit logic, and advanced concepts including ghost boxes and the 480-day accumulation breakout. Whether you trade equities, forex, or CFDs, the core principles apply.

- Consolidation Precedes Breakout: Darvas Boxes identify price consolidation zones, which often signal strong upcoming moves.
- Entry on Confirmation: Traders enter positions when price closes above the box top with higher-than-average volume, ensuring momentum alignment.
- Stop-Loss at Box Bottom: The box bottom defines the initial stop, with trailing stops adjusted as new boxes form to protect gains.
- Volume as Filter: Breakouts require sufficient trading volume to avoid false signals; low-volume moves are often faded by the market.
- Timeframe Agnostic: Darvas Boxes work across equities, forex, and CFDs, and can be applied to different timeframes, though higher timeframes reduce noise.
The Darvas Box Concept and Its Trading Significance
The Darvas method is a trend-following system built around price consolidation and breakout logic. Before examining the mechanics, it is worth understanding where it came from and why it still attracts serious attention.
Nicolas Darvas Box Theory: From Dancer to Market Innovator
Nicolas Darvas was a professional ballroom dancer, not a financial analyst. Between 1956 and 1958, trading largely from hotel rooms across three continents with delayed telegrams as his only market data, he turned roughly $25,000 into more than $2 million. He documented this in his 1960 book How I Made 2,000,000 in the Stock Market, which remains a foundational text on momentum trading. His method relied on identifying stocks making new highs, waiting for a consolidation range to form, and entering on the breakout above that range. He called these ranges boxes.
The simplicity was deliberate. Darvas had no access to real-time charts. He worked from weekly price data and focused on what price was doing at its extreme levels. Nicolas Darvas box theory strips out noise and concentrates on two questions: is the stock in a strong uptrend, and is it pausing before another leg higher?
Legacy of Darvas Box Trading Strategy in Modern Markets
Modern traders have the advantage of automated indicators, real-time feeds, and backtesting tools. The Darvas box trading strategy has been adapted for forex, commodities, and CFDs, not just equities. Darvas box indicators are available natively or via third-party plugins on MT4, MT5, and TradingView. The underlying logic, however, has changed very little. Consolidation precedes breakout; breakout confirms trend continuation; the prior consolidation low becomes the stop-loss reference.
Why Darvas Boxes Are Still Relevant for Traders Today
Most breakout systems fail because they trigger on low-conviction moves. The Darvas framework adds a volume filter and requires price to close outside the box before confirming a signal. This reduces false breakouts. For momentum trading in trending markets, few visual methods match its clarity. The box either forms and breaks, or it does not. There is no ambiguity in the setup.
Q: Is the Darvas method suitable for forex trading?
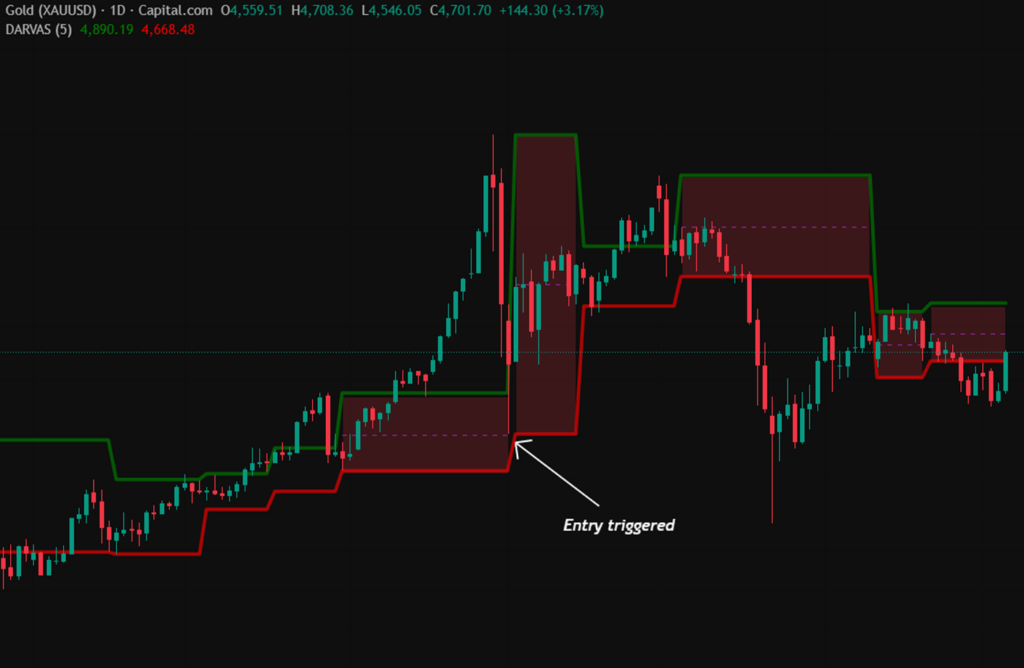
A: Yes, with adjustment. Darvas originally applied his method to equities with strong volume signals. In forex, volume data is decentralised, so traders typically substitute tick volume or focus on the price structure alone. The core box formation and breakout logic translates directly. XAUUSD and high-momentum currency pairs are commonly used.
Understanding Darvas Box Patterns
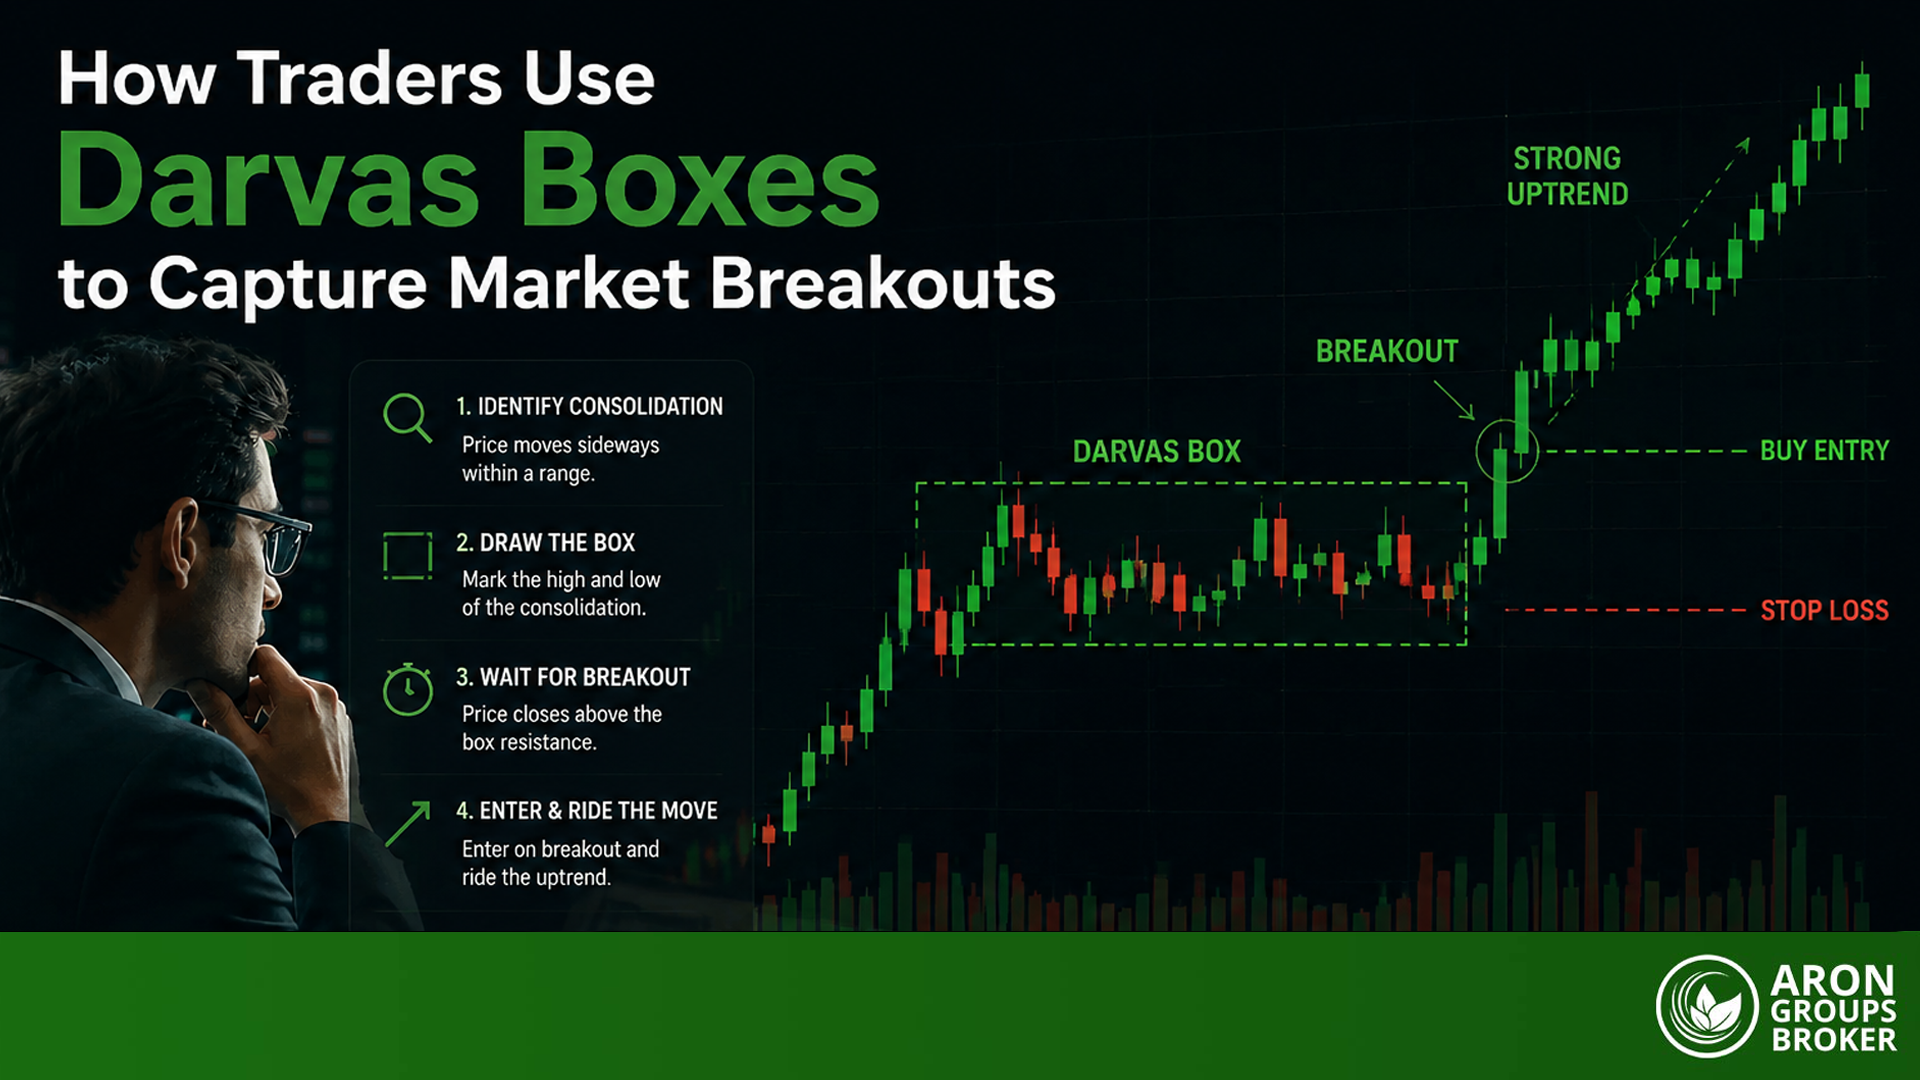
Understanding how a box forms is the first practical step. The pattern is structural: price reaches a new high, consolidates within a defined range, and then either breaks out or breaks down.
What Is a Darvas Box Pattern in Stocks and Forex
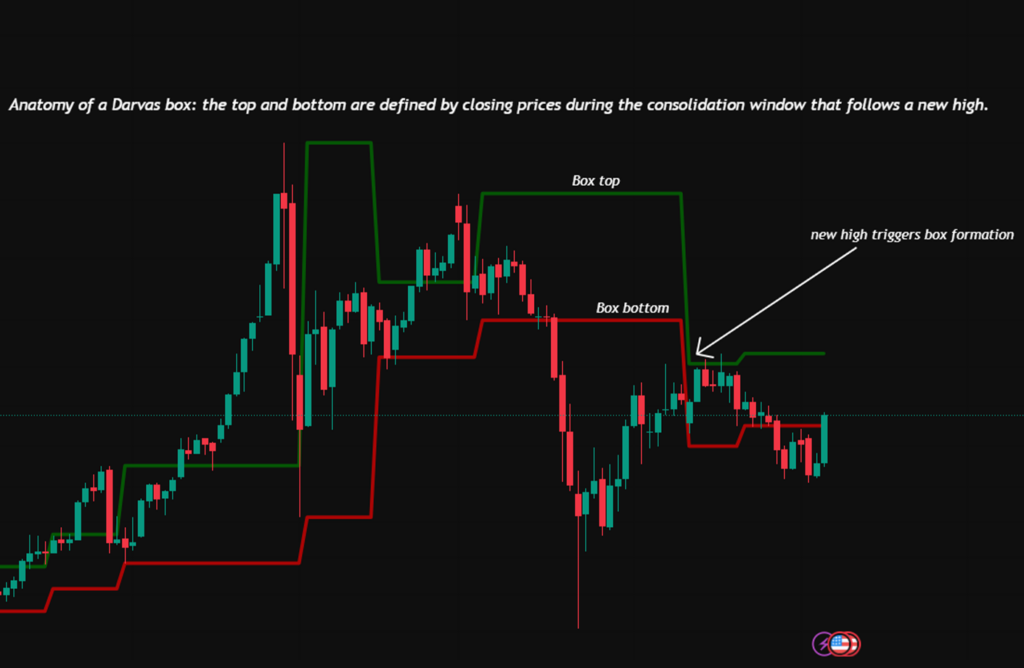
A Darvas box pattern is a rectangular consolidation zone drawn between a local high and a local low, following a period where price has reached a significant new peak. The box top is defined by the highest close during the consolidation. The box bottom is the lowest close in the same period. Darvas required at least three consecutive sessions where price neither exceeded the top nor violated the bottom before confirming the box was formed.
In forex, the same construction applies using candlestick highs and lows on any timeframe. A Darvas box on the daily XAUUSD chart looks identical in structure to one on a 4-hour EUR/USD chart. The concept is timeframe-agnostic, which contributes to its longevity.

Key Definition
A Darvas box is a rectangular zone drawn between the highest and lowest closes during a consolidation period that follows a new significant high. The box is confirmed when price fails to exceed the top or violate the bottom for at least three sessions. A valid breakout occurs when price closes above the box top on above-average volume.
Price Consolidation, Breakouts, and High Trading Volume
The box itself is a rest phase. Price has moved strongly, profit-taking occurs, and the instrument enters a period of equilibrium. The longer the consolidation relative to the prior move, the more significant the eventual breakout tends to be. High trading volume on the breakout candle is the key confirmation signal. Low-volume breaks are frequently faded by the market and result in false signals.
In practice, a valid Darvas box breakout should show volume at least 1.5 times the 20-session average on the breakout candle. Some traders use a simpler rule: volume must be higher than the average of the two preceding sessions. Either approach narrows the field to genuine momentum events.
Using 52-Week Highs for Darvas Box Formation
Darvas focused specifically on stocks making 52-week highs, a concept central to his stock selection process. The reasoning was straightforward: a stock making a new annual high has already outperformed most alternatives. It is in institutional demand. The breakout above the box top, when the stock is also near its 52-week high, becomes a compounding signal rather than a standalone one. For forex or commodity traders, an equivalent filter is identifying instruments trading at multi-month highs before applying the box framework.
Q: How many sessions define a valid Darvas box?
A: Darvas required the high to remain unbroken and the low to remain intact for a minimum of three consecutive sessions before confirming the box. Many modern traders extend this to five sessions or more to filter out short-lived consolidations. Longer box formations tend to produce higher-quality breakouts because they represent deeper equilibrium.
Rules and Core Principles of Darvas Box Trading
The original Darvas rules were strict. Modern adaptations have introduced flexibility, but the core entry and exit logic remains largely unchanged. Traders who drift too far from the original structure often find performance degrades.
Entry Signals and Momentum Confirmation in Darvas Boxes
The primary entry signal is a close above the box top. Darvas entered on the next open or placed buy-stop orders just above the box top so that he was filled automatically on any genuine break. In modern platforms, this translates to a buy-stop limit order placed one or two pips above the box ceiling, activated only when price closes above it.
Momentum confirmation can be added using a relative strength indicator or a rate-of-change measure. The simplest check: is the instrument above its 50-session moving average? If yes, the breakout is aligned with the broader trend. If not, the setup warrants extra scepticism.
Stop-Loss Management and Trailing Stops for Safety
Darvas placed his initial stop-loss at the bottom of the current box. This is both logical and mechanically clean. If price breaks out above the box and then falls back through it, the premise of the trade has failed. The box bottom defines the invalidation level.
As price rises and forms a new box, the stop is raised to the bottom of the new box. This trailing stop mechanism is one of the most effective aspects of the system. It locks in profits progressively without requiring discretionary judgment on when to move the stop. Each new box confirmation is an instruction to trail the stop higher.
Volume Considerations for Valid Darvas Box Breakouts
Volume is the most important secondary filter in the system. Darvas was watching stocks with strong institutional participation. A breakout without volume suggests that few participants believe in the move. In equity markets, comparing the breakout volume against the average daily volume over the prior 20 sessions is standard practice. In forex, tick volume serves as a proxy. Several TradingView indicators combine box formation detection with a volume confirmation alert, which simplifies execution significantly.
Identifying Support and Resistance Bands in Darvas Boxes
Each completed box creates a visible support and resistance band on the chart. The box top becomes support on any subsequent pullback. The box bottom marks a level where bulls were previously unwilling to let price fall further. Multiple stacked boxes in an uptrend create a staircase of support levels. In a reversal scenario, those same support levels become resistance. Traders who understand this can use old box boundaries to set target levels or anticipate where pullbacks may stabilise.
| Darvas Box Breakout | Standard Channel Breakout |
|---|---|
| Triggered by close above box top | Triggered by close above channel boundary |
| Box formed from a prior new high | Channel drawn from swing highs and lows |
| Volume confirmation required | Volume often secondary |
| Stop placed at box bottom | Stop placed below channel or swing low |
| New box formation triggers stop trail | Trailing stop based on fixed points or ATR |
| Focus on momentum and new highs | Applicable in trending or ranging conditions |
Q: Where should the stop-loss be placed on a Darvas box trade?
A: The initial stop goes at the bottom of the box that produced the breakout signal. Once a new box forms higher up, the stop is moved to the bottom of the new box. This trailing approach keeps risk defined at all times while allowing profitable trades to run with the trend. Avoid placing stops below arbitrary round numbers; use the actual box boundary.
Setting Up a Trade with Darvas Boxes
Moving from concept to execution requires knowing how to construct boxes accurately and which tools to use on your preferred platform.
How to Draw Darvas Boxes Accurately
To draw a Darvas box manually, identify a session that makes a new significant high. The box top is that session’s high or close, depending on which variation you use. Wait for at least three subsequent sessions where price does not exceed the top or breach the low of the range. The lowest close during that consolidation period defines the box bottom. Draw a rectangle spanning those boundaries. The box remains valid until price closes decisively above or below it.
Common errors include drawing boxes during a trending phase rather than a consolidation phase, and using intraday wicks rather than closes to define boundaries. Darvas himself used closing prices. Using the closing price produces fewer false signals because intraday spikes are filtered out.
Using Darvas Box Indicator on MT4, MT5, and TradingView
Automated Darvas box indicators are available across all major platforms. On MT4, the Darvas box indicator can be downloaded via the MQL4 marketplace or the MetaTrader community; it auto-draws boxes based on configurable lookback periods. MT5 users have access to an updated version of the Darvas box indicator MT5 with additional alert functionality. On TradingView, the Darvas box indicator is available in the Pine Script community library and can be searched directly from the indicator panel. Several versions include a buy-sell signal overlay, volume filter options, and configurable box sensitivity.
Modified Darvas Box Strategy for Modern Trading
Several traders have developed modified Darvas box approaches to account for different market conditions. The most common modification replaces the original three-session confirmation with a dynamic ATR-based range. If price stays within one ATR of the box top for a defined number of sessions, the box is confirmed. This is particularly useful in volatile instruments where a rigid three-session rule produces too few signals.
Another popular modification applies the Darvas framework in conjunction with a trend filter such as a 200-period moving average or an ADX reading above 25. Trades are only taken when the box breakout direction aligns with the macro trend. This reduces counter-trend breakouts, which have a lower success rate in most backtested datasets.
Stock Screeners and Buy/Sell Indicators for Darvas Box Trades
For equity traders, Darvas box stock screeners are available via platforms such as Finviz and Stock Rover, where filters can be set to find stocks simultaneously near their 52-week high and forming tight consolidation ranges. For forex and CFD traders, custom alerts on TradingView or within MT5 can be set to notify when a box boundary is breached on specific instruments. The Darvas box buy sell indicator on TradingView provides visual arrows and configurable alert conditions, making it straightforward to monitor multiple instruments.
Q: Can the Darvas box be used on lower timeframes for day trading?
A: Technically yes, though the original system was designed for daily and weekly data. On lower timeframes, noise increases substantially, and volume filters become harder to apply reliably. Traders using the Darvas framework intraday typically use 1-hour or 4-hour charts as the minimum and apply stricter volume filters. Results on 5-minute or 15-minute charts tend to be inconsistent without additional filters.
Darvas Box Trading Strategies and Applications
The basic breakout setup is just the foundation. Several advanced applications extend the framework into more complex market conditions.
Darvas Box Breakout Strategy Explained
The Darvas box breakout strategy follows a clear sequence. First, identify an instrument in a strong uptrend, ideally at or near a multi-month high. Second, wait for a consolidation box to form meeting the minimum session criteria. Third, place a buy-stop order just above the box top. Fourth, confirm the breakout with volume. Fifth, set the initial stop at the box bottom. Sixth, hold the position and trail the stop as new boxes form. Exit when price closes below the bottom of the most recent box.
This sequence keeps the trader reactive to price action rather than predictive. The system does not attempt to forecast where price will go; it waits for the market to demonstrate its direction and then follows it.
Integrating Trend Following Systems in Darvas Box Trading
Darvas box trading operates best as part of a broader trend following system. Adding a directional filter, such as the ADX or a long-term moving average, ensures that boxes are only traded when the macro structure supports the direction. In a clear uptrend, only long breakouts above box tops are taken. In a downtrend, the logic inverts: boxes form below a series of lower highs, and breaks below box bottoms become short entries. This adaptation works on forex pairs and commodity CFDs as effectively as on equities.
Momentum Trading Techniques with Darvas Boxes
Darvas boxes are fundamentally a momentum trading tool. The entry is triggered by demonstrated strength, not anticipated strength. Traders can enhance the momentum signal by looking for boxes that form after a session with unusually high volume, sometimes called a volume thrust. When a volume thrust precedes the consolidation, it often indicates institutional accumulation during the box phase, which increases the probability of a strong breakout when the range resolves.
Managing 480-Day Accumulation Breakouts in Darvas Boxes
The 480-day accumulation breakout is a concept referenced in advanced Darvas box literature. It describes a scenario where price has traded in a broad base for roughly 480 trading days, equivalent to approximately two calendar years. When this long base is resolved by a breakout above resistance, the subsequent move is typically significant in both magnitude and duration. The Darvas framework handles this by treating the upper boundary of the base as a macro box top. The entry and stop logic applies identically, but position sizing may be adjusted to reflect the higher-conviction nature of the signal.
Understanding Ghost Boxes in Darvas Box Theory
A ghost box is an extension of standard Darvas theory that accounts for boxes that form above the current price level. When price rallies strongly then retreats before a new box fully consolidates, the hypothetical box that would have formed at the prior high is called a ghost box. Traders who use this concept treat the ghost box boundaries as future resistance and support levels. If price subsequently rallies back to the ghost box zone and consolidates there, confirming a new box, the resulting breakout carries additional significance because price has essentially completed an interrupted pattern.
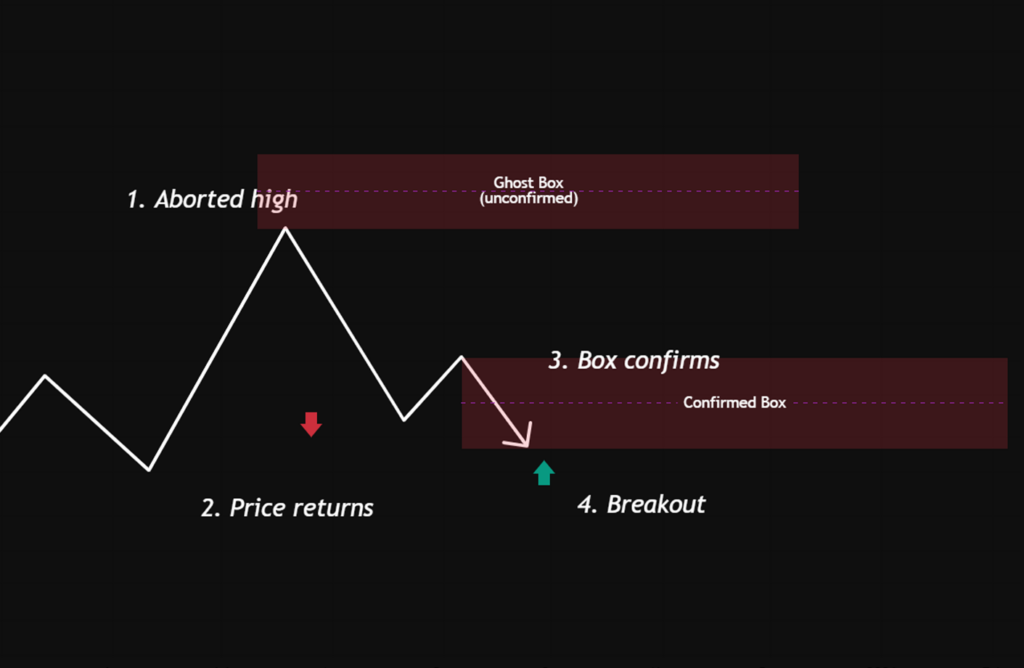
Q: What does a ghost box indicate about price structure?
A: A ghost box suggests that price attempted to consolidate at a certain level, failed to complete the pattern, and then returned. When the return produces a completed box and a subsequent breakout, it indicates persistent demand at that price zone. The ghost box concept is particularly useful for identifying targets during strong trending phases, as price tends to pause at prior ghost box boundaries.
Conclusion
The Darvas box trading strategy has outlasted most systems from its era. Its survival is not sentimental. Breakout traders, momentum funds, and systematic strategies still operate on the same logic Darvas used: find strength, wait for consolidation, enter on the break, and trail the stop. Modern tools have made the framework more accessible without changing its fundamentals.
For traders applying Darvas boxes, consistency matters more than complexity. Draw boxes using closing prices, confirm breakouts with volume, and use each new box formation as a signal to raise the stop. The modified Darvas box approaches and platform indicators available on MT4, MT5, and TradingView make this straightforward to apply across equities, forex, and CFDs. The structure is clear; execution is the variable.


