


In ICT terms, a draw on liquidity is the idea that price usually has a “common-sense” destination. Markets often travel toward places where orders stack up, equal highs, equal lows, prior day high/low, and other obvious swing points. It’s not a magic prediction trick, and it definitely doesn’t mean the price will reverse once it gets there. What order blocks reveal is the price’s next probable destination.
In this guide, you’ll get a clear understanding of what a draw on liquidity actually is, how it’s different from a liquidity sweep, and how to mark internal vs. external targets. We’ll also cover how to follow draws across multiple timeframes by combining time context and price context. Finally, you’ll see live examples so the whole concept stays practical and easy to repeat.

- A draw on liquidity is the probable destination; it should not be considered as an entry signal.
- Liquidity pools often form around obvious levels, where most retail traders put their stoploss.
- A sweep is the event; the draw is the reason price is heading there in the first place.
- Internal targets help you manage the route; external targets define the larger objective.
- Structure and confirmation determine whether an order block can hold the price or not.
- Risk management is the top priority when trading leveraged assets, particularly when applying Smart Money and ICT concepts.
Introduction to Draw on Liquidity
Draw on liquidity is the “destination logic” within Inner Circle Trading (ICT). Before you consider entries, you first plot where the price is most likely to go next based on obvious pools of orders. This section will discuss the significance of the concept and its relevance to actual execution, as well as how ICT defines and sets as objectives that must still be confirmed.
Q: What triggers an entry in a draw-based setup at a liquidity zone?
A: A liquidity sweep into the target, followed by clear displacement away from the level, then a controlled retest that holds.
Q: Where should the invalidation level be placed to reduce stop-outs?
A: Beyond the structural swing that defines the setup, not merely a few points beyond the liquidity level.
What Does Draw on Liquidity Mean?
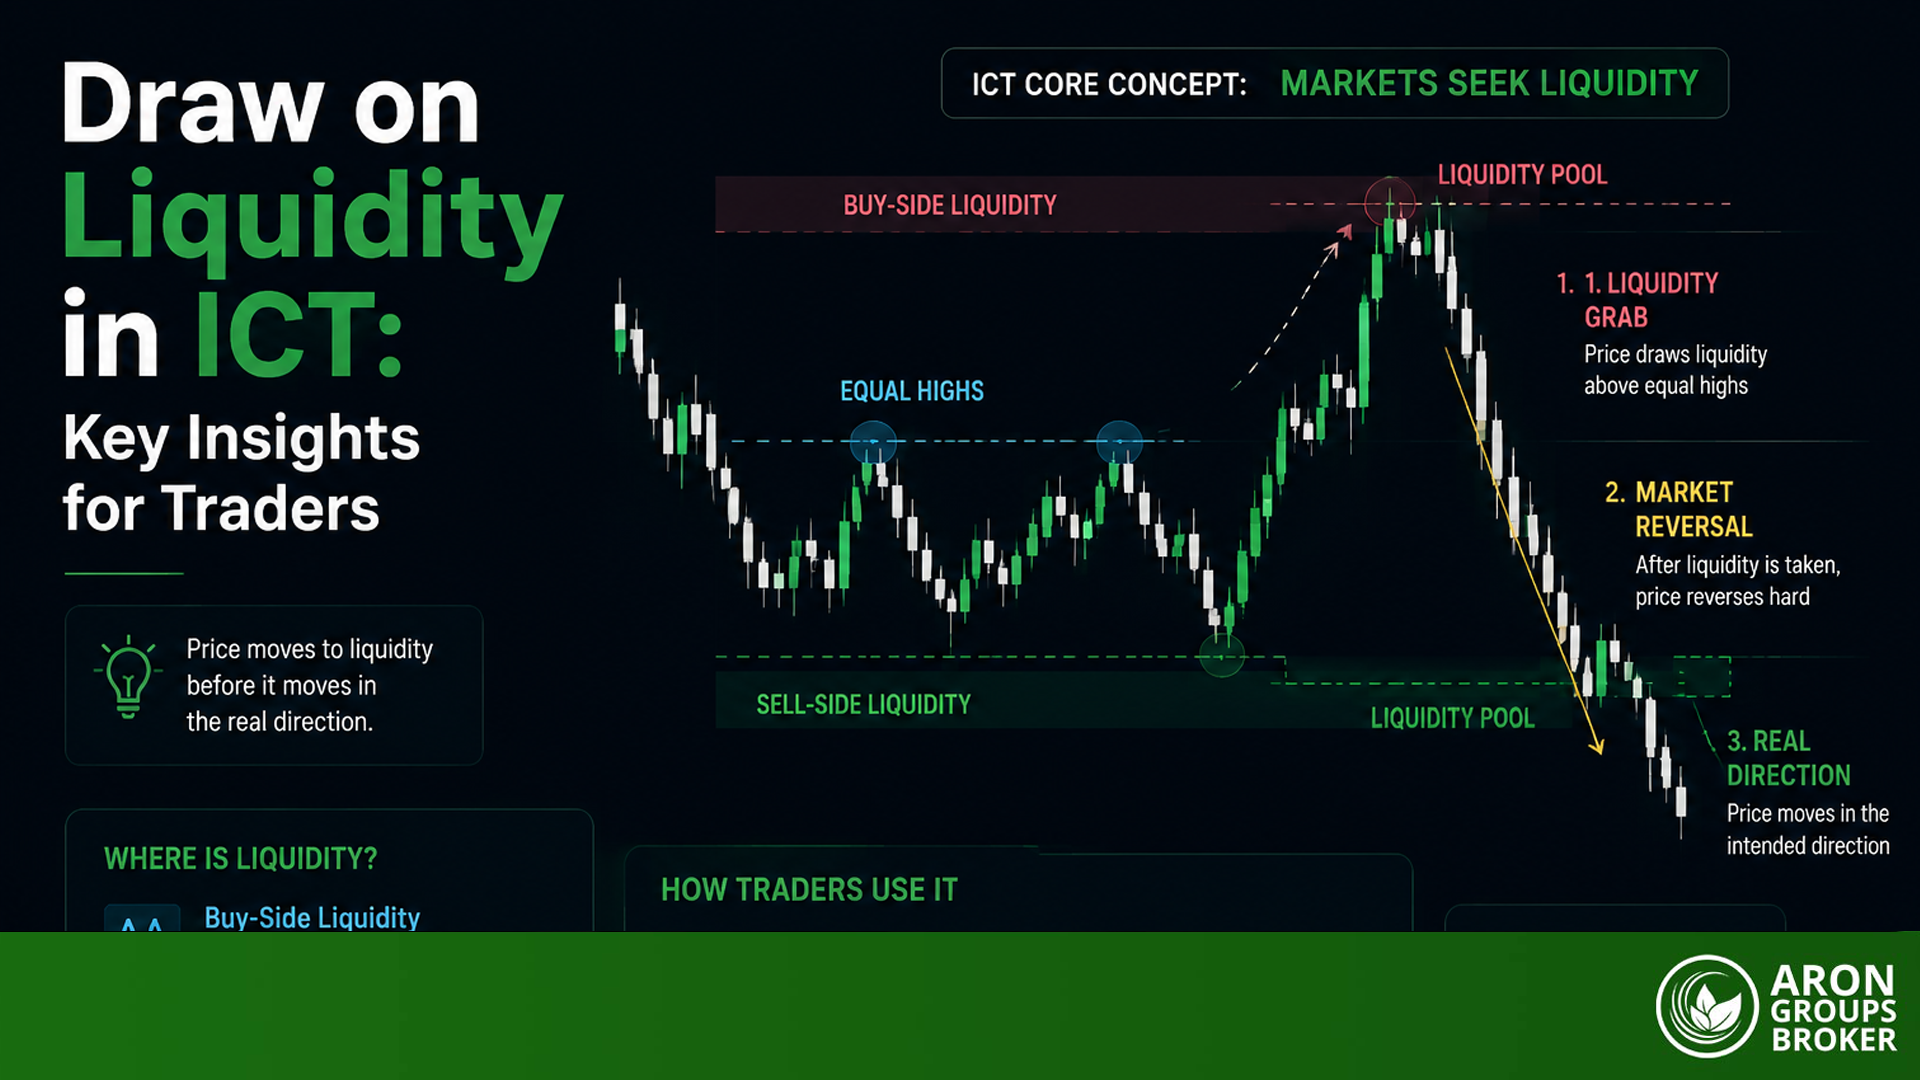
To understand draw on liquidity, you first need to understand what a liquidity pool is. A liquidity pool is a price area where orders are concentrated, allowing a large amount of trading to be executed around that level.
These orders can include Equal highs and equal lows, Prior swing highs and swing lows, Previous day high and previous day low, weekly high and weekly low, Range extremes inside a trading range, take profits, stop losses, Pending orders, and other resting liquidity.
The price often tends to move toward liquidity and grab it because it provides enough fuel for the price to move in the opposite direction through those orders.
Read More: What is Liquidity grab?
Why It Matters in ICT Trading
Utilizing liquidity is essential, as it fosters a more informed price bias, enhances patience, and encourages acceptance of reasonable risk.
Trading decisions are made without speculation:
Reviewing a liquidity zone enables a more accurate assessment of price movements and momentum both toward and away from it.
Patience in Trading:
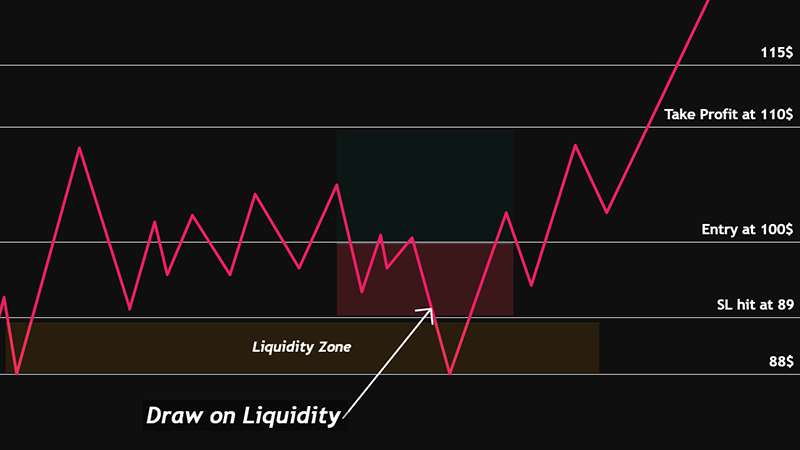
For example, if a buy position is opened at 100 and the price declines to 88, a liquidity zone, the price may subsequently rise to 115 after buy orders are executed.
In this scenario, your stop-loss may be hunted at 90, yet the price could unexpectedly advance to 110.

In certain trading situations, exercising patience and waiting can yield optimal outcomes.
Clarity in Risk Management:
For instance, in the previous scenario, if a position is sold at 100, the 90 level serves as a critical point for exiting, taking partial profits, or minimizing risk exposure.
ICT’s Perspective on Draws
In ICT, price is seen as moving through a series of objectives. A draw is usually described as the next external liquidity target at a higher timeframe, while execution is further defined at a lower timeframe.
A clean top-down perspective would be this:
- Higher timeframe: find the most obvious external pool.
- Mid timeframe: find internal path and reaction points.
- Lower timeframe: wait for confirmation near the level.
Rule: You do not trade the draw; you trade the confirmation at a good location.
Core Concepts of Draw on Liquidity
In ICT, the draw on liquidity becomes operational only when you can specify (1) the target group, (2) the form of liquidity, and (3) the structural context in which the draw remains valid. This section explains the essential components: how a draw differs from a sweep, the behavior of resting liquidity, how buy-side and sell-side targets are allocated, how internal and external goals interact, and how market structure determines whether the draw will be satisfied or replaced.
Q: Which is safer to trade: the move toward the pool, or the reaction after the pool is taken?
A: The reaction is typically safer because you can use the sweep, displacement, and retest to define confirmation and tight invalidation.
Q: How do I choose between internal and external targets for taking profit?
A: Use internal targets for partials and risk reduction, and reserve the external target for the final objective only if structure and momentum remain supportive.
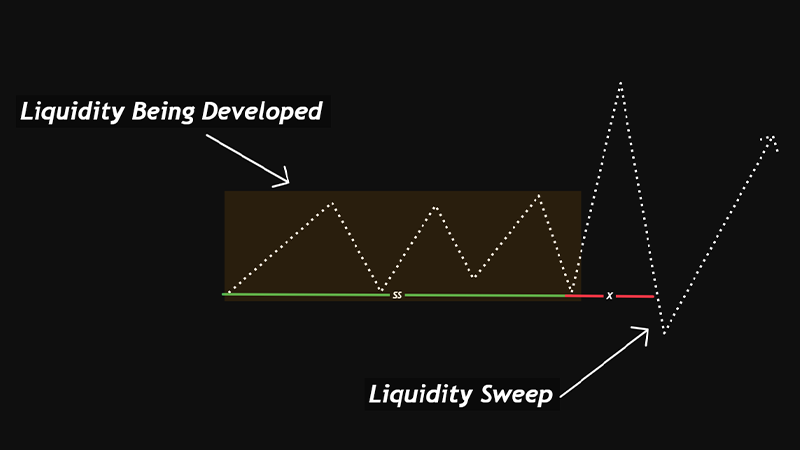
Draw on Liquidity vs Liquidity Sweep
A draw on liquidity is the directional pull toward a pool. A liquidity sweep is the event where price trades through an obvious high or low and executes those clustered orders.
- Draw (why price travels): the market’s likely objective (a destination).
Sweep (what happens at the destination): the raid of liquidity at a level (an event).
Draw on Liquidity vs Liquidity Sweep
In practice, price movement towards liquidity involves two distinct phases, each with a different role in analysis and trading:
- Draw on Liquidity: The Probable Path and Target
- This represents where price is most likely to move because concentrated orders at that level create a natural pull.
- Practical application: Rather than entering a trade immediately, use the draw to identify potential targets and plan your trading path. For example, if there is a clear buy-side liquidity pool above, price is likely to be drawn toward it. As a trader, you observe the path and the probable destination, waiting for confirmation before taking action.
- This represents where price is most likely to move because concentrated orders at that level create a natural pull.
- Liquidity Sweep: Order Execution and Price Reaction
- When price reaches a liquidity level, the clustered orders are executed. This is a real, observable event, often accompanied by rapid movement, temporary breaks, or noticeable wicks.
- Practical application: The sweep is where you can obtain confirmation for entry or exit. If the price reacts strongly after the sweep, it provides a signal for executing trades, setting stop losses, or taking profits.
Key Differences for Traders
| Aspect | Draw on Liquidity | Liquidity Sweep |
|---|---|---|
| Definition | The probable path of price; next likely target | The actual event; execution of orders at the liquidity level |
| Timing | Before price reaches the level | When price touches the liquidity level |
| Trading Use | Identify targets and plan the trade | Confirm entry or exit based on price reaction |
| Practical Example | Mapping the route to the previous day high or weekly low | Rapid movement that triggers stop losses or clustered orders at that level |
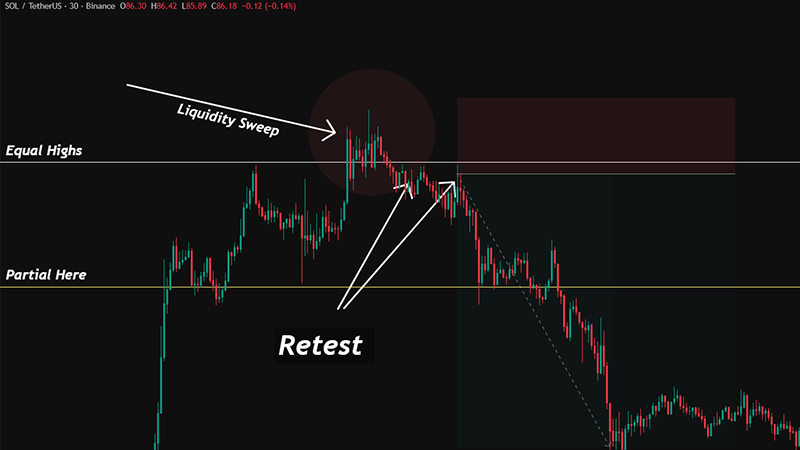
Liquidity sweep above equal highs followed by bearish continuation:
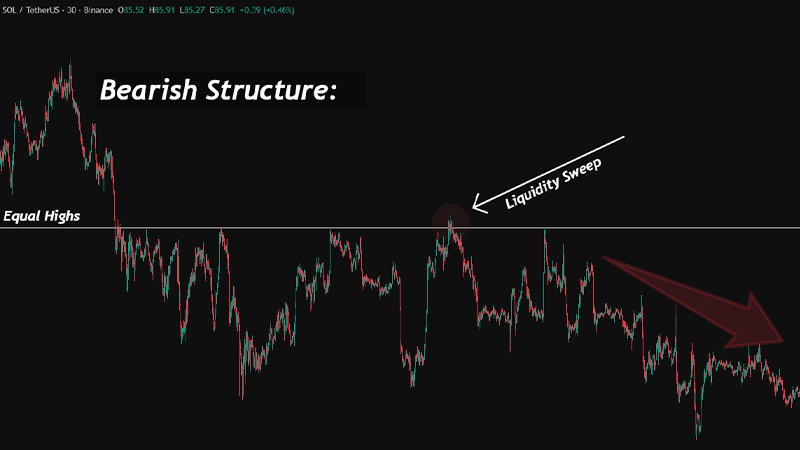
Practical implication: You do not enter simply because a draw exists. You wait to see how price behaves at or after the sweep: acceptance beyond the level or rejection back into the prior structure. |
Resting Liquidity and How Price Reacts
Resting liquidity is made up of orders that sit in the book until triggered: stops, breakout orders, take profits, limit orders, and pending orders.
For a clear breakdown of execution mechanics, review Interactive Brokers before applying liquidity concepts.
When price approaches a dense pool, you typically see one of two outcomes:
- Acceptance: price breaks through and holds beyond the level, often with displacement.
- Rejection: price trades into the pool, triggers orders, then fails to hold and returns into range.
What matters for trading is not the story. It is the reaction:
- Does price displace away with strength?
- Does it retest and hold?
- Does it stall and overlap (warning)?
Best practice: define your plan before the pool is hit: where you expect reaction, where invalidation sits, and what your first internal objective is.
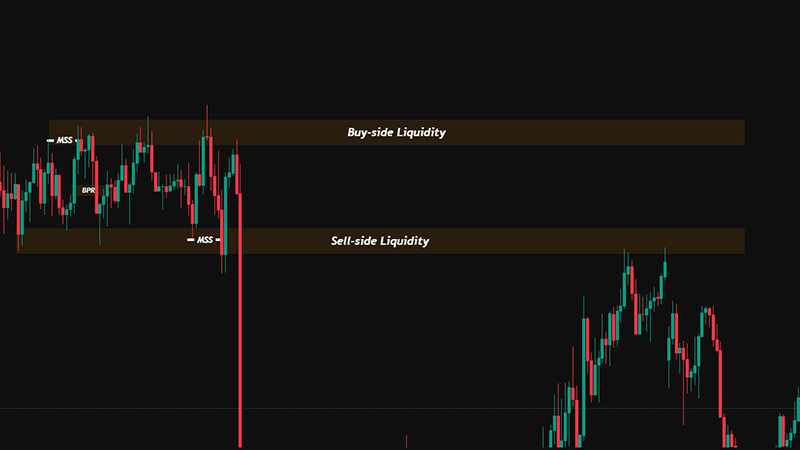
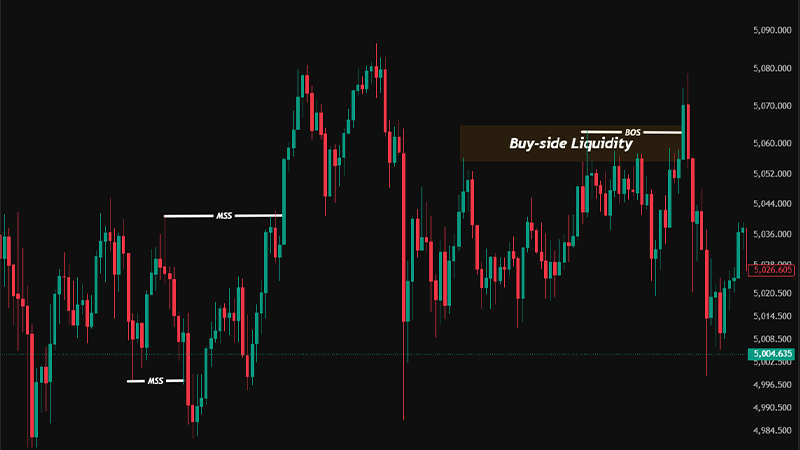
Buy-Side and Sell-Side Liquidity Targets
Liquidity targets are projected as follows:
- Buy-side liquidity (BSL): above obvious highs, equal highs, trendline breakout points, and session highs.
- Sell-side liquidity (SSL): below obvious lows, equal lows, range lows, and session lows.
Shared higher-TF targets:
- Previous day high/low
- Weekly high/low
- Significant swing points
If a higher TF is targeting BSL, you typically refrain from entering shorts in the middle of the trade. You search for long entries consistent with the route until the structure contradicts.
Internal vs External Liquidity Objectives
Here’s how you can differentiate between internal and external liquidity:
- External liquidity contains large, obvious pools at major swing points (PDH/PDL, equal highs/lows on higher timeframes, weekly extremes). These usually define the larger move.
- Internal liquidity contains smaller pools inside the range or leg (minor swing highs/lows, internal equal highs/lows). These usually shape the path and provide partials.
How to apply it?
- An external objective defines the destination.
- Internal objectives assist trade management: partials, risk reduction, and trailing logic.
Example:
If PDH is the external draw (target), an internal equal high inside the range can be your first partial, and the next internal pool can be where you move to break-even.
Draws and Market Structure
The market structure determines whether a liquidity draw remains valid.
A draw strengthens when:
- Price forms higher lows while moving toward a buy-side target.
- Displacement is clean in the draw’s direction.
- Price respects key dealing-range references (premium/discount).
A draw weakens or flips when:
- Market structure shifts clearly on your execution timeframe.
- Price displaces strongly against the expected direction.
- A nearer, cleaner liquidity pool forms on the opposite side and price starts moving toward it.
Rule: treat any draw as a working hypothesis; update the objective when structure changes.
Market Mechanisms Behind Draw on Liquidity
A liquidity draw is best treated as a market incentive, not a mystical force. Price tends to travel toward areas where execution is easier and where resting orders are concentrated. When you understand what can create that incentive, you stop taking random trades and start reading intent through structure and reaction.
Q: What is the most practical way to validate a draw?
A: Track whether price is displacing toward the pool and whether structure supports that path, then wait for confirmation after the pool is interacted with.
Institutional Draws and Big Player Influence
Large participants often need depth to execute. If they want to enter or exit size, they prefer doing it near areas where many orders already exist. Liquidity pools provide that depth.
This is one reason prices frequently revisit obvious highs and lows, equal highs and lows, and higher-timeframe reference levels. The important part for traders is not guessing who is buying or selling. It is recognizing that price movement often improves as it approaches zones where more orders can be executed.
Algorithmic Draws and Automated Movements
Modern markets are mostly automated. Algorithms respond to price, volatility, and order flow conditions. When liquidity is thin, price can move faster, but it can also stall.
When liquidity thickens near a known pool, price can accelerate into that zone because there is less friction.
Many automated behaviours effectively reward moving toward predictable liquidity, then reassessing after the pool is reached.
How Price Targets Liquidity
Price can target liquidity through expansion and through stop runs. Expansion happens when a directional leg displaces cleanly and keeps accepting higher prices or lower prices.
Stop runs happen when price pushes through an obvious level to trigger clustered orders, then either continues or reverses. The draw gives you the likely destination.
The post-event reaction tells you whether the market accepted beyond the level or rejected back into the prior structure.
Liquidity Attraction in Market Behaviour
Liquidity attraction is most visible when the market has a clear reference and a clean path.
- If there is an obvious pool above and the price keeps building higher lows, the pull is stronger.
- If price overlaps, chops, and fails to displace, the draw is weaker and may be replaced by a closer objective.
This is why the same liquidity level can behave differently on different days.
Draws Within the ICT Dealing Range
- Within a dealing range, draws often shift between internal objectives and external extremes. When price is below the equilibrium, it may be drawn toward internal liquidity first, then toward the range high.
- When price is above the equilibrium, it may be drawn toward internal liquidity below, then toward the range low.
A simple image for this section is a range box with equilibrium marked, then arrows showing how internal pools act like stepping stones toward an external target.
Time & Price Perspectives on Draw on Liquidity
Price targets are not enough. Timing changes the probability that a draw will be fulfilled and changes how price behaves when it reaches liquidity. The same level can be rejected in one session and accepted in another.
Applying Time & Price Theory to Draws
Use time as a filter. Liquidity tends to build around session transitions, major opens, and periods when participation increases. When activity is low, price may drift and fail to follow through. When activity rises, price is more capable of traveling to a higher timeframe objective.
The practical lesson is to align your draw with periods when the market can actually deliver movement, then avoid forcing trades during dead zones where spreads, slippage, and chop distort outcomes.
Tracking Draws Across Multiple Timeframes
A clean workflow starts with a higher timeframe objective and ends with a lower timeframe trigger. Identify the external draw on the 4-hour or 1-hour chart, then map internal liquidity on the 15-minute or 5-minute chart, then execute on your entry chart only after confirmation appears.
If the lower timeframe shows a structure shift against your higher timeframe draw, treat it as a warning, not noise. Either reduce expectations or wait for alignment to return.
Identifying Draw on Liquidity in the Market
Identifying a draw is the process of locating obvious pools, ranking them, and choosing the most likely objective based on structure, distance, and timing. You are building a map, then waiting for price to tell you whether the map is still correct.
How to Locate Draw on Liquidity Zones
Start with obvious highs and lows, equal highs and lows, and prior day and prior week extremes. Mark them as potential external pools. Then identify internal pools inside the current range, such as minor equal highs and lows. Next, rank the pools by cleanliness and proximity. Cleaner and more obvious pools attract more attention, but closer pools often get reached first.
Practical Observation Techniques
Focus on behaviour. Watch for displacement into a level, a sweep through the level, and the immediate response.
- If price sweeps and then displaces away, the level mattered.
- If price grinds and overlap, the market is undecided.
The image here is a before-and-after chart, first showing the mapped pool, then showing the sweep and the reaction candles.
Recognising Liquidity Signals in Real Markets
In real conditions, liquidity signals show up as obvious stop clusters being taken, rapid wicks through a level, and then either continuation or sharp reversal.
Your job is to wait for clarity. If you cannot define acceptance or rejection, you do not have an edge.
Trading Strategies Using Draw on Liquidity
The theory of price moving toward liquidity is useful only when applied within a trading strategy. Draw on liquidity merely defines the probable path and target, but execution still requires technical confirmation and, in some cases, fundamental confirmation.
The goal is to trade real price action; take-profit targets that are based on imagination or wishful thinking tend to fail.
ICT Techniques for Effective Draw on Liquidity Trading
Define your take-profit target on a higher timeframe (for example, the 4-hour chart), then wait for the price to reach the premium or discount areas relative to the trading range.
The best setups typically form when price consumes a liquidity pool and then shows a clear, well-defined structural shift with displacement.
Entry and Exit Strategies Around Liquidity Zones
A common trade execution sequence is as follows: first, a liquidity sweep occurs; then displacement develops; after that, a retest takes place; and finally, entry is taken only once the invalidation point has been clearly defined beyond the swing that determines the setup.
For exit management, take partial profits first at internal liquidity. Then, if market structure remains supportive, trail the position toward the external target. If price shifts into overlapping price action or fails to hold the level after the retest, reduce exposure as quickly as possible. For this section, a simple image can be a chart showing the sweep and entry point, with the partial targets and the final target labeled.
Risk Management for Liquidity-Driven Moves
Do not calculate the potential profit first. Profitable traders start by defining the maximum acceptable loss, meaning the total impact after consecutive losses under the worst market conditions.
- If price gives your trade a 2R reward, exit the position or take partial profits.
- Do not move your stop loss. Instead, focus on placing it correctly from the start.
Consecutive losses can erode your emotional control and push you toward revenge trading. It is important to understand that you succeed in financial markets only by having full confidence in your method while maintaining risk management. Changing your strategy and increasing leverage will only make your losses more irreversible.
Conclusion
You can think of draw on liquidity as a perspective that shows you the next potential price move based on the path of money flows. When you follow a clear objective on the chart, price movements start to make sense.
The ICT style allows you to enter trades that follow the trend and, if you are patient, can consistently create large take-profit opportunities for you.
However, many believe that all styles can be profitable, as long as they are implemented correctly and with proper money management. The ICT style is designed for traders who look for small stop losses and large take profits.
In these strategies, the win rate tends to decrease, while the risk reward ratio increases significantly. It is important that your personality aligns with your trading style.


