
icon icon Home
icon icon Accounts
icon icon Quick start
icon icon Symbols

How to Identify Market Direction Using Liquidity and Order Flow

Author
Abe Cofnas
Abe Cofnas
calendar Last update: 31 May 2026
watch Reading time: 9 min

ICT daily bias is a framework for determining whether the market is more likely to be bullish or bearish for the current trading day. Originating from Michael Huddleston’s Inner Circle Trader (ICT) methodology, it focuses on reading the daily timeframe structure, liquidity levels, and institutional order flow rather than relying on a single indicator.

Understanding the daily bias is crucial as it sets the behavioural expectation of the market for the current day, allowing traders to align their strategies with the prevailing market direction and avoid counter trend trades. This article will show you how to read market structure shifts, identify the next draw on liquidity, and use tools like breaker blocks to build your directional bias before dropping to lower timeframes for trade execution.

Traders using Aron Groups Broker’s MT5 platform can apply this approach across Forex pairs, indices, commodities, and crypto CFDs. This is a probability-based method designed to add structure to your trading strategy—not a guaranteed signal service.

bookmark
Key Takeaways
  • The daily bias is the anticipated directional tendency of price movement within a given trading day, indicating whether the market is likely to target upward or downward liquidity.
  • Daily bias is always built from top-down analysis, starting on the daily chart and higher timeframe before refining on intraday charts.
  • Traders typically align their trades with their daily bias to avoid counter-trend losses and filter out low-probability setups.
  • Liquidity draws such as the previous day’s high or low, weekly high or low, and clear swing points act as likely magnets for price direction during a session.
  • Entry confirmation on M15 or M5 remains essential—look for a market structure shift or rejection at a point of interest before executing with Aron Groups Broker.

What Is ICT Daily Bias?

ICT daily bias refers to the anticipated direction—bullish or bearish—of price movement within a single trading day, based on daily timeframe context. Establishing a correct bias is considered a critical step before entering any trade in the ICT method.

To identify the daily bias, traders analyse the daily timeframe order flow, imbalances to rebalance, and the next significant draw on liquidity, which helps in determining the market direction for the day. A bullish bias in forex indicates that the trader expects the next major price movement to be upward, characterised by higher highs and higher lows on the daily chart. A bearish bias signifies that the trader anticipates downward movement, marked by lower lows and lower highs.

Unlike simple trend following, daily bias incorporates where the current price is coming from, where obvious liquidity sits, and whether order flow is predominantly bullish or bearish. In ICT methodology, institutional traders often aim to complete a specific “mission” each day—such as rebalancing a fair value gap or drawing on a clear liquidity pool.

sms-star

Risk Disclosure

CFDs are complex instruments and come with a high risk of losing money rapidly due to leverage. You should consider whether you understand how CFDs work and whether you can afford to take the high risk of losing your money. Past performance is not indicative of future results. This content is provided for educational purposes only and does not constitute investment advice.

sms-star

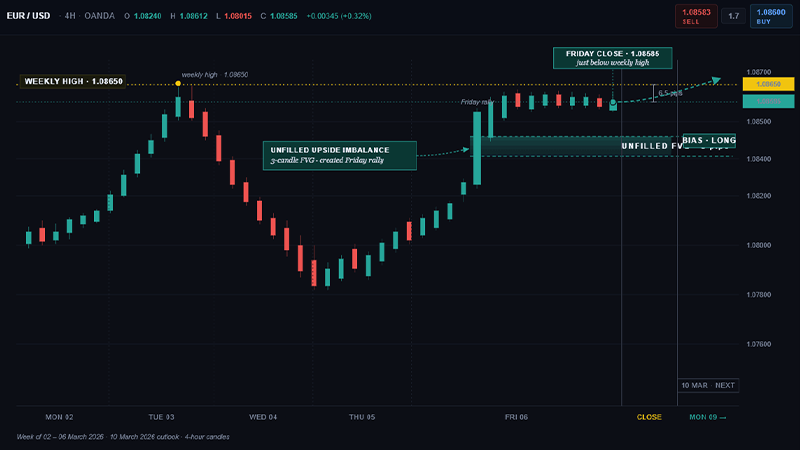
Example: If EURUSD closes on 10 March 2026 just below a weekly high with an unfilled upside imbalance, traders might anticipate a bullish bias for the next trading day as price seeks to rebalance that gap.
What Is ICT Daily Bias?

Q:How long does it take to learn ICT daily bias?

A: Most traders need several weeks to a few months of chart study to become comfortable with daily timeframe order flow, liquidity levels, and market structure shifts. A useful routine involves marking daily bias on major pairs each morning, recording reasons, then reviewing at day’s end to see how price actually behaved. Consistent practice accelerates learning.

How ICT Daily Bias Works

The process begins on the daily timeframe. To identify order flow on the daily timeframe, traders analyse the sequence of breaks, retracements, and liquidity shifts within market structure, focusing on patterns like Break of Structure (BOS) and Change of Character (CHOCH). Traders mark key levels including the previous day’s high and low, weekly high and low, and clear swing points.

The market typically moves toward high liquidity zones, and understanding liquidity helps traders identify areas where price is likely to react. Daily bias is essentially a hypothesis about which side of liquidity—buy-side above previous highs or sell-side below previous lows—is more likely to be targeted during the session.

Imbalances or fair value gaps on the daily chart often attract price, influencing whether the bias is bullish or bearish as the market seeks to rebalance. This top-down view filters intraday setups: traders take longs in a bullish bias day and shorts in a bearish bias day, unless clear evidence of a structural shift appears.

Q: Can I use ICT daily bias on crypto or indices, not just Forex?

A: Yes. The concepts of liquidity, imbalances, and order flow apply to any liquid market, including crypto and major indices offered as CFDs by Aron Groups Broker. However, volatility patterns and session behaviour differ—crypto trades 24/7, for example. Backtest and adapt session expectations accordingly before trading live.

sms-star

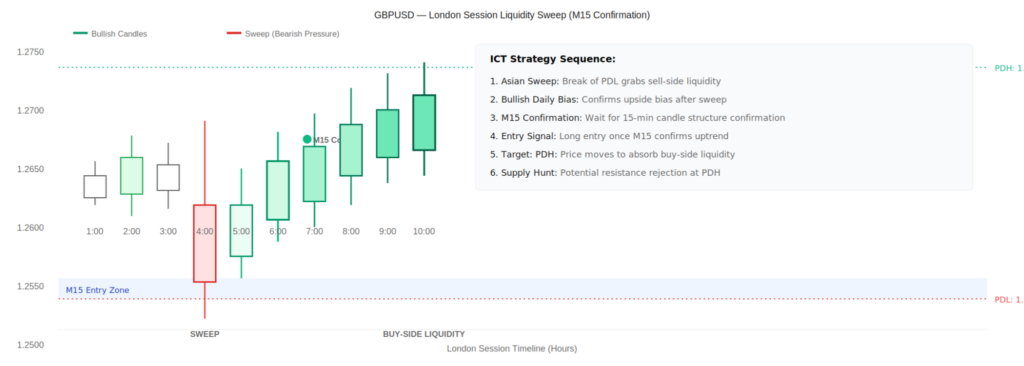
Intraday Example: On GBPUSD during London session, if the Asian session sweeps the previous day’s low (grabbing sell-side liquidity) and the daily bias is bullish, ICT traders anticipate price moving upward to absorb buy-side liquidity at the previous day’s high. They wait for M15 confirmation before entering.

GBPUSD during London session ict

Key Concepts Inside ICT Daily Bias

Several building blocks combine to form a complete ICT daily bias framework. These concepts interact: structure and order flow define direction, while liquidity levels and imbalances define potential targets and reaction zones. Below are the main components.

Daily Timeframe Order Flow and Market Structure

Order flow is the current structure of price movement on the daily chart, indicating whether the market is bullish or bearish based on the formation of higher highs and higher lows or lower lows and lower highs. Bullish order flow occurs when prices create higher highs and higher lows, indicating the market is likely moving upward to absorb liquidity or resolve market imbalances. Bearish order flow is characterised by lower lows and lower highs, suggesting downward price movement.

Market structure shifts occur when price breaks a significant high or low and affect daily bias determination. The distinction between a minor pullback and a genuine shift (BOS or CHOCH) depends on whether a significant swing is broken with strong momentum, signalled by a decisive daily candle close beyond that swing.

sms-star

Example: On XAUUSD in February 2026, price breaks above a daily high with a strong bullish candle, shifting from bearish to bullish order flow. This change informs traders that the dominant market direction has flipped.

Imbalances and Fair Value Gaps

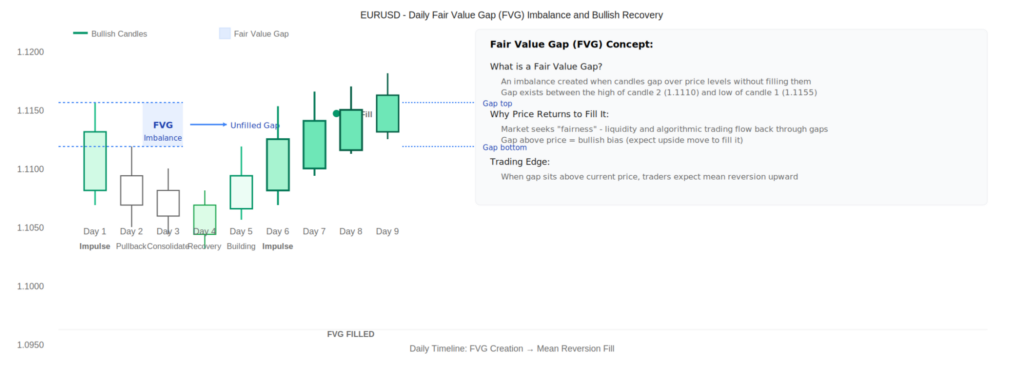
Imbalances or fair value gaps are areas where price moved too quickly, leaving a gap between candles with little trading in between. Price movements are often driven by the need to rebalance imbalances in the market, which can create opportunities for traders to enter positions aligned with liquidity flows.

The market often revisits these zones to “rebalance” price, making them important context for ICT daily bias training. Traders mark these zones on the daily chart, then watch lower timeframes for entry confirmation when price revisits them.

sms-star

Example: A daily fair value gap on EURUSD sitting above current price suggests bullish bias, as price is expected to trade back up into that unfilled upside gap.

How to Identify Market Direction Using Liquidity and Order Flow

Draw on Liquidity

Liquidity in trading refers to the ease with which an asset can be bought or sold without affecting its price significantly. The market typically moves toward high liquidity zones where clustered stop-loss orders and pending orders sit—such as previous highs, equal highs, previous lows, or consolidation boundaries.

Daily bias often focuses on whether price is more likely to raid buy-side liquidity above key highs or sell-side liquidity below previous lows during the current session. Spotting the most probable liquidity draw helps traders avoid fading moves into those levels.

sms-star

Example: After USDJPY takes out the previous week’s low, the next draw on liquidity may be the previous day’s high. Traders with bullish bias expect price to move toward that target.
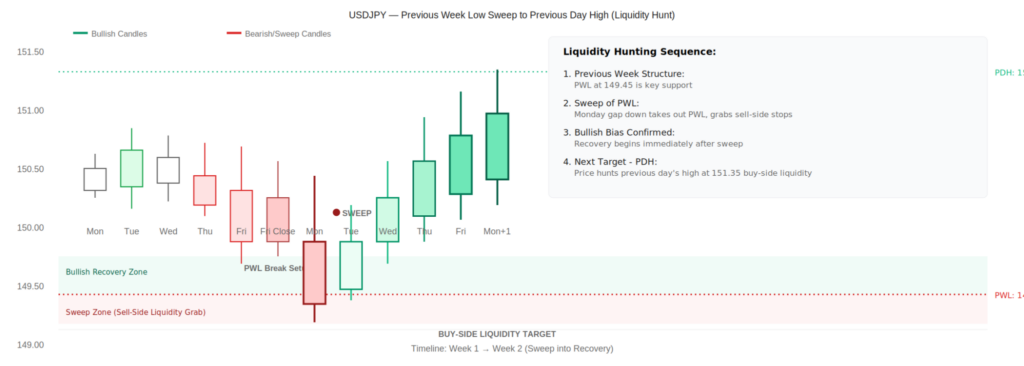
How to Identify Market Direction Using Liquidity and Order Flow

Order Blocks, Breaker Blocks and Liquidity Levels

Order blocks represent the last opposing candle before a sharp reversal, associated with institutional entry. A bullish order block is the last down candle before an up move; a bearish order block is the last up candle before a down move.

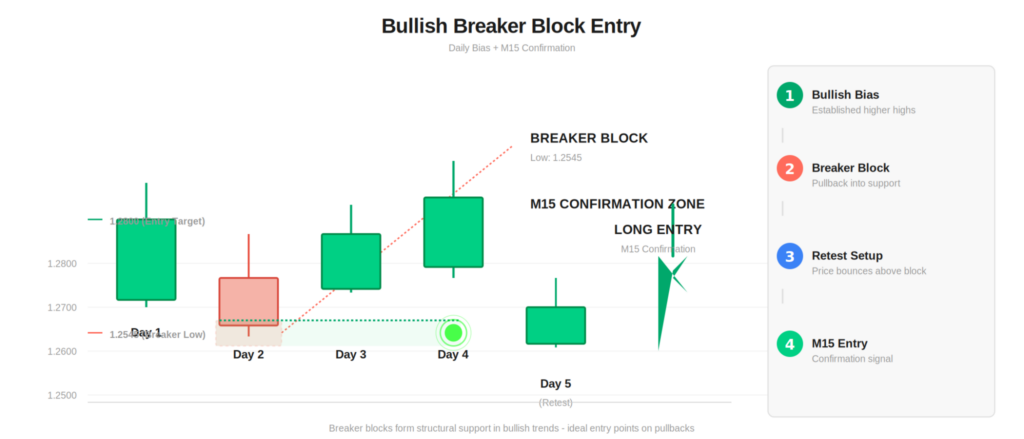
Breaker blocks are failed order blocks that price violates and then uses as support or resistance. Liquidity levels include previous daily highs and lows, session highs and lows (Asian, London, New York), and major swing points on the daily timeframe.

Q: Is ICT daily bias enough to build a complete trading strategy?

A: ICT daily bias is a core framework for direction and context, but a complete trading strategy also needs clear entry rules, risk management parameters, and exit logic. Combining daily bias with defined intraday setups (such as London session reversal at a breaker block) and strict risk limits makes the approach more robust and tradeable.

sms-star

Example: In a bullish daily bias, traders might look for a long entry when price retraces into a bullish breaker block just under the previous day’s low, with M15 confirmation showing buying pressure.

bullish breaker block entry

How to Use ICT Daily Bias Step by Step

Follow this workflow from higher timeframe analysis to intraday trade execution:

  • Start on the daily timeframe. Identify overall trend structure (bullish or bearish), recent market structure shifts, and unfilled imbalances. Note whether price is forming higher highs and higher lows or lower lows and lower highs.
  • Mark key liquidity levels. Plot the previous day’s high and low, weekly high and low, obvious swing highs and lows, and any clean ranges where stops likely sit.
  • Decide on provisional daily bias. Ask where price is more likely to draw liquidity and whether daily order flow agrees. Bullish bias if order flow supports higher moves and liquidity sits above; bearish if the opposite.
  • Drop to H1 or H4. Refine the dealing range and identify points of interest—order blocks, breaker blocks, fair value gaps—that fit with your chosen bias.
  • Move to M15 or M5 for entry confirmation. Not using confirmation signals on lower timeframes can result in traders entering during corrections or liquidity grabs, leading to premature stop-outs. Look for micro market structure shifts, rejection wicks, or small fair value gaps at your POIs.
  • Define invalidation. Pre-determine where your bias would be wrong—for example, a daily low taken and closed through in a supposed bullish day.
  • Set targets and stops. Place take profit at logical liquidity levels (such as the previous day’s high in a bullish day). Position stop loss beyond your POI or recent swing, keeping risk per trade at 1–2%.
sms-star

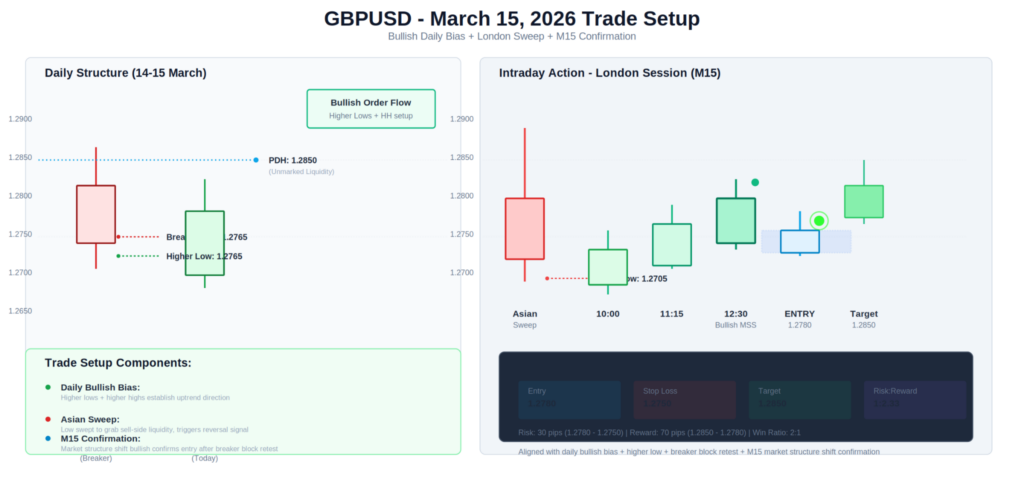
Full Example: On 15 March 2026, GBPUSD shows bullish order flow on the daily with a higher low forming. The previous day’s high at 1.2850 is unmarked liquidity. During London session, price sweeps the Asian low, then shows M15 market structure shift bullish at a daily breaker block. Entry at 1.2780, stop at 1.2750, target 1.2850. This delivers a 2:1 reward-to-risk trade aligned with daily bias.

gbpusd ict trade setup

Q: How do I know when my daily bias is invalidated?

A: Invalidation typically occurs when price violates the structural level or liquidity side your bias was built around. For example, a bullish bias fails after a decisive break and close below the previous day’s low. Pre-define invalidation points on your chart before the session starts and stop trading in that direction if those levels are breached with conviction.

Best Conditions for Applying ICT Daily Bias

ICT daily bias works best under specific market and session conditions:

ConditionWhy It Helps
Clear daily structureObvious higher highs/lows or lower lows/highs make bias determination straightforward
Visible external liquidityPrevious day/week highs or lows provide clear targets
Active sessionsLondon and New York account for roughly 70% of volume, allowing concepts to play out cleanly
Early week (Monday–Wednesday)Weekly range is forming; clearer directional moves
Scheduled high-impact newsLiquidity often clusters near key levels before releases

Traders using Aron Groups Broker should focus on liquid markets—major Forex pairs like EURUSD and GBPUSD, gold (XAUUSD), and indices—during active hours.

During holiday periods or extremely compressed daily ranges, expect price to deliver only partial moves. Adjust expectations and position sizes in such conditions.

Common Mistakes and Risks with ICT Daily Bias

Misreading daily bias can lead to overconfidence and repeated trades against the real flow. Cognitive biases in trading decision-making can lead to unprofitable trades and missed opportunities. Here are frequent errors:

  • Determining bias from lower timeframes only. Many traders mistakenly determine the daily bias based solely on lower timeframes, ignoring the higher timeframe structures that guide market direction, which can lead to entering trades against the prevailing market flow.
  • Ignoring daily liquidity levels. Ignoring daily liquidity levels can result in traders entering positions where price is merely tapping liquidity, leading to unnecessary losses as they trade against the market’s true direction.
  • Mistaking pullbacks for bias shifts. Traders often mistake quick pullbacks or counter-directional moves for a shift in bias, when in fact these are typically corrections or liquidity grabs.
  • Failing to consider previous day’s close. Failing to consider the previous day’s candle close can lead to incorrect bias interpretations, as the closing position relative to liquidity pools and market structure is crucial for determining the next day’s path.
  • Assuming prior movement predicts current trends. Assuming prior price movement predicts current trends can result in incorrect bias assumptions.
  • Confirmation bias. Confirmation bias can lead traders to ignore contrary indicators when validating their existing bias.

Recommendation: Log your daily bias decisions in a journal—pair, date, bias, reason, outcome—to identify recurring mistakes and refine your process.

Q: What is the best timeframe for trade execution with ICT daily bias?

A: Many ICT-style traders set daily bias on the Daily or H4 charts, refine context on H1, and execute trades on M15 or M5 for precise entries. Traders on Aron Groups Broker can experiment with these intraday timeframes on MT5 to find which combination offers enough detail for high probability entries without becoming overwhelming or generating excessive noise.

Tools, Indicators and Platforms That Can Help

While ICT concepts are primarily price-action based, some tools support decision making:

  • Simple structure indicators can highlight swing highs and lows and trend direction without overcomplicating charts.
  • MT5 on Aron Groups Broker can be configured with custom ICT-style indicators for fair value gaps, session ranges, or liquidity levels. These should support, not replace, manual analysis.
  • Economic calendar integration helps track major news events that can accelerate liquidity grabs or invalidate bias.
  • Multiple chart layouts allow simultaneous viewing of daily, H1, and M15 timeframes.
  • Price alerts near key liquidity zones notify traders when price approaches decision points.

These features assist in applying the daily bias plan efficiently while maintaining focus on the underlying price action.

Risk Management and Best Practices

Even a well-defined ICT daily bias only creates a probabilistic edge. Enhanced risk management remains mandatory.

PracticeImplementation
Risk per trade0.5–2% of account balance
Daily risk capLimit total exposure to prevent large drawdowns
Stop-loss placementBeyond the POI, swing, or liquidity level expected to hold
Partial profitsTake partials at intermediate liquidity levels
Trailing stopsMove to breakeven after first target, trail behind structural swings

Avoid over-leveraging CFDs. Test your ICT daily bias trading strategy on a demo account or small live size with Aron Groups Broker before scaling up. This significantly improves long-term consistency by allowing you to refine your approach without substantial capital at risk.

Conclusion

ICT daily bias is a structured way to decide if the trading day is more likely bullish or bearish by combining daily timeframe market structure, liquidity levels, and imbalances. The daily bias serves as a directional anchor for traders, helping them align their trades with the expected market movement based on liquidity draws and market structure.

This framework helps traders filter setups, time entries on lower timeframes, and avoid fighting obvious draws on liquidity. However, it must be paired with strict risk management and clear invalidation rules. No framework eliminates losses entirely—probabilities and discipline determine long-term success.

To build confidence, pick one or two major pairs on Aron Groups Broker, mark your daily bias each morning for a month, and review results. This consistent practice, combined with journaling, will refine your ability to read institutional order flow and execute with the dominant direction rather than against it.

Continue Reading
not-found
calendar 31 May 2026
Rate this article

Leave a Reply

Your email address will not be published. Required fields are marked *

No thanks