
Accumulation, manipulation, distribution is a smart-money model describing how price moves through three phases: a quiet range where large positions are built, a false move that sweeps liquidity and traps traders on the wrong side, and then the sustained move in the intended direction. It is usually abbreviated AMD, and it is the same model ICT calls the Power of 3.
The model’s appeal is that it gives a session a narrative shape rather than a series of unrelated candles. Instead of asking what price is doing right now, it asks which phase price is in, which turns a chart into a sequence with an order to it. Read carefully and tested honestly, that sequence can become a real trading edge; read loosely, it becomes a story that explains every outcome after the fact.
This guide defines each phase, traces the model’s Wyckoff lineage and what ICT added to it, shows why the pattern is fractal across timeframes, explains why a higher-timeframe bias is not optional, walks through trading the distribution phase, disambiguates AMD from two things it is often confused with, and closes with the days when the model simply does not apply.
- AMD describes three phases: accumulation builds positions in a quiet range, manipulation sweeps liquidity with a false move, and distribution delivers the real move.
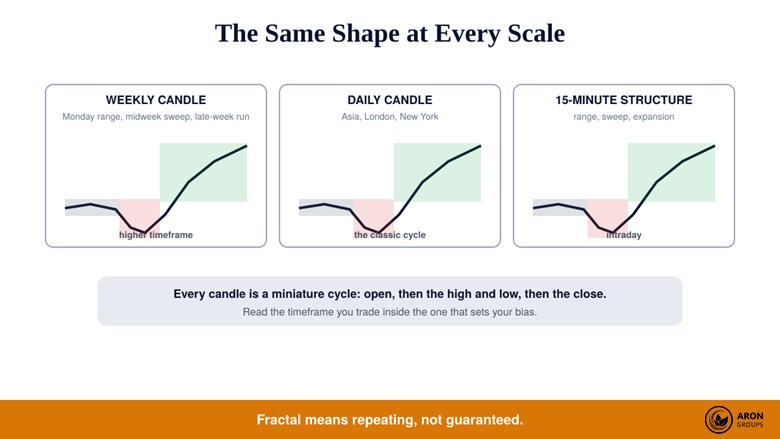
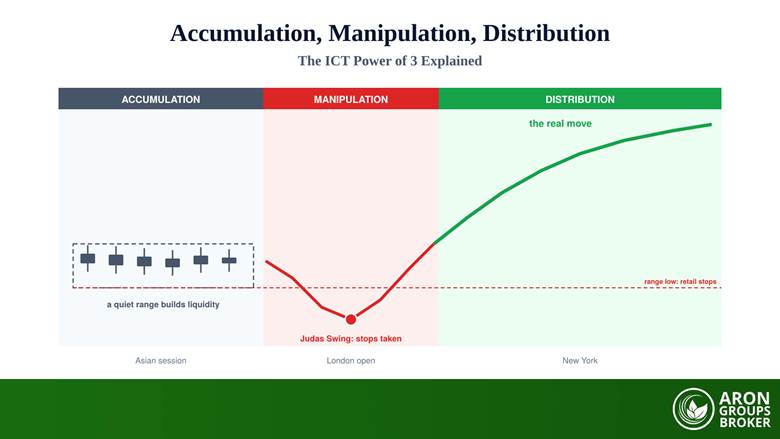
- On a daily cycle the phases often map to sessions: the Asian range accumulates, the London open manipulates, and New York distributes.
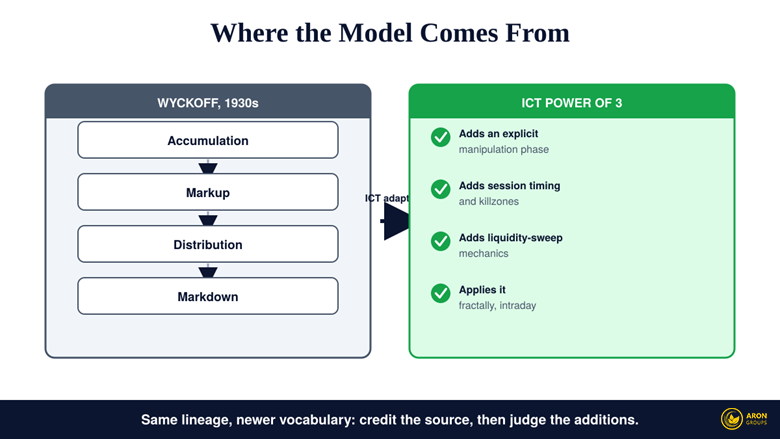
- The model descends from Richard Wyckoff's 1930s accumulation and distribution cycles; ICT added the explicit manipulation phase, session timing, and liquidity mechanics.
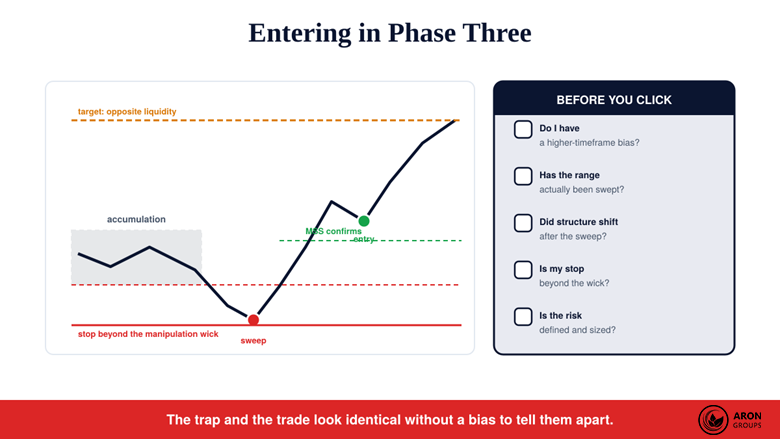
- Entries belong in phase three, after the sweep is confirmed by a structure shift; entering during manipulation is entering the trap itself.
- Without a higher-timeframe bias, manipulation and distribution look identical, and the pattern does not appear cleanly every single day.
What Is Accumulation, Manipulation, Distribution?
AMD is a framework for reading intent behind price movement. The claim is that large participants cannot enter or exit meaningful size at a single price, so they build positions gradually inside a range, engineer a move that generates the liquidity they need by triggering resting orders, and only then let price travel in the direction they wanted. Foreign exchange market microstructure research describes the underlying constraint plainly enough: large orders must find counterparties, and resting stop orders are the most predictable counterparties available. AMD is one interpretation of what that constraint looks like on a chart.
Risk Disclosure
CFDs are complex instruments and come with a high risk of losing money rapidly due to leverage. You should consider whether you understand how CFDs work and whether you can afford to take the high risk of losing your money. Past performance is not indicative of future results. This content is provided for educational purposes only and does not constitute investment advice.
AMD, AMD-E, and the Power of 3
You will meet the same idea under several labels. Power of 3 is ICT’s name for the three-phase version. Some traders write AMD-E, adding expansion as a fourth phase to separate the initial delivery from the extended run that follows. The distinction is cosmetic for most purposes: whether you count three phases or four, the sequence is a range, a sweep, and a directional move, and nothing about how you trade it changes with the label.
The Three Phases in Detail
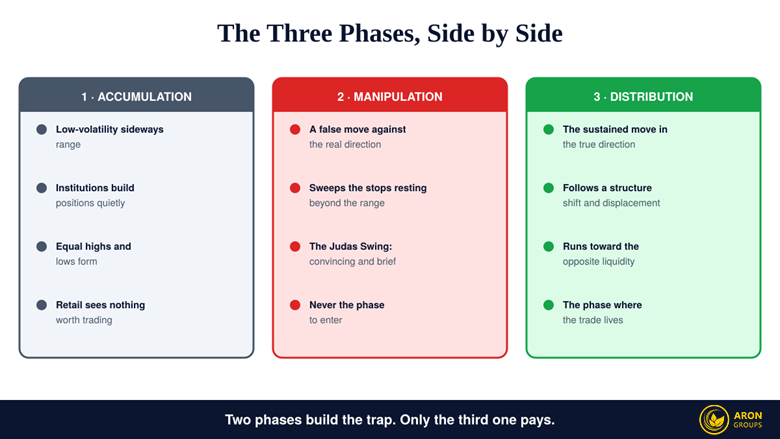
Each phase has a distinct signature on the chart, and learning to name them in real time is most of the skill. Accumulation is low volatility and sideways: a compressed range, often overnight or around the daily open, printing equal highs and lows that quietly advertise where stop orders sit. Manipulation is the sharp false move that runs one side of that range, sweeping those stops and convincing traders that a breakout has begun. Distribution is the sustained move in the opposite, genuine direction, usually beginning after structure confirms the reversal.
Three phases, three signatures: only the last one is a place to trade.
| Phase | What price looks like | Typical session | What to do |
|---|---|---|---|
| Accumulation | Quiet, sideways range with equal highs and lows | Asian session or around the daily open | Mark the range; take no trade |
| Manipulation | A sharp false move sweeping one side | Often the London open | Wait; this is the trap |
| Distribution | Sustained directional delivery | Often New York | Enter after confirmation, with defined risk |
Session timings are tendencies, not a schedule the market is obliged to keep.
The Judas Swing
The manipulation phase has a nickname worth knowing: the Judas Swing, so called because it betrays the traders who believe it. Its characteristics are consistent enough to recognise: it moves against the direction the day eventually takes, it is fast and convincing, it clears an obvious high or low rather than stopping short of one, and it reverses relatively quickly once the liquidity beyond that level has been taken. Traders who take breakout entries during this phase are, in the model’s own terms, providing the fuel for the phase that follows.
The Wyckoff Lineage: Giving Credit Where It Is Due
AMD is not a new discovery, and the honest version of this topic says so. Richard Wyckoff described accumulation and distribution cycles in the 1930s, laying out four phases, accumulation, markup, distribution, and markdown, to explain how large operators build and unload positions while the public reacts. The vocabulary of composite operators, ranges, and shakeouts all originates there.
A 1930s framework with a modern layer added: the additions are real, and so is the debt.
What ICT added is genuine rather than trivial. The manipulation phase is made explicit and named rather than left as Wyckoff’s shakeout, the model is tied to specific session timings and killzones rather than to undated market cycles, liquidity-sweep mechanics are described precisely, and the whole thing is applied fractally to intraday forex charts rather than to multi-month equity campaigns. Knowing the lineage matters for judgement: an idea with ninety years of history behind it deserves more consideration than a novelty, and it also means the concept is not a secret anyone should be charging you to learn.
Why the Model Is Fractal
The most useful property of AMD is that it repeats at different scales. The daily candle is the classic illustration: the Asian session accumulates, the London open manipulates, and New York distributes, so one day’s candle is one complete cycle. Zoom out and the same shape can appear in a weekly candle, where an early-week range gives way to a midweek sweep and a late-week run. Zoom in and a fifteen-minute structure shows the same three acts inside a couple of hours. Every candle, read closely, is a miniature version: it opens, it reaches its high and low in some order, and it closes somewhere between them.
The same three acts at three scales, which is what makes the model portable across timeframes.
Q: Which timeframe should I actually use?
A: Two, always. Use a higher timeframe to establish bias and the range that matters, then drop to a lower one to time the entry after the sweep. Using a single timeframe is what makes traders read every pullback as manipulation and every manipulation as the real move.
The Higher-Timeframe Bias Is Not Optional
Here is the gap most explanations leave open: without a higher-timeframe directional bias, manipulation and distribution look exactly the same. Both are sharp directional moves out of a range. The only thing that distinguishes the trap from the delivery is knowing which way the larger picture is leaning, because the manipulation runs counter to it and the distribution runs with it. That bias comes from the daily or four-hour structure, from premium and discount positioning within the higher-timeframe range, and from where the obvious untouched liquidity sits. Establish it before the session, write it down, and let it decide which sweep you are willing to trade, then check the whole approach the way any rule set should be checked, through out-of-sample backtesting.
How to Trade the Distribution Phase
The sequence is deliberately patient. Identify the accumulation range and mark its high and low. Wait for the manipulation sweep to take out one of those levels. Demand confirmation that the move has failed, a market structure shift or change of character, ideally with displacement leaving an imbalance behind. Enter in the distribution phase on the retracement that follows, place the stop beyond the manipulation wick so that being wrong is defined by the trap itself, and target the liquidity on the opposite side, running from internal range liquidity toward external range liquidity. Every one of those distances should clear a fixed risk-to-reward ratio before the trade exists.
Mark the range, let the sweep happen, wait for structure, then enter with the stop hidden beyond the trap.
One rule carries most of the value: never enter during phase two. The manipulation move is specifically designed to look like an opportunity, which is why chasing it feels so natural at the time. Size the position from the stop distance using deliberate position sizing rather than from how convincing the move looks, and let volatility context, from tools such as Keltner Bands, tell you whether the sweep was genuinely outsized or merely normal noise on a quiet day.
Mini Example: A London Sweep, a New York Delivery
Daily structure is bullish and price sits in the lower half of the weekly range, so the bias is long. Through the Asian session EURUSD compresses into a forty-pip range with tidy equal lows beneath it. That range gets marked, and nothing is traded.
At the London open price drives through those equal lows, taking stops, then reverses within the hour. A fifteen-minute change of character confirms the failure and leaves a small gap behind. The entry is on the retracement into that gap, the stop sits below the sweep low, and the target is the untouched high from the previous session. The trade was available for roughly twenty minutes; the preparation took all morning.
Two Things AMD Is Not
Search results for AMD mix three unrelated subjects, and it is worth stating the distinctions plainly. First, this AMD is a price-action model and has nothing to do with Advanced Micro Devices, the semiconductor company whose stock ticker is AMD; if you arrived looking for equity research, this is the wrong page. Second, it is not the Accumulation/Distribution line, the volume-based indicator developed by Marc Chaikin, which measures money flow using closing position within each bar’s range. That indicator shares two words with this model and nothing else: one is a calculated oscillator, the other is a narrative framework for reading phases of a session.
The Honest Framing: When AMD Does Not Apply
The pattern appears with real consistency, but not every single day, and pretending otherwise is how traders force setups onto charts that do not have them. On major news days the cycle is disrupted, because a scheduled release can deliver the entire move without any manipulation phase at all. On very low-volatility days it is compressed to the point of being untradeable. On strongly trending days accumulation may never form. And the wider ICT premise that markets are algorithmically engineered to hunt retail orders is a viewpoint rather than an established fact, one worth holding loosely precisely because it can explain any outcome after it has happened.
Treat the model as a probabilistic lens, and keep the base rates in view: European regulators found the large majority of retail accounts lose money on leveraged products, and investor-education guidance on leveraged strategies is blunt that magnified exposure magnifies every misread phase. Risk management, not pattern recognition, is what keeps an account alive long enough for a probabilistic edge to show up.
Practising It With Aron Groups
AMD costs nothing to learn and nothing to mark up by hand: a range, a sweep, and a structure shift need no indicator. Chart the sequence wherever you analyse, then execute on the MetaTrader 5 platform at Aron Groups with alerts at your range boundaries so the sweep finds you rather than the other way round, and treat our guide on how to trade forex as the foundation beneath the model.
Because the model rewards patience above all, rehearse it on a demo account first, logging every session you correctly identified and every one you forced. Then move to a small account where micro volumes keep early live lessons cheap.
Judge the results as a professional trader would, by a steadier equity curve over many sessions rather than by the one morning the London sweep behaved perfectly.
Conclusion
Accumulation, manipulation, distribution gives a session a spine: a range where positions are built, a false move that harvests the stops resting around it, and a delivery in the direction that was intended from the start. It descends from Wyckoff, it repeats fractally from the weekly candle down to fifteen minutes, and its practical instruction is unusually clear, which is to do nothing during the first two phases.
What makes it workable is everything around it: a higher-timeframe bias so the trap and the trade can be told apart, structural confirmation before entry, a stop hidden beyond the manipulation wick, and a systematic process that survives the days when the pattern never shows up. Hold it as a lens rather than a law, put capital preservation ahead of any single session’s story, and AMD earns its place on the chart.
Frequently Asked Questions
Quick answers to the questions traders ask most about the AMD model and the ICT Power of 3.
What is AMD in trading?
AMD stands for accumulation, manipulation, distribution: a model describing how price builds positions in a quiet range, sweeps liquidity with a false move, then delivers the real move in the intended direction. It is the same concept ICT calls the Power of 3.
Is AMD the same as the ICT Power of 3?
Yes. The two names describe one model. Some traders write AMD-E, adding expansion as a fourth phase to separate the initial delivery from the extended run, but the sequence and the way it is traded remain the same.
Where do I enter in the AMD model?
In the distribution phase, after the manipulation sweep has been confirmed by a market structure shift, typically on the retracement that follows. The stop belongs beyond the manipulation wick and the target is the opposite side’s liquidity. Entering during manipulation means entering the trap.
Does the AMD pattern happen every day?
No. It appears with consistency but not daily. Major news releases can deliver a move without any manipulation phase, very quiet days compress the cycle beyond usefulness, and strong trends may skip accumulation entirely. Forcing the model onto those days is the most common way traders lose money with it.