
icon icon Home
icon icon Accounts
icon icon Quick start
icon icon Symbols

SOPR (Spent Output Profit Ratio): Reading On-Chain Profit-Taking and the 1 Line

Author
Abe Cofnas
Abe Cofnas
calendar Last update: 4 October 2026
watch Reading time: 8 min

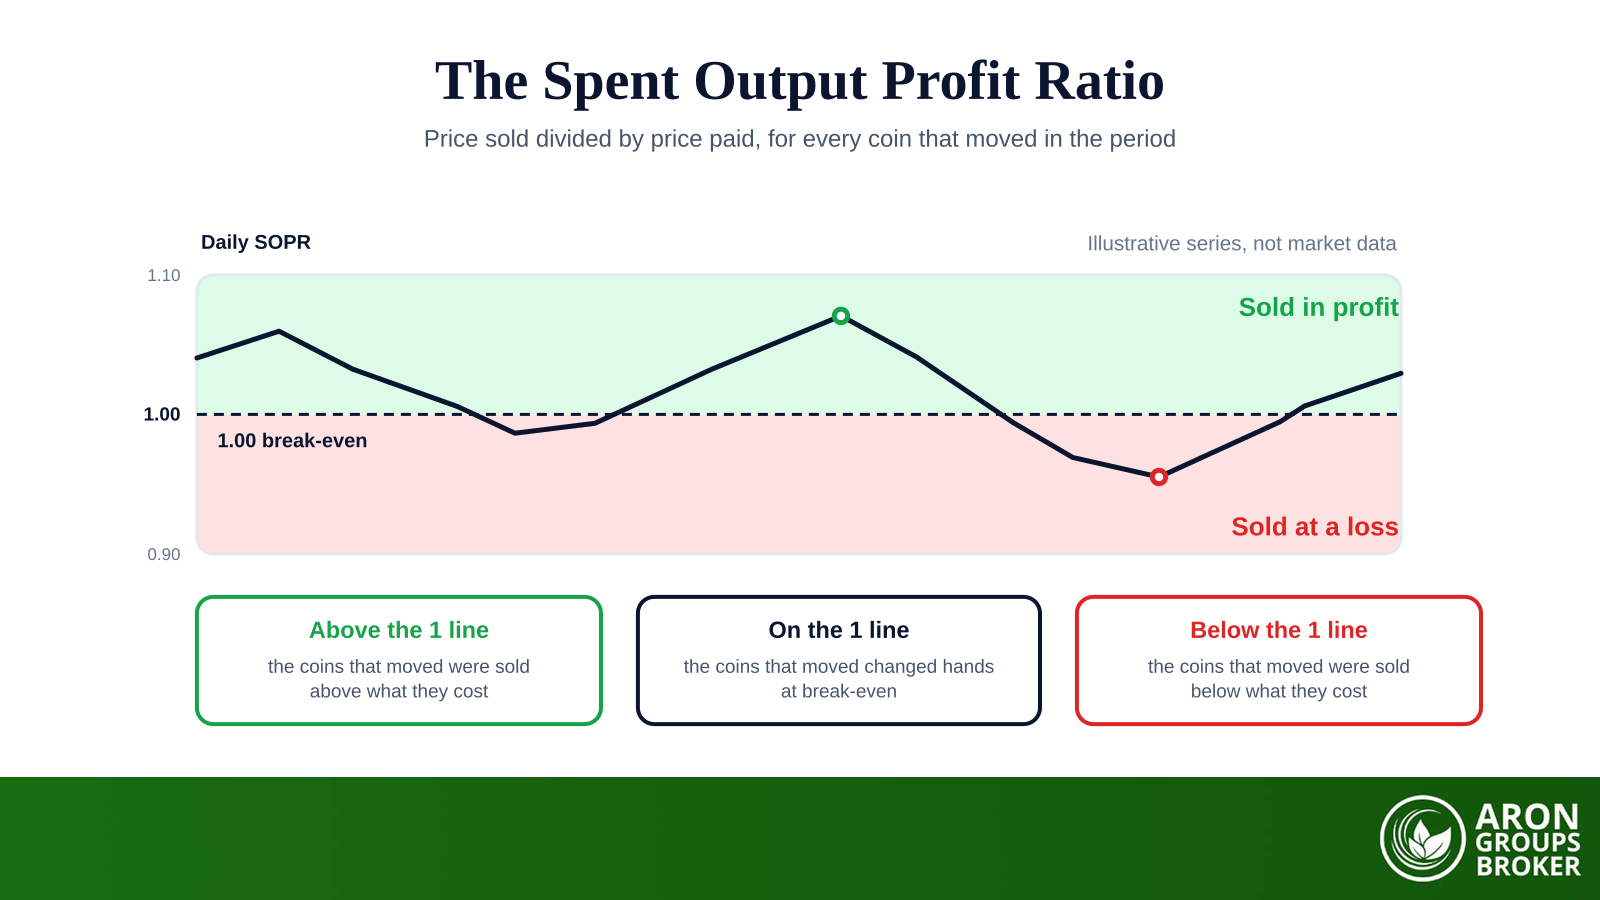
SOPR, the spent output profit ratio, shows whether the coins moved on a blockchain were sold above or below what their owners paid. For each spent output it divides the dollar value at the moment of spending by the dollar value when that output was created. Aggregated over a day, a reading above 1 means the coins that moved were in profit on average. A reading below 1 means they were sold at a loss.

The metric exists because a public blockchain records something no price chart can: the price at which every unit of supply last changed hands. That gives an observable cost basis for the whole network, and it turns a question about sentiment into an arithmetic one. Traders who build systematic rules value that property, because an accounting identity is easier to test than a narrative.

This guide explains how the ratio is built from spent outputs, and why the 1 line attracts so much attention. It covers aSOPR and the two holder cohorts, then sets SOPR against MVRV. It works through an illustrative period of spending, and states plainly what the metric cannot see.

bookmark
Key Takeaways
  • SOPR divides the price coins were spent at by the price they were acquired at, aggregated across the period.
  • Above 1 the coins that moved were sold in profit; below 1 they were sold at a loss; 1 is break-even.
  • The 1 line tends to act as support in a bull market and resistance in a bear market, for behavioural reasons.
  • aSOPR strips out outputs younger than one hour, and the holder cohorts split at 155 days.
  • It is a record of settled on-chain behaviour, not a forecast, and exchange and derivatives flow are invisible to it.

What SOPR measures

SOPR measures the realised profit or loss of the coins that actually moved in a period, expressed as a ratio rather than a sum. It ignores the coins that sat still, which is the point: only spending reveals a decision. A reading of 1.05 says the moved coins changed hands five per cent above their aggregate cost.

sms-star

Risk Disclosure
Trading forex and CFDs carries a high level of risk and can result in the loss of all your capital. This content is educational and is not investment advice. Never risk money you cannot afford to lose.
The ratio in plain terms

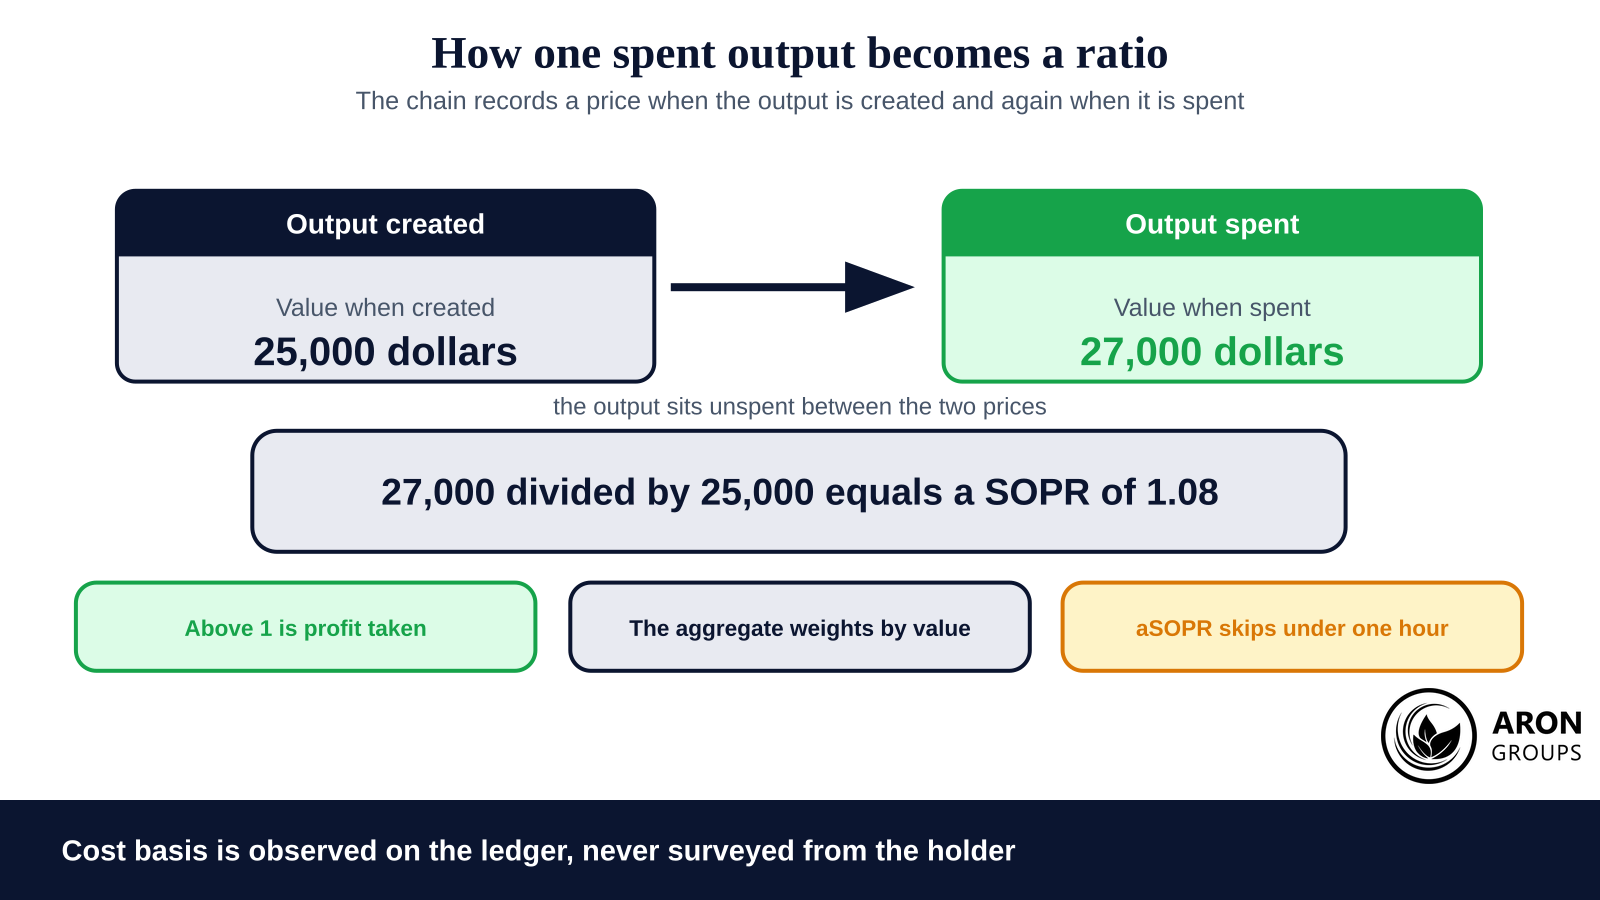
Price sold divided by price paid, across everything that moved. Each spent output carries its own acquisition price, fixed at the moment that output was created. When the output is later spent, the chain records a second price. The ratio between the two is that output’s profit multiple, and SOPR is the aggregate of all of them.

Who built the metric, and when

Renato Shirakashi created SOPR and published it on 25 April 2019. The post, Introducing SOPR: spent outputs to predict bitcoin lows and tops, ran in the Unconfiscatable publication on Medium. Glassnode later productised the metric, put it on the chart most analysts now read, and credits Shirakashi in its own documentation.

Two attributions circulate that are wrong. SOPR was not introduced by Glassnode, and it was not an Unchained Capital metric. That firm published HODL Waves, a separate piece of work written by Dhruv Bansal in April 2018.

How the ratio is built from spent outputs

The calculation is built on unspent transaction outputs, the discrete parcels of coin that a Bitcoin style ledger actually tracks. A transaction consumes existing outputs and creates new ones, so every parcel carries a timestamp and a price from the moment it last moved. That price is its cost basis, and the network stores it whether the owner wanted it recorded or not. Nothing about the owner is known, only the parcel and its two prices.

The acquisition price is taken from the ledger rather than from the holder, which is why the cost basis is observed instead of surveyed.

Two details decide what the printed number means. The aggregation is weighted by value, so one large old output can outweigh dozens of small recent ones. The period matters as well, because a daily series and an hourly series built from the same chain tell different stories about the same move. Neither choice is wrong, but a chart that hides them is hard to compare with anything else.

Reading the 1 line

Above 1 the coins that moved were sold in profit, and below 1 they were sold at a loss. At exactly 1 the sellers as a group broke even. That part is an accounting fact rather than a signal. Unlike a volatility band or any other price derived study, the input here is settled transactions, and the reading layered on top is behavioural.

In a rising market SOPR tends to hold above 1, and dips towards it are shallow. The reasoning is that holders in aggregate resist selling below cost, so supply thins out as the ratio approaches break-even. In a falling market the same logic runs backwards, because a rally that lifts SOPR back to 1 hands trapped holders their exit.

sms-star

Key Point
The 1 line is a break-even level for the coins that moved, not a price level. It can only behave like support or resistance if enough holders act the way earlier cycles suggest.
Reclaiming the 1 line from below is watched for the same reason. It says the average coin now changes hands at a profit again. That is a change in the population of sellers, not a forecast about price. Treat it as a description of who is selling, and pair it with your own structure and risk rules.

aSOPR and the two holder cohorts

Three published variants matter, and each answers a slightly different question. Adjusted SOPR, written aSOPR, filters out every output with a lifespan shorter than one hour. That removes internal transfers and other economically meaningless movement, which makes the line quieter without changing what it measures.

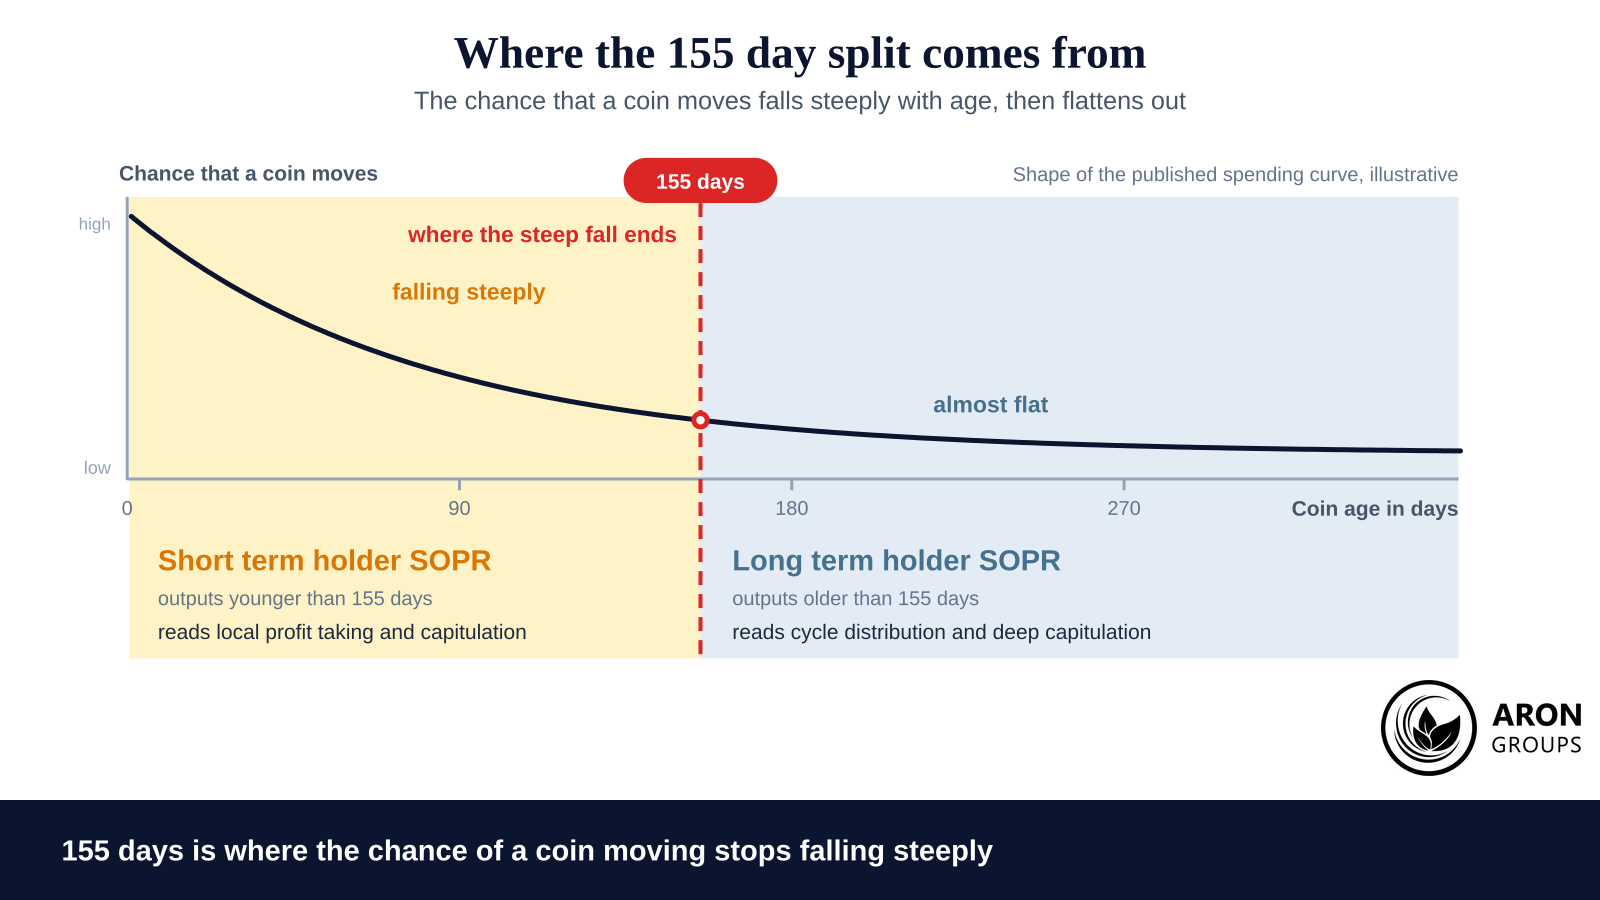
The split is drawn where the spending curve flattens, which is why the two cohorts are read as separate series.

The cohorts split the same calculation by coin age. Short term holder SOPR covers outputs younger than 155 days and is reactive, because that cohort holds the speculative supply. Long term holder SOPR covers everything older and is the macro lens, where capitulation and distribution by experienced holders show up.

Why the split sits at 155 days

The threshold comes from measured spending behaviour rather than from convention. Glassnode research published on 17 November 2020 examined how the probability that a coin is spent changes with its age. That probability falls steeply through the early months and then flattens out, and 155 days is where the steep decline ends. Coins older than that behave statistically like held supply, which is the whole reason the line is drawn there.

sms-star

Did You Know
Most age thresholds in market analysis are round numbers picked for convenience. The 155 day split is unusual because it was derived from the spending curve itself.
SOPR against MVRV

The two metrics are read together often enough that they get confused. MVRV compares market capitalisation with realised capitalisation, which is the aggregate cost basis of the entire supply, so it is a slow valuation gauge. SOPR looks only at the coins that actually moved in the period, so it is fast and behavioural.

MetricWhat it comparesPopulation coveredQuestion it answers
SOPRSpend price against creation priceOnly the coins moved in the periodAre sellers taking profit or loss now?
aSOPRThe same, minus outputs under one hourEconomically meaningful spendingThe same question, with less noise
MVRVMarket cap against realised capThe entire circulating supplyIs the asset dear or cheap against cost?

Different populations and different speeds, which is why the two often disagree.

The practical consequence is that they turn at different times. MVRV can sit at an extreme for months while SOPR oscillates around 1 from one day to the next. Reading the pair gives you a valuation backdrop and a behavioural foreground. A trading edge is built from several independent readings, not from one line crossing another.

A worked example with five spent outputs

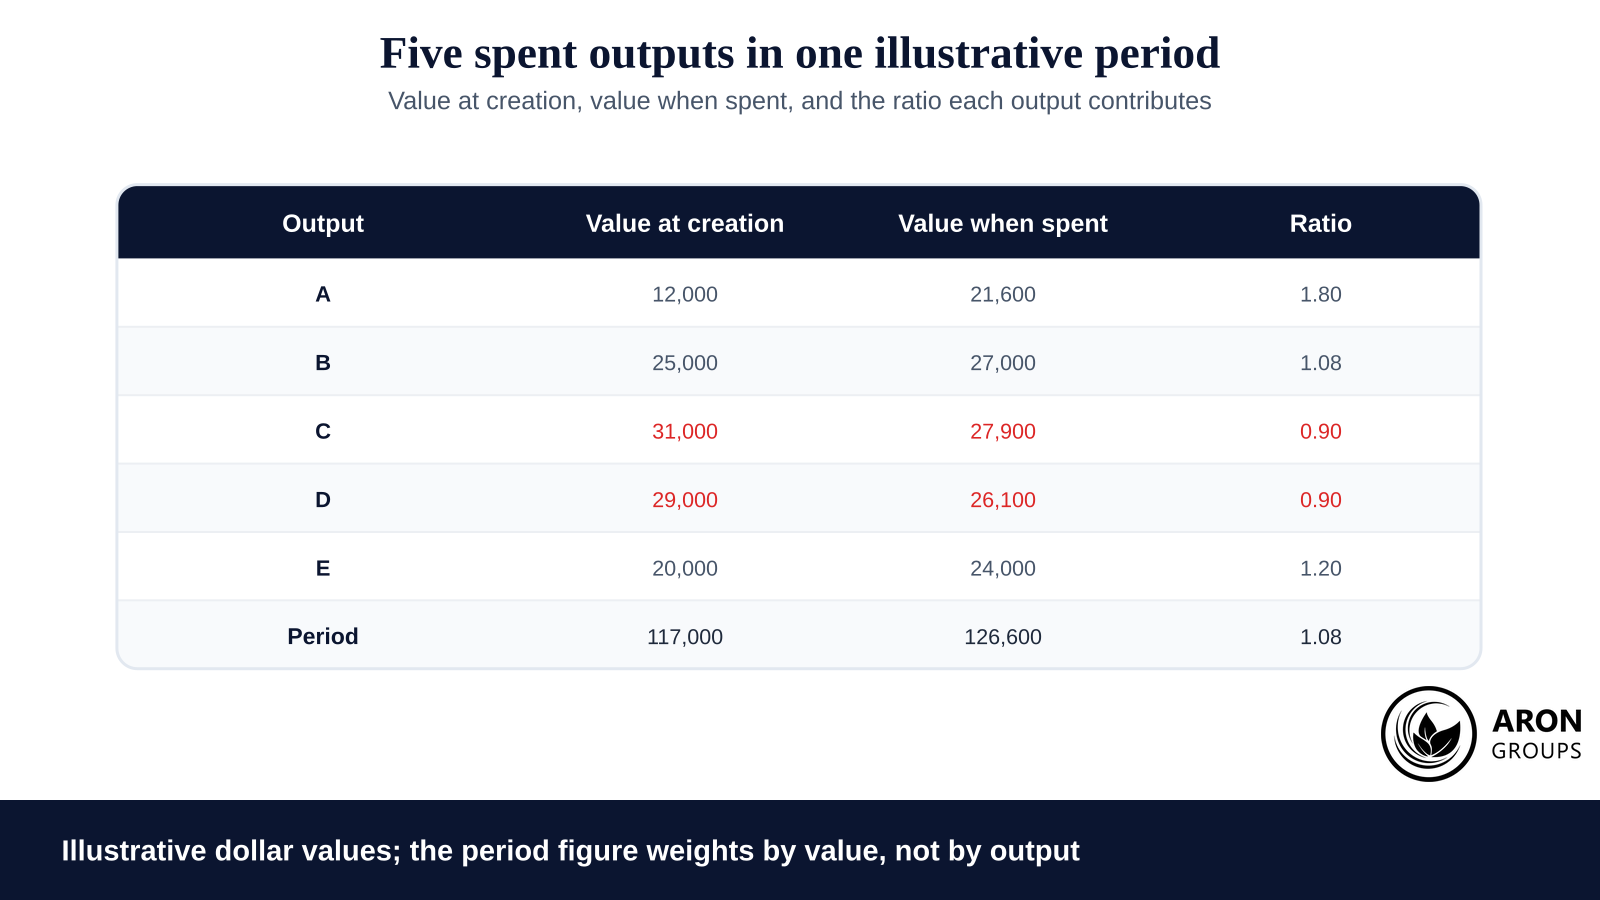
Numbers make the weighting obvious. The table below is illustrative and does not describe any real period on any chain. It shows five outputs spent in the same window. Each one carries the dollar value it held when it was created and the dollar value it held when it was spent.

Two of the five outputs were spent at a loss, and the aggregate still prints comfortably above 1.

Total value at creation is 117,000 dollars and total value at spending is 126,600 dollars, so SOPR for the period prints at 1.08. The simple average of the five individual ratios is 1.18, which answers a different question. SOPR weights by value, so the largest outputs dominate the number you see. Change the size of output A alone and the period print moves more than the small outputs ever could.

Mini Example: reading the print rather than the average

The aggregate says the market took profit that period. Two of the five outputs were sold at a loss, and one of those was the second largest. An analyst who reads only the headline figure never sees that split.

This is exactly why the cohort series exist. Splitting the same outputs by age separates the holder who bought last month from the one who bought three years ago. On this illustrative day the two groups were doing opposite things.

Q: Does a SOPR of 1.08 mean the average seller made eight per cent?
A: No. It means the coins that moved were spent for eight per cent more in aggregate than they cost. One large, very old output can carry the whole print while most sellers that day took a loss.

The honest limits of SOPR

SOPR describes what has already settled on chain. It is an accounting record of completed decisions, so it cannot forecast the next one. Any claim that the 1 line will hold rests on holders behaving as they did in earlier cycles. That is a viewpoint, not an established mechanism.

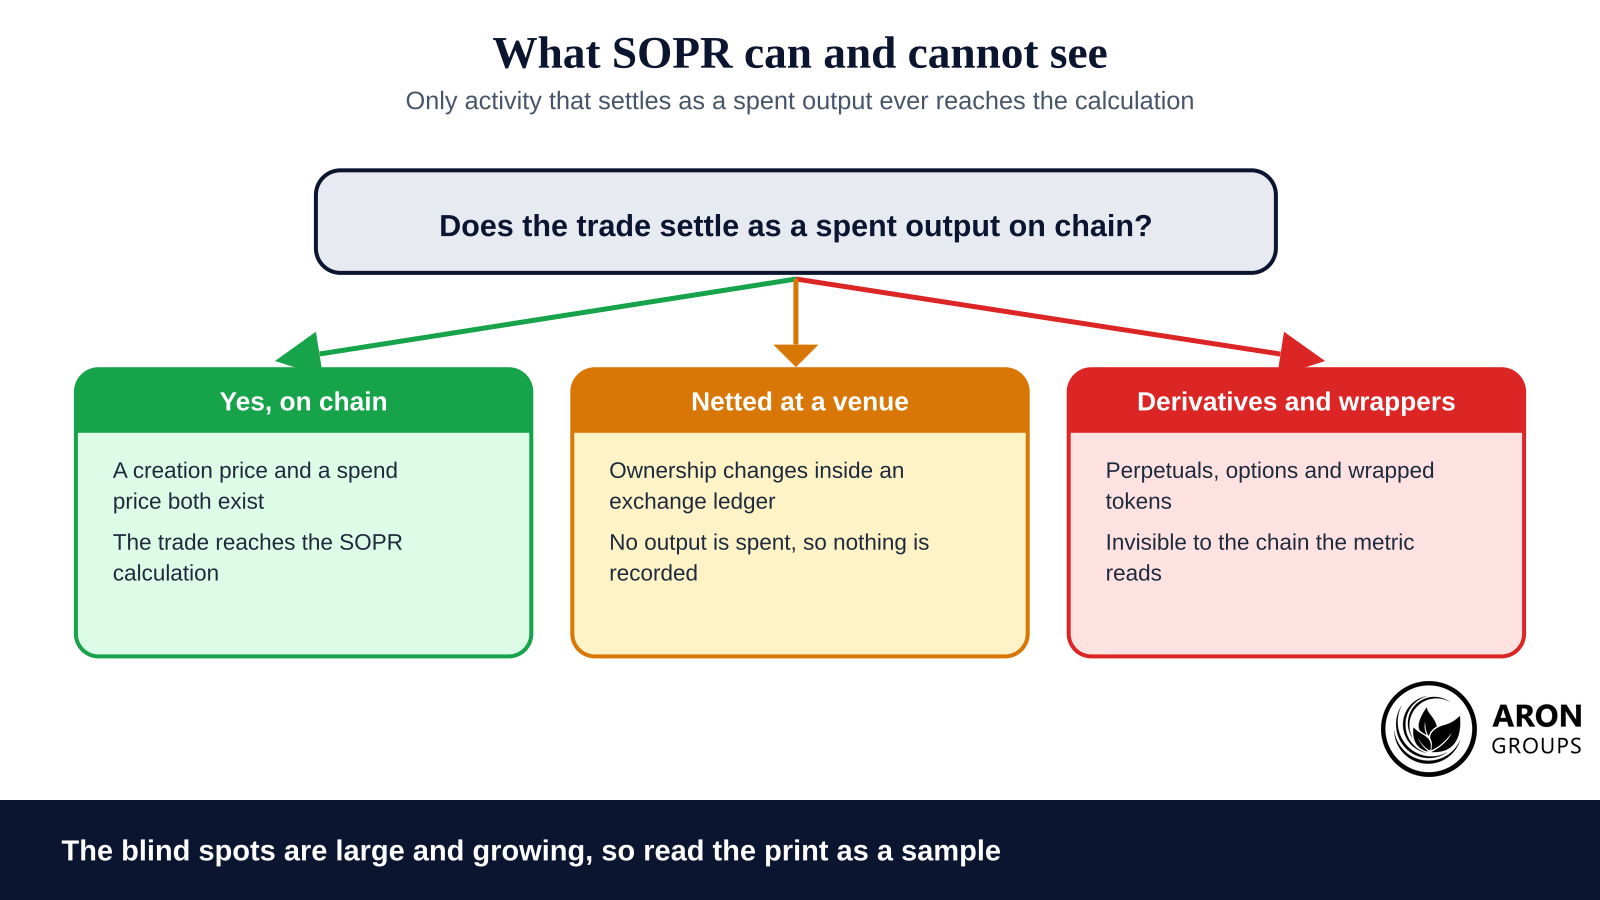
A growing share of trading never touches the ledger, so the metric reads a shrinking sample of the market it is used to describe.

The coverage problem is the larger one. SOPR needs a transparent ledger of discrete outputs, which in practice means Bitcoin. Account based chains do not record a per unit cost basis in the same way, so the metric does not transfer cleanly to them. It says nothing at all about activity that never settles on a chain.

Inside that boundary, several large flows stay invisible. Coins that change owner inside an exchange produce no spent output at all. The same is true of custodial movement, of balances parked in a stablecoin, of wrapped assets and of every derivatives position. Those venues carry a growing share of all trading.

Providers also compute the metric differently. Filters on dust, on exchange clusters and on minimum lifespan vary from one dataset to the next. Two charts both labelled SOPR can therefore disagree about the same day. Four questions are worth asking before you trust any of them.

· Which provider computed the series, and what does the filter exclude?

· Is this raw SOPR, aSOPR, or one of the two holder cohorts?

· Which asset and which period does the series actually cover?

· Would the same conclusion survive if the 1 line were ignored entirely?

sms-star

Practical filter
If a claim about SOPR changes when you switch data provider, it was never a claim about the market in the first place.


None of this makes the metric useless, but it does fix its job. A description of settled behaviour is valuable precisely because it is not a prediction. Any rule built on it should be stress tested before it carries size, and the position size should assume the read will sometimes be wrong. Treat it as one input among several rather than the input that decides.

Where Aron Groups fits

Aron Groups offers spot and CFD instruments, not on-chain products, wallets or coin custody. That distinction matters here. SOPR is context about holder behaviour, and any position taken on the back of it is a crypto CFD trade on MetaTrader 5. Execution on ECN accounts is market execution with no requotes and floating spreads, so the fill reflects available liquidity rather than a fixed quote.

If you want to test a rule built around aSOPR or a cohort series, keep the size small while the evidence is thin. The Nano account is commission free, carries its cost in the spread, and supports micro volumes from 0.0001 lots. CFDs are leveraged products, and the risks of off exchange leveraged trading are set out plainly by regulators.

Conclusion

SOPR converts a question about sentiment into a division. For every coin that moved, the chain supplies the price paid and the price received. The aggregate of those ratios says whether the market sold into profit or into loss, and no price chart contains that. It is still a record of the past, and a wrong reading leaves you exposed to the drawdown that follows.

Use it the way experienced analysts do: as context that sits behind a decision rather than a trigger that makes one. Size positions so that a failed sentiment read costs little, and protect the downside first. Regulators have recorded the rate at which retail accounts lose money on leveraged products.

Frequently asked questions

Four questions come up repeatedly once traders start reading on-chain profit metrics.

Is SOPR only useful for Bitcoin?

Largely, yes. It needs a ledger that records discrete outputs with a price attached to each one. Account based chains publish balances rather than parcels, so rough equivalents exist but they are built differently and are not directly comparable.

What is the difference between SOPR and aSOPR?

aSOPR applies one filter: it discards outputs that lived for less than an hour. Those movements are usually internal transfers rather than decisions, so removing them makes the line quieter without changing the quantity being measured.

Does SOPR predict tops and bottoms?

No. It records what sellers have already done. The patterns traders associate with the 1 line are tendencies observed across past cycles, and a tendency can stop working without any warning at all. The honest framing is that it describes crowd behaviour, and crowds are not obliged to repeat themselves.

How should a CFD trader use it?

As background, in the same way positioning data is used on any other market. It can tell you whether recent sellers were in profit, and it cannot tell you where price goes next. Position sizing and trading discipline still do most of the work.

Continue Reading
not-found
calendar 4 October 2026
Rate this article

Leave a Reply

Your email address will not be published. Required fields are marked *

No thanks