Forex markets move on two forces at once: the patterns visible on a chart and the economic data flowing from central banks, statistics offices, and government agencies across different economies. Traders who learn to stack signals from both sides gain a measurable edge. This guide breaks down exactly how to build and apply confluences in forex trading, from technical analysis tools to macro indicators important for every currency pair.

- Confluences forex means stacking multiple, independent reasons - technical and macroeconomic - to take a single trade. Confluence trading combines multiple indicators for better efficiency, filtering weak setups before you risk capital.
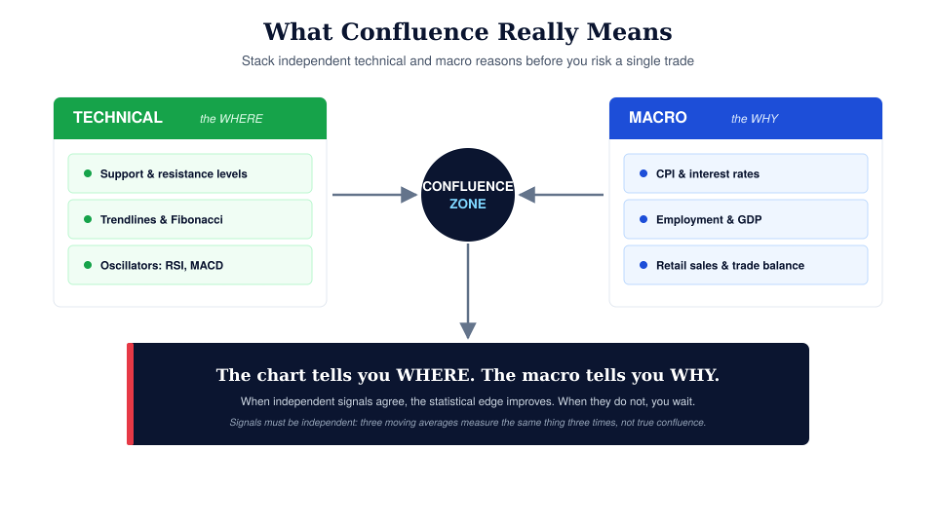
- The strongest confluences usually mix price action (support and resistance levels, trend line structures, fibonacci retracements) with key economic indicators like the consumer price index, interest rates, and employment figures.
- Aron Groups Broker clients can apply these confluences on MT5 across Forex, commodities, indices, and crypto CFDs, using built-in economic calendars, custom technical indicators, and multi-timeframe charts.
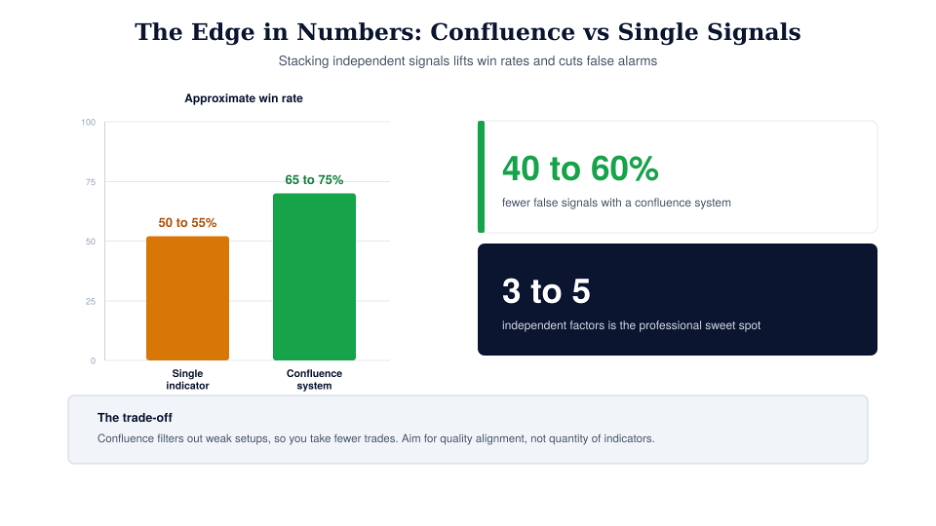
- Confluence trading helps filter out false signals in forex, but it also reduces the total number of trades you take. Risk management, position sizing, and patience are non-negotiable.
- Research suggests confluence-based systems can achieve win rates of 65–75%, compared to roughly 50–55% for single-indicator approaches, with false signal rates dropping by 40–60%.
What Is Confluence In Forex Trading?
Confluence occurs when several trading signals coincide simultaneously around the same price area or time window. Instead of relying on a single crossover or one oscillator reading, you wait for a resistance level to align with a bearish candlestick pattern and a macro data release – all pointing in the same direction.
A single signal gives you partial information. A moving average cross tells you something about trend direction, but nothing about structure. An RSI reading tells you about momentum, but not whether price is sitting on a meaningful level. When multiple tools agree, the statistical edge improves. A high-probability trading approach uses several analytical methods to align at a price area, which is the foundation of confluence trading in forex.
In the foreign exchange market, confluence can come from three broad categories:
- Chart structures: horizontal levels, patterns, session highs and lows
- Technical indicators: RSI, MACD, moving averages, stochastic
- Macro indicators: consumer price index, interest rates, trade balance, retail sales, housing market data
Using independent tools improves the robustness of the trading strategy. The key word is “independent” – signals must measure different aspects of price behavior. Stacking three moving averages of different lengths does not create genuine confluence; it just measures the same thing three times.
Confluence does not guarantee a winning trade. Markets can gap through levels, macro surprises can overwhelm any chart pattern, and liquidity can vanish around major announcements. But it seeks higher-probability entries compared to relying on just one lagging indicator or oscillator.
This approach fits naturally with Aron Groups Broker’s offering. The MT5 platform supports multi-timeframe charts, custom indicators, templates, and integrated economic news feeds – everything a trader needs to combine chart analysis with macro context in a single workspace.
Why Confluences Matter In Forex (And Why Single Signals Fail)
Forex is heavily driven by both technical levels and key us economic indicators, so informed decisions based on one tool alone are often weak. Market participants react to interest rates, inflation, employment figures, and gdp growth simultaneously – not one at a time.
Here are the typical single-signal mistakes forex traders make:
- Trading only a moving average crossover without checking whether price is near meaningful support and resistance levels.
- Selling purely because RSI shows “overbought” in a strong uptrend, where the oscillator can stay elevated for weeks.
- Entering on a candlestick pattern at a random price level with no structural context.
Many technical analysis tools are lagging by design because they calculate values from historical prices. An economy’s historical performance is baked into the indicator’s output, making it reactive rather than predictive. Combining these with leading indicators – such as expectations around the consumer price index or upcoming interest rates decisions – adds forward-looking context that pure chart analysis cannot provide.
Multiple indicators can enhance trade decision-making and confidence. Combining technical and fundamental analysis enhances confluence trading by giving you both structure (where to trade) and narrative (why the market might move).
The psychological benefit is equally important: confluence forces you to wait for alignment, which reduces impulsive trades and overtrading. Traders who track confluences report more consistent equity curves and less emotional decision-making.
Using indicators on different timeframes can confirm trends, adding another dimension. A daily trend supported by H4 structure and H1 entry timing is far stronger than any single-timeframe signal.
Good practice at Aron Groups Broker: clients can backtest confluence rules on a demo account or during prop trading evaluations before risking live capital. This lets you verify which combinations work before committing real money.
Core Technical Confluence Tools In Forex
This section covers chart-based confluences only. Macro confluences come next.
Support, Resistance, and Horizontal Levels
Support and resistance can serve as key analysis tools in identifying trade opportunities. These horizontal levels – formed by previous swing highs, swing lows, session boundaries, and weekly or monthly pivot levels – are the backbone of most confluence setups.
- Support levels are where prices tend to bounce back up due to concentrated buying interest.
- Resistance levels are where prices tend to reverse downwards as sellers step in.
- Support and resistance levels indicate potential price reversal zones, especially when tested multiple times.
Support and resistance help filter out false trading signals. A candlestick pattern at a tested support zone carries far more weight than the same pattern at a random price level. Round psychological numbers (e.g., EUR/USD at 1.0500 or GBP/USD at 1.2000) add another layer because many market participants cluster orders around them.
Trendlines and Channels
A trend line connecting higher lows (uptrend) or lower highs (downtrend) defines the market’s directional bias. When a trendline intersects a horizontal support or resistance level, the overlap often marks a strong confluence zone. These intersections create “zones” rather than single-pip price levels, which is more realistic for trade planning.
Fibonacci Retracements
Fibonacci retracements at the 38.2%, 50.0%, and 61.8% levels are a classic confluence tool. They work best when they refine existing levels rather than draw levels from scratch. Fibonacci levels combined with horizontal levels increase signal accuracy because you are confirming a structural zone with a mathematical ratio, not relying on Fibonacci alone. Additionally, fibonacci levels can align with moving averages to indicate trade opportunities – for example, when a 200-period moving average sits near a 61.8% retracement on the daily chart.
Oscillators as Confirmation
Price action includes specific candlestick patterns as indicators for trade execution, but oscillators (RSI, MACD, stochastic) serve as confirmation tools. When RSI divergence appears at a tested support level with a fibonacci level nearby, the confluence is far stronger than any one signal in isolation. Popular indicators like MACD histogram divergence or stochastic crossovers add value only when layered onto level-based analysis.
Macro Confluences: Combining Technical Levels With Key Economic Indicators
Forex is uniquely sensitive to macroeconomic releases. Unlike equities, where earnings drive individual stock prices, currencies reflect the entire economic health of a nation. Fundamental analysis of macro data is not optional – it is the other half of the confluence equation for forex traders.
Key Macro Indicators for Forex
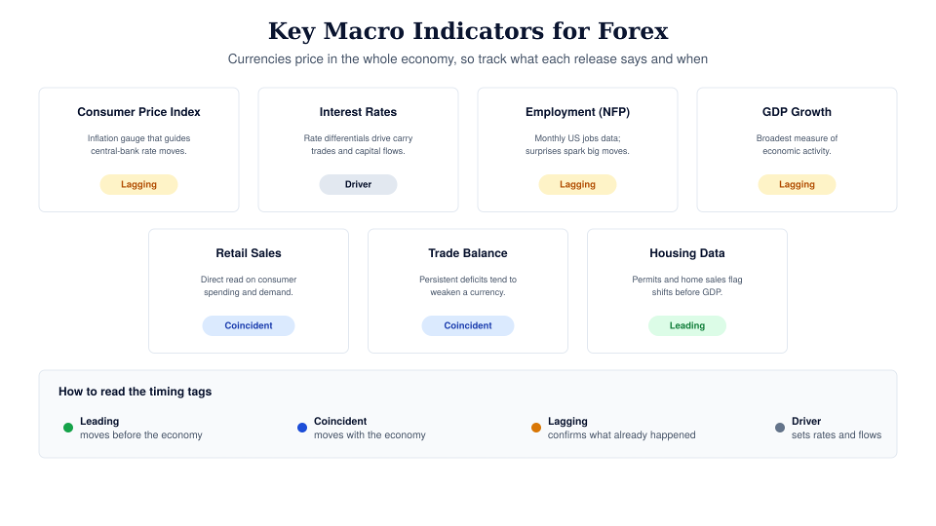
Macroeconomic indicators influence market trends and asset prices across every currency pair. Here are the important indicators to track:
- Consumer price index (CPI): The Consumer Price Index indicates inflation levels. Central banks like the federal reserve, ECB, and Bank of England use core CPI (or core PCE in the US) to guide monetary policy. Rising inflation often leads to rate hikes, strengthening a country’s currency.
- Gross domestic product (GDP): GDP measures total goods and services produced in a country. It captures economic growth and is the broadest measure of economic activity, though it is a lagging indicator. Gross domestic product gdp data shapes long-term economic outlook for a currency.
- Employment figures: Non-farm payrolls data is released monthly in the US and routinely generates large moves in forex pairs. The unemployment rate is a lagging indicator of economic health, but surprise deviations from consensus create immediate market volatility.
- Retail sales: A direct measure of consumer spending and purchasing power. Weaker-than-expected retail sales often signal slowing economic activity.
- Trade balance: A persistent deficit tends to weaken a currency over time because it reflects more of a country’s exports being outpaced by imports. The trade balance feeds into current account data, which drives medium-term flows.
- Housing market data: Leading indicators like building permits and home sales reflect confidence and credit conditions. A weakening housing market can anticipate shifts in economic growth before GDP confirms it.
- Interest rates: Absolute rates matter, but interest rate differentials between different economies drive carry trade flows and capital allocation. When one central bank hikes while another holds, the monetary value of the higher-yielding currency typically rises.
Leading vs. Lagging: Why Timing Matters
Leading indicators (housing market activity, business surveys, stock prices in major economies, the yield curve on long term bonds) tend to move before the broader economy shifts. Coincident indicators (industrial production, personal income) move with the economy. Lagging indicators (CPI, unemployment rate) confirm what has already happened.
For trade timing, focusing on leading indicators helps you anticipate shifts in trend direction before data releases confirm them. Key macroeconomic indicators like PMIs and business surveys give monthly reads that shape investor sentiment weeks before quarterly GDP prints.
A Concrete Example
Consider a technical short setup near a resistance level on GBP/USD in 2025. Price stalls at a previous swing high from March 2024 that coincides with a descending trend line. At the same time, UK retail sales come in weaker than expected and the trade balance shows a widening deficit – an economic event that reinforces the bearish technical picture. National statistics confirming softer consumer spending and slowing economic activity give macro weight to the chart-based trade idea.
This is the core of confluence trading: the chart tells you where, and the macro tells you why.
Macro indicators not only move spot forex but also CFDs on indices, bonds, and commodities. A hot US CPI print affects USD pairs, US stock indices, gold, and Treasury yields simultaneously – reinforcing cross-market confluence opportunities for traders at Aron Groups Broker.
Forex traders should watch upcoming announcements via an economic calendar, mark technical zones in advance, and then wait for price to react at those zones around data releases. When the actual figure deviates significantly from consensus, the resulting move at a pre-identified technical level often provides the highest-conviction entries.
Building A Practical Forex Confluence Checklist
This section is a step-by-step framework you can turn into a written trading plan.
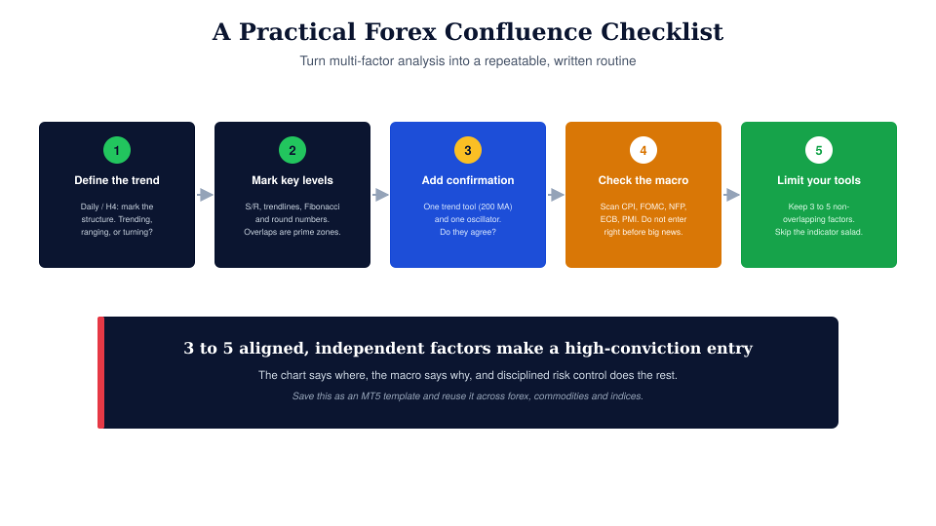
Step 1: Define trend direction on higher timeframes
- Start on the daily or H4 chart to identify the dominant trend. Higher timeframe analysis reveals significant levels that show strong historical reaction.
- Mark the current market structure: higher highs and higher lows (bullish), or lower highs and lower lows (bearish).
- Determine whether the market is trending, ranging, or at an inflection point.
Step 2: Mark key price levels
- Identify strong support and resistance zones from the daily and weekly charts.
- Add any relevant trend line structures (ascending, descending, channel boundaries).
- Draw fibonacci retracements on the dominant swing. Note where fibonacci levels overlap with horizontal levels – these are your primary confluence zones.
- Flag nearby psychological round numbers and previous session highs/lows.
Step 3: Add indicator confirmation
- Choose one trend indicator (e.g., 200 MA) and one oscillator (e.g., RSI or MACD).
- Look for alignment: is the oscillator confirming the level-based setup?
- Confluence zones combine support, resistance, and other indicators into a single area of interest.
Step 4: Check the macro calendar
- Identify upcoming macro indicators important for the pair. For USD pairs, check US CPI, FOMC rate decisions, NFP. For EUR pairs, check ECB decisions, Eurozone trade balance, German PMI. For GBP, check UK labour data and retail sales.
- Avoid entering right before high-impact news unless your plan specifically accounts for it.
- Note whether recent data releases have shifted the economic outlook for either currency.
Step 5: Limit your tools
- Stick to 3–5 non-overlapping factors: one trend tool, one oscillator, levels, and macro context. This avoids the “indicator salad” problem where too many redundant signals create false confidence.
- Aron Groups Broker traders can save chart templates on MT5 with their chosen confluence tools and reuse them across forex, commodities, and indices.
Classic Forex Confluence Setups (With Concrete Examples)
Below are several repeatable confluence patterns. The confluence zone averages 5-15 candles for M5-M30 timeframes, but on daily or H4 charts the zone can persist for several sessions.
Support Level Confluence
A daily support zone on AUD/USD tested multiple times since late 2023 aligns with the 61.8% fibonacci retracement of the 2022–2024 swing. A bullish reversal candlestick pattern can appear at a support level with additional indicators confirming momentum – in this case, RSI dipping below 30 and then curling upward. The macro backdrop shows steady Australian employment and no imminent RBA rate cut. Entry is taken on the H4 bullish engulfing candle; stop loss sits a few pips below the fibonacci level.
Resistance Level Confluence
EUR/USD stalls near a March 2024 high that coincides with a 50% fibonacci retracement from a longer-term swing and a downward trend line from 2021. RSI divergence appears on the H4 chart – price makes a higher high while RSI makes a lower high. At the same time, US core CPI prints hotter than expected, widening the inflation differential and reinforcing USD strength. Market sentiment shifts bearish on the euro. This confluence of technical resistance, oscillator divergence, and macro data creates a high-conviction short.
Trendline + Moving Average Confluence
USD/JPY uptrend through 2024 where pullbacks consistently respect a rising trend line and the 200-period moving average on the H4 chart. Entries are only taken when price bounces from the confluence of both. The macro driver: the Bank of Japan holds rates while the federal reserve signals further tightening, widening the yield differential. Market trends favor USD strength in this environment.
Fibonacci + Macro Data Confluence
AUD/USD respects the 38.2% fibonacci retracement on the daily chart just as weaker Australian retail sales and softer housing market data are released. The data releases confirm slowing consumer spending and reduced purchasing power. This gives confluence for a bearish continuation, with the target set at the next fibonacci level (61.8%). Inventory levels in key commodity exports also soften, adding to the bearish fundamental case.
Risk Management & Trade Management In Confluence Trading
Higher probability from confluence does not replace disciplined risk control. Even a setup with four or five aligned factors can fail when a central bank surprises or liquidity dries up.
Stop loss placement: Place stop losses just beyond the confluence zone – a few pips beyond the support or resistance level, or beyond the fibonacci level that defines your setup. Avoid arbitrary pip distances. The zone itself should dictate where your trade idea is invalidated.
Partial profit-taking:
- First target at the next obvious price level (e.g., previous swing or horizontal level).
- Second target at a larger swing point, allowing the remaining position to capture a bigger move.
- This approach balances reward and win rate.
Position sizing: Use a fixed percentage risk per trade – 0.5% to 2% of account equity – even when a setup has many confluence factors. Do not “double size” on strong confluences. The edge is statistical, not certain on any single trade.
Prop trading and account rules: Aron Groups Broker prop trading programs may impose specific risk limits and drawdown thresholds. Structured confluence trading – with clear stops and targets – is particularly suitable for meeting evaluation rules because it avoids random, oversized bets.
Tracking results: Keep a trade log that notes which confluence elements were present in each trade. Over time, you will see which combinations consistently produce the best results for specific pairs and conditions. This is how you refine your business strategy for trading into a repeatable edge.
Integrating Confluence Trading With Aron Groups Broker Tools
Aron Groups Broker provides the infrastructure to apply confluence trading efficiently across multiple asset classes.
- MT5 platform features: Multi-timeframe charts allow you to analyze daily structure and then execute on H1 or M15. Custom technical indicators and saved templates let you apply your confluence checklist with one click. One-click trading enables fast execution around economic event windows.
- Economic calendars and news feeds: Track macro indicators like CPI, GDP, central bank decisions, and retail sales data for major economies (US, EU, UK, Australia, Asia). You can filter by impact level and currency, so you know exactly when key data releases are scheduled.
- Copy trading: Follow experienced traders who apply confluence strategies while you build your own checklist. Look for signal providers who describe multi-factor setups in their trade descriptions.
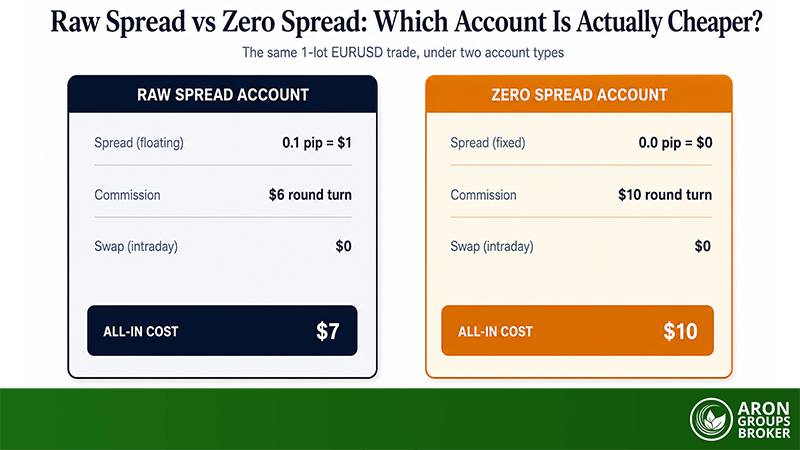
- Spreads and execution: Tight spreads and fast execution on major forex pairs and CFDs reduce the friction of entering and exiting at confluence zones, where precision matters.
Start by testing your confluence ideas on a demo account at Aron Groups Broker before scaling up to a larger live or prop trading account. You can trade forex on the same platform you will eventually use live.
Common Mistakes When Using Confluences In Forex
Misuse of confluence is common, especially among newer traders looking for a “Holy Grail” strategy.
- Over-confluence and redundancy: Over-confluence can complicate charts with redundant indicators that provide similar information. Stacking three momentum oscillators does not triple your edge – it just measures the same thing with minor variations. Stick to independent factors that each tell you something different about the market.
- Confirmation bias: After long chart-watching sessions, traders start “seeing” confluence everywhere because they want a trade. Keep analysis sessions short, rules objective, and criteria written down before you open the chart.
- Trading through high-volatility events: Even if technical confluence looks perfect, trading right through US CPI, NFP, or FOMC announcements without a clear pre-planned approach is dangerous. Market volatility around these events causes spreads to widen, slippage to increase, and price levels to fail. An economic shift caused by a surprise print can invalidate any technical setup.
- Ignoring higher-timeframe context: Focusing only on intraday noise while the monthly trend since 2020 points in the opposite direction often turns apparent confluences into low-probability counter-trend trades.
- Lack of journaling: Without structured journaling and periodic review, you cannot distinguish between confluence combinations that genuinely work and those that looked good in hindsight. Traders at Aron Groups Broker should review their trade logs at least monthly.
Conclusion: Confluence Trading Is About Probability, Not Perfection
In conclusion, confluence trading does not promise certainty. No combination of technical levels, fibonacci retracements, oscillators, and macro data can guarantee a winner. What it does is shift the odds – systematically and measurably – in your favor.
The process is straightforward: identify strong price levels on higher timeframes, confirm with independent technical indicators, layer in macro context from key economic indicators, and manage risk with discipline. Over time, your trade log will reveal which confluence combinations suit your pairs, timeframes, and personality.
Aron Groups Broker gives you the tools – MT5, economic calendars, copy trading, prop trading evaluations, and competitive spreads – to implement this approach from day one. Open a demo account, build your confluence checklist, and start testing. The edge is in the process, not in any single trade.
FAQ About Confluences In Forex Trading
How many confluence factors should I wait for before opening a Forex trade?
Most professional forex traders use 2 to 5 independent confluence factors – for example, a major support or resistance level, trend direction on a higher timeframe, a simple oscillator confirmation, and macro context. Requiring more than five factors often leads to analysis paralysis and very few trade opportunities. The goal is quality alignment, not quantity of indicators.
Can I build a confluence strategy using only macroeconomic indicators?
Trading purely on key macroeconomic indicators like the consumer price index, gross domestic product, and trade balance is possible, but it tends to be volatile and difficult to time precisely. Combining macro with technical price levels gives you better structure for entries, stops, and targets. Macro tells you the direction; the chart tells you the exact price levels to act on.
Are Fibonacci retracements necessary for confluence trading?
Fibonacci retracements are optional but remain among the most popular indicators for refining entry zones. They work best when fibonacci levels line up with existing support and resistance or trend line structures. Using them on a blank chart without any other structural context provides weak signals.
Which timeframes work best for Forex confluence strategies?
Many traders define major confluence zones on daily and H4 charts, then execute entries on H1 or M15. Very low timeframes like M1 are usually too noisy, especially around macro news releases. Using indicators on different timeframes can confirm trends – the higher frame sets the bias, and the lower frame provides the trigger.
Can I use confluence trading with copy trading or prop trading accounts at Aron Groups Broker?
Absolutely. Confluence rules work both when designing personal strategies for prop trading evaluations and when choosing which signal providers to follow via copy trading. Look for traders who clearly describe multi-factor setups and demonstrate consistent risk management. The discipline that confluence trading requires aligns well with the evaluation rules and drawdown limits that prop trading programs enforce.