
icon icon Home
icon icon Accounts
icon icon Quick start
icon icon Symbols

Liquidation Cascades: How a Chain of Forced Liquidations Crashes Leveraged Markets

Author
Abe Cofnas
Abe Cofnas
calendar Last update: 6 October 2026
watch Reading time: 9 min

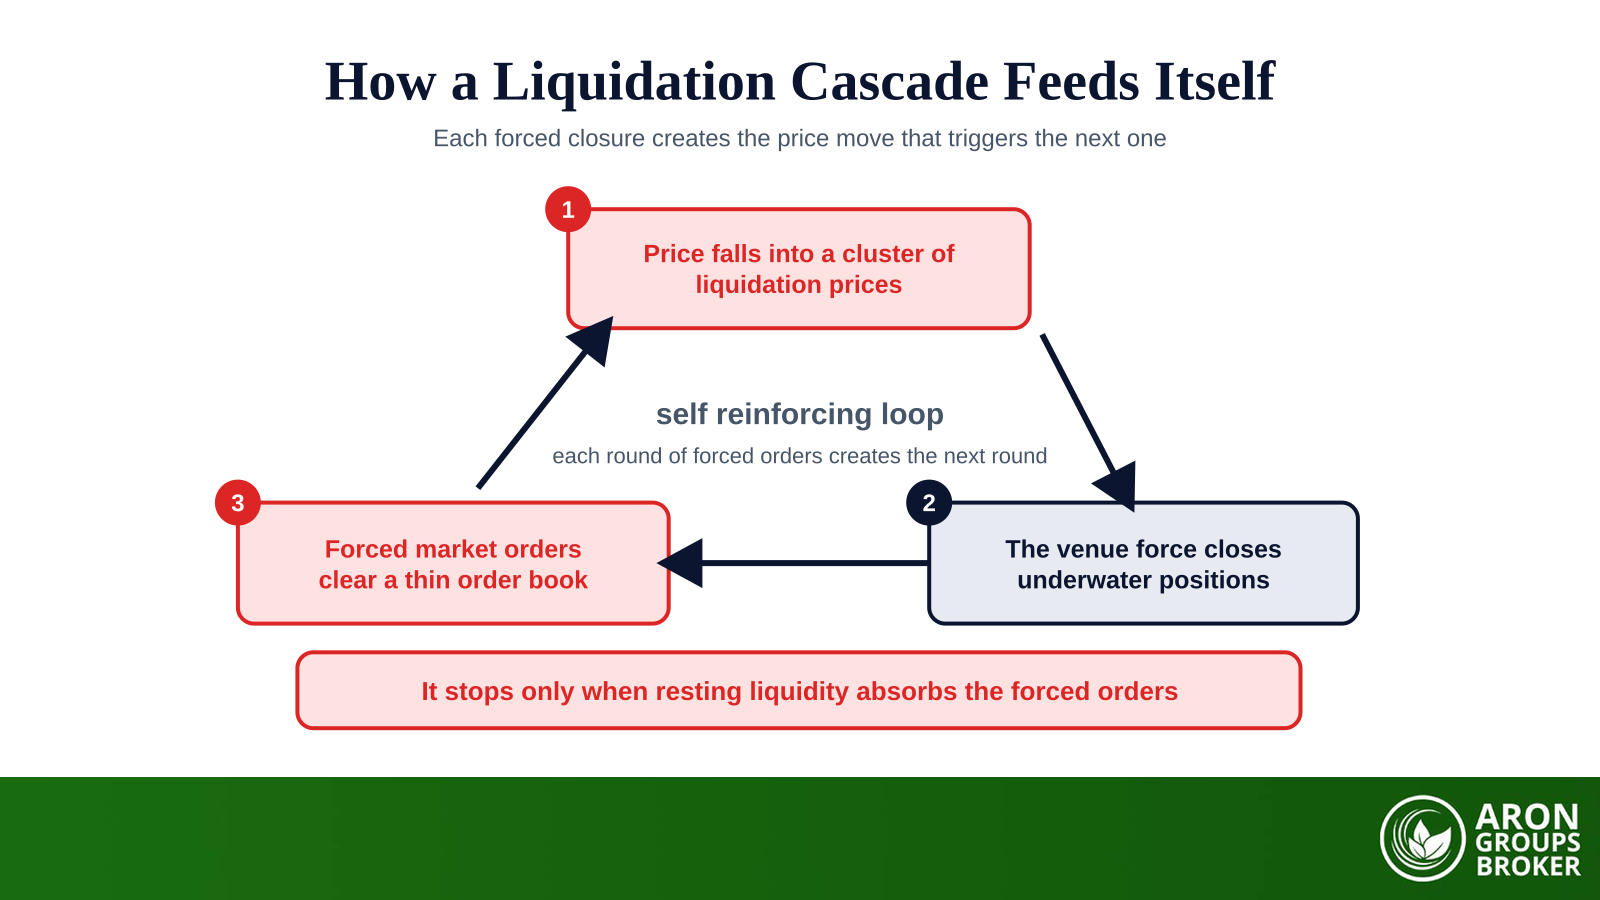
A liquidation cascade is a chain reaction of forced liquidations in which each closure triggers the next. Price falls into a cluster of liquidation prices, the venue force closes the underwater leveraged positions, and those forced sell orders push price lower still. The lower price reaches the next tier of liquidations, and the loop feeds itself until resting liquidity absorbs the flow.

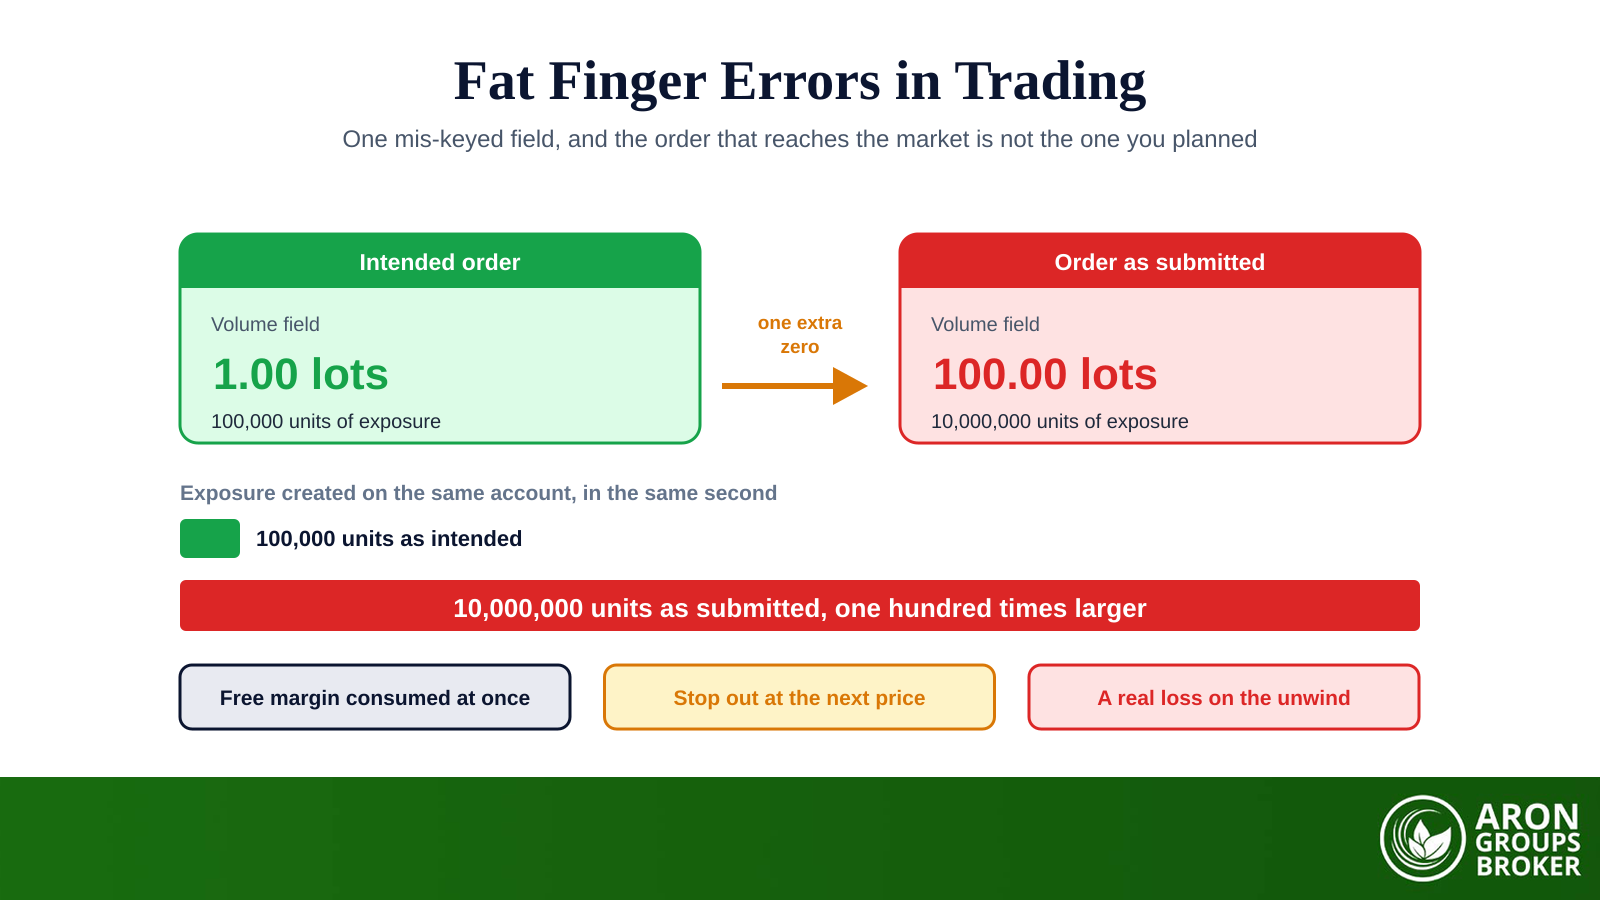
The mechanism is ordinary risk control running at scale. Every leveraged position carries a price at which the venue closes it to stop the loss growing. Taken one at a time that rule protects the venue. Taken together, when thousands of those prices sit within a few per cent of each other, the same rule turns a modest fall into a violent one.

This guide sets out the five step mechanic, the arithmetic that packs liquidation prices together, the mirror image short squeeze, and auto deleveraging. It then takes the largest cascade on record apart, because the headline figure everyone quotes is both an undercount and an overstatement.

bookmark
Key Takeaways
  • A liquidation cascade is a self reinforcing loop: forced closures move price, and the move forces more closures.
  • High leverage packs liquidation prices tightly together, and a thin order book lets each forced order travel further.
  • A short liquidation cascade is the same machine in reverse, with forced buying driving price up.
  • Auto deleveraging can close profitable traders on the winning side, ranked by profit and leverage together.
  • Headline liquidation totals are notional value, not capital lost, and exchange feeds undercount the events.

What a liquidation cascade actually is

A liquidation cascade is a sequence of forced position closures in which each closure creates the price move that triggers the next. It is not a separate market event with rules of its own. It is the ordinary liquidation process, running fast enough and densely enough that its output becomes its input. The term is applied most often to leveraged crypto futures, where the conditions that produce it are routine.

sms-star

Risk Disclosure
Trading forex and CFDs carries a high level of risk and can result in the loss of all your capital. This content is educational and is not investment advice. Never risk money you cannot afford to lose.
The three conditions a cascade needs

A cascade needs crowding, leverage and thin liquidity at the same time. Crowding means a large share of open positions sits on one side. Leverage means those positions liquidate after a small adverse move. Thin liquidity means the forced orders find few resting bids. Remove any one condition and the chain breaks after a step or two.

Why it concentrates in leveraged crypto futures

Perpetual futures on crypto venues combine all three conditions more reliably than other markets do. Leverage of ten to one hundred times is available to retail accounts, and trading runs continuously, weekends included. Most contracts are also quoted and margined in a stablecoin rather than a national currency. Spot holdings produce no forced closures at all, because nobody can close out an unleveraged owner.

How a cascade runs, step by step

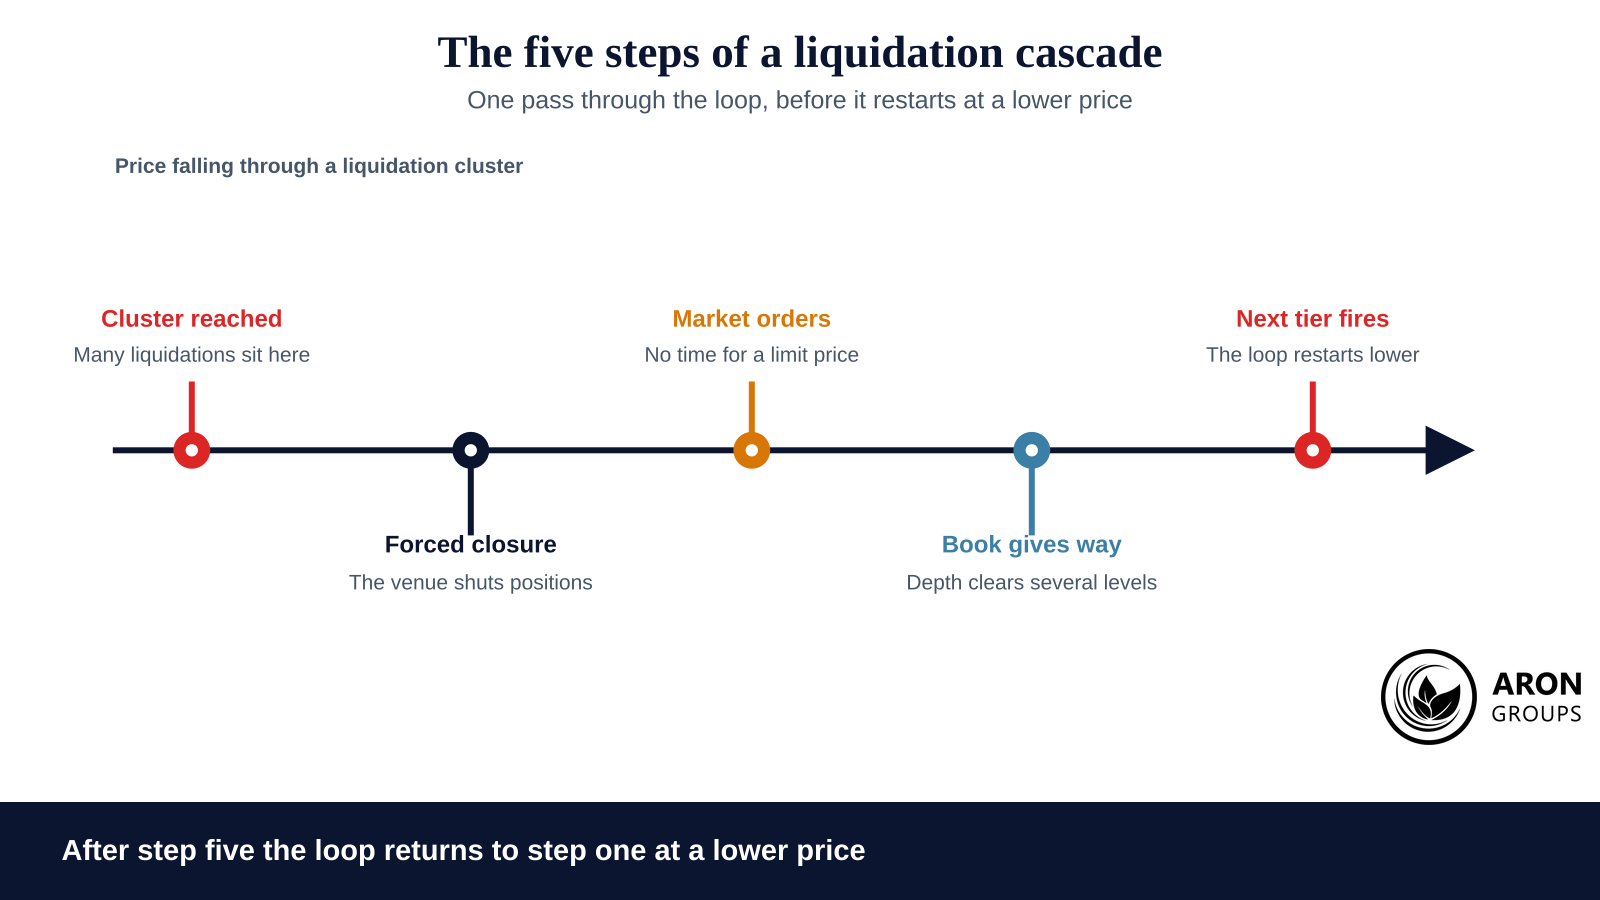
The sequence has five steps and repeats until the selling exhausts itself. Price reaches a level where many liquidation prices sit. The venue force closes the underwater positions. Those closures arrive at the order book as market orders rather than limit orders. Thin depth means they clear several price levels, and the new low reaches the next tier of liquidation prices.

Forced closures enter as market orders, so every round of liquidations pays for the price move that triggers the round after it.

Step three is the one that matters. A stop loss is the trader’s own instruction and can rest as a limit order. A liquidation is the venue protecting itself, executed with urgency rather than patience. Urgency is expensive in a thin book, so price impact per dollar rises exactly when the market can least afford it.

sms-star

Key Point
A cascade is not driven by selling pressure arriving from outside the market. It is driven by the market's own risk controls converting one price move into more of the same move.
Why liquidation prices sit so close together

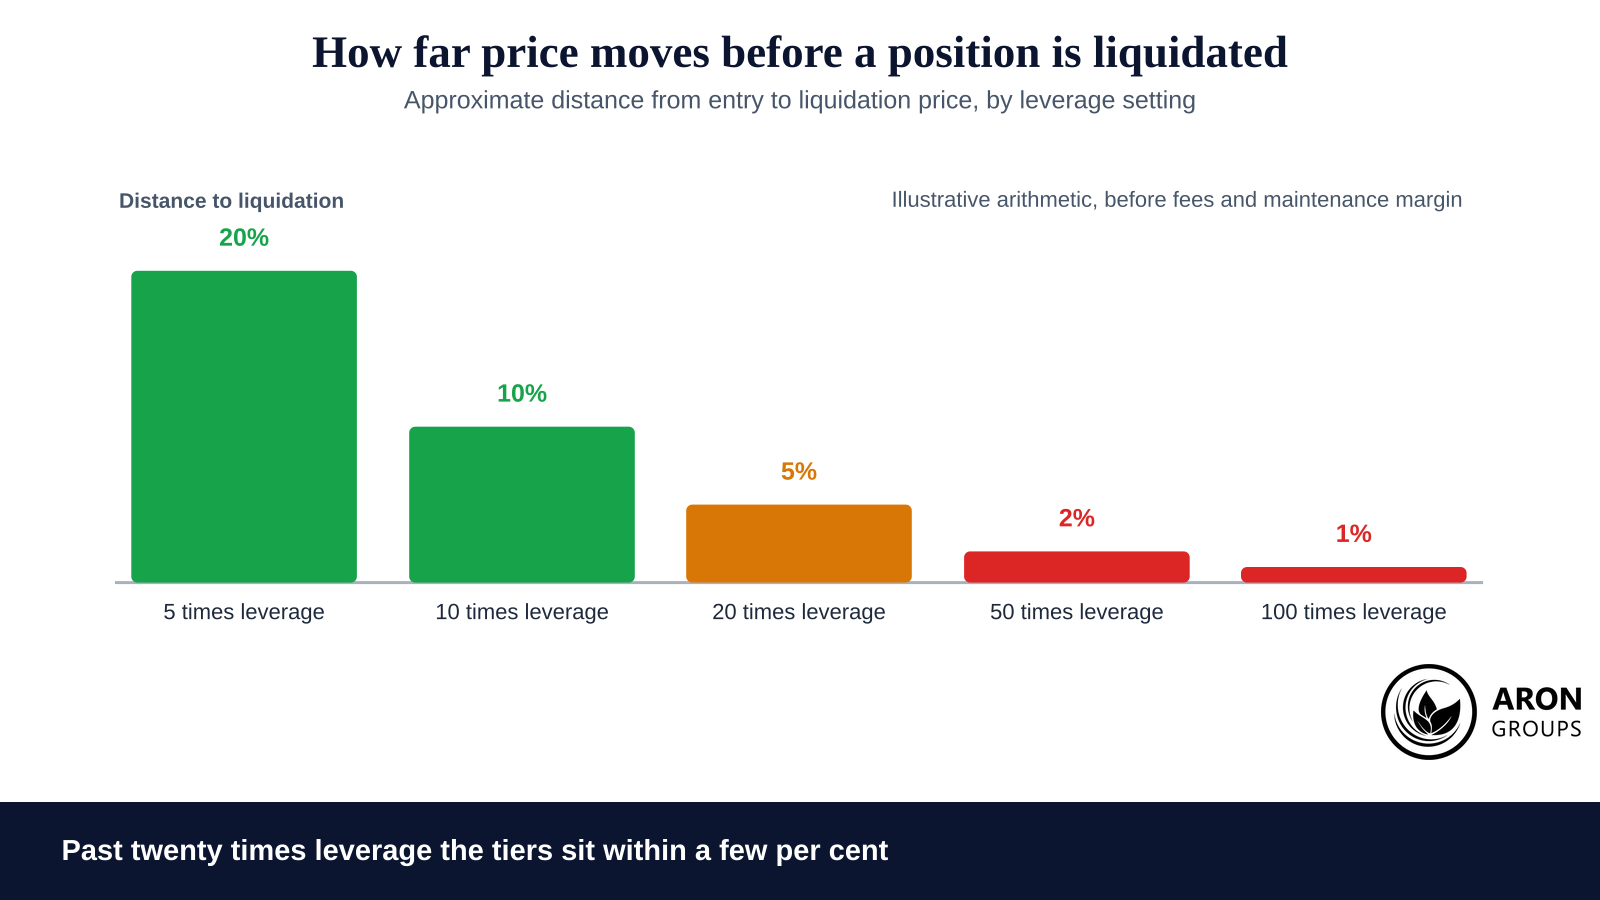
Leverage alone decides how far price must travel before a position is liquidated, and high leverage makes that distance very small. The arithmetic here is illustrative, before fees and maintenance margin. Twenty times leverage puts liquidation roughly five per cent away, and fifty times puts it roughly two per cent away. Stack accounts at similar settings and their liquidation prices land almost on top of each other.

Illustrative distances only: as leverage rises the room to liquidation collapses, so one move can clear several tiers at once.

That is why a cascade looks discontinuous on a chart. Price does not glide through the cluster, it jumps. Each tier delivers a block of forced orders into a book the previous tier has already thinned. European regulators addressed the retail version of this problem directly. They capped leverage on contracts for difference, imposed a margin close out rule and required negative balance protection.

Long cascade and short squeeze: one engine, two directions

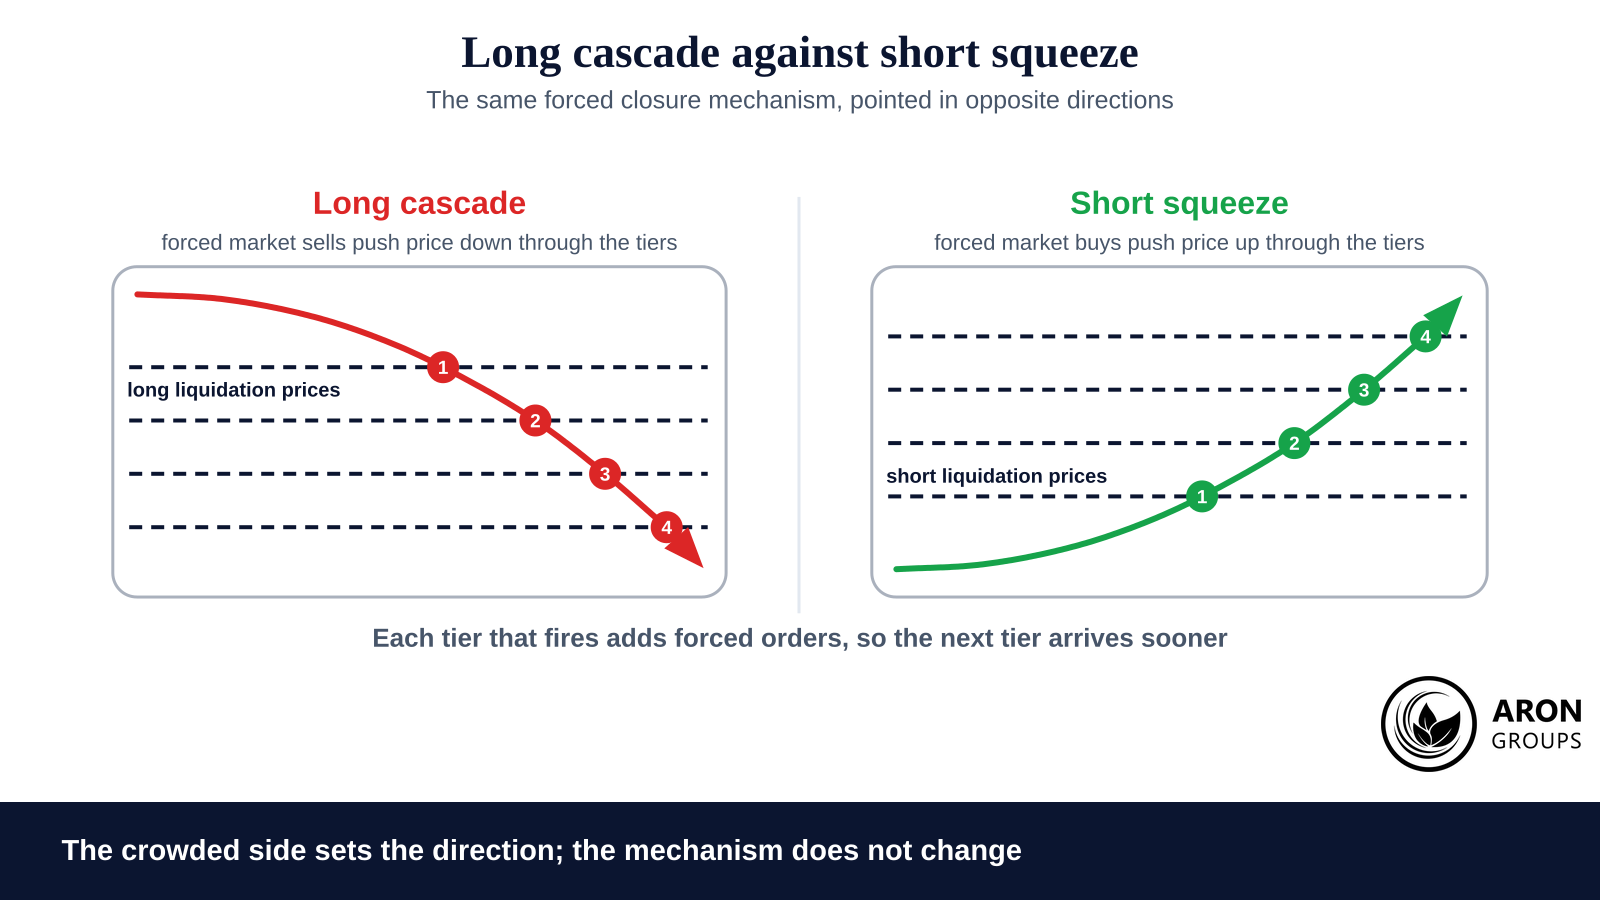
A short liquidation cascade is the same mechanism with the signs reversed. Force closed shorts have to buy back, so the forced orders are purchases and they drive price up. Traders usually call the result a short squeeze. The engine is identical: crowded positioning, tightly packed liquidation prices, and a book too thin to absorb the flow.

The direction of the forced order, not the direction of the news, decides whether a cascade crashes the price or lifts it.
FeatureLong liquidation cascadeShort liquidation cascade
Crowded sideLeveraged longsLeveraged shorts
Forced order typeMarket sellMarket buy
Price directionDown, often sharplyUp, often sharply
Common nameFlash crash, long squeezeShort squeeze
Funding rate before itPositive, longs paying shortsNegative, shorts paying longs

One mechanism and two labels; the crowded side decides which way the forced orders point.

The naming confuses people because a squeeze is described from the victim’s point of view. A short squeeze hurts shorts and price rises. A long squeeze hurts longs and price falls, which a chart reader simply calls a flash crash.

Auto deleveraging, the step after the insurance fund

Auto deleveraging is the final step in the liquidation process, and it runs only when the insurance fund cannot absorb a bankrupt position. When a position is closed beyond its bankruptcy price, somebody has to carry the shortfall. The insurance fund covers it first, and if it cannot, the venue closes positions on the winning side instead.

The selection is not random, and it is not simply the most profitable trader. Binance ranks candidates on profit and leverage together. Where a position’s profit percentage is at or above zero, the ranking is that percentage multiplied by effective leverage. Where it is below zero, the percentage is divided by effective leverage instead, and the highest ranked position is deleveraged first. Bybit uses the same shape and shows traders an auto deleveraging priority indicator on the position itself.

The trigger is not always literal exhaustion of the fund. On some venues auto deleveraging fires when an eight hour drawdown reaches a trigger line measured against the insurance fund’s highest balance in that window. On others it fires when the combined pool balance falls to zero or below. Being right about direction does not guarantee you keep the position.

Q: Can auto deleveraging close a position that is in profit?
A: Yes, and that is precisely its purpose. The queue is built from the winning side of the contract, because those traders are the counterparties to the bankrupt losers. A heavily leveraged and heavily profitable position therefore sits near the front of the queue, so the traders the cascade rewarded most are the first to be closed out of it.

What the October 2025 cascade actually showed

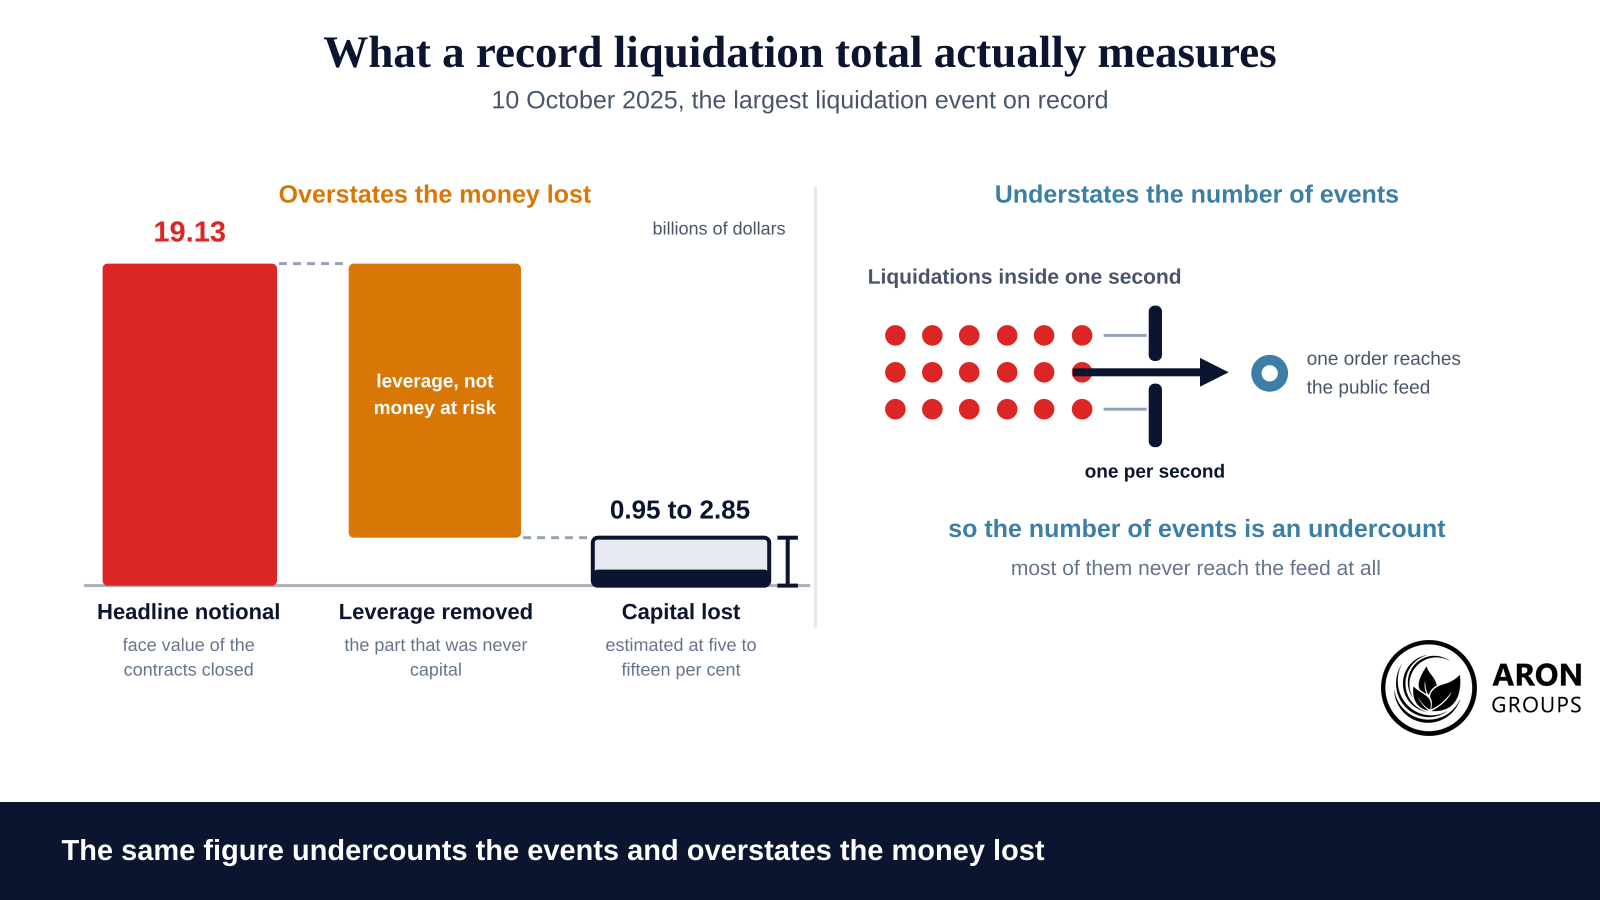
On 10 October 2025 the crypto derivatives market recorded the largest liquidation event to date. About nineteen billion dollars of positions were force closed within twenty four hours, across roughly 1.6 million accounts. The most quoted figures are 19.13 billion dollars and 1,618,240 traders. The trigger was the announcement of a one hundred per cent tariff on Chinese imports.

The market was primed rather than merely unlucky. Open interest stood near record levels and positioning was crowded on the long side, which is the textbook set up. For scale, a comparable event on 19 May 2021 liquidated about eight billion dollars in twenty four hours, roughly forty per cent of the October total.

Two different corrections apply to the same headline, and most coverage carries only one of them.

The first correction is that the figure undercounts liquidation events. Binance’s public liquidation stream pushes only one liquidation order per second, so during a burst most individual liquidations never reach the feed at all. The data aggregator that published the total said as much itself.

The second correction points the other way. Nineteen billion is notional value, the face value of the contracts closed, not capital destroyed. Estimates of the real capital lost run from about 0.95 to 2.85 billion dollars, roughly five to fifteen per cent of the headline. Both hold at once: too few events, too large a loss.

sms-star

Did You Know
Notional value is the size of the contract, not the money behind it. As an illustration, a position opened at fifty times leverage reports fifty dollars of liquidation for every dollar of margin the trader actually loses.

How to reduce your exposure to a cascade

You cannot prevent a cascade, so the objective is to avoid becoming one of its tiers. Two decisions do most of the work: the leverage you choose, which sets the distance to your liquidation price, and the free margin you hold in reserve. Position sizing rules and stop placement sit underneath those two.

The rest of the checklist is short, and none of it depends on predicting the cascade.

· Use lower leverage, because that choice alone sets the distance to your liquidation price.

· Hold a free margin buffer instead of running the account at full utilisation.

· Use stop losses, while accepting that stops can slip badly once a book empties.

· Avoid opening into dense liquidation clusters or into thin weekend liquidity.

· Watch open interest and funding rates together for one sided, over leveraged conditions.

Each item lowers the chance that one sequence of bad fills ends the account, which is the practical meaning of the risk of ruin. Testing a sizing rule against simulated adverse sequences tells you more than any single historical event does. Setting drawdown limits in advance removes the decision from the moment it matters.

Reading open interest, funding and heatmaps

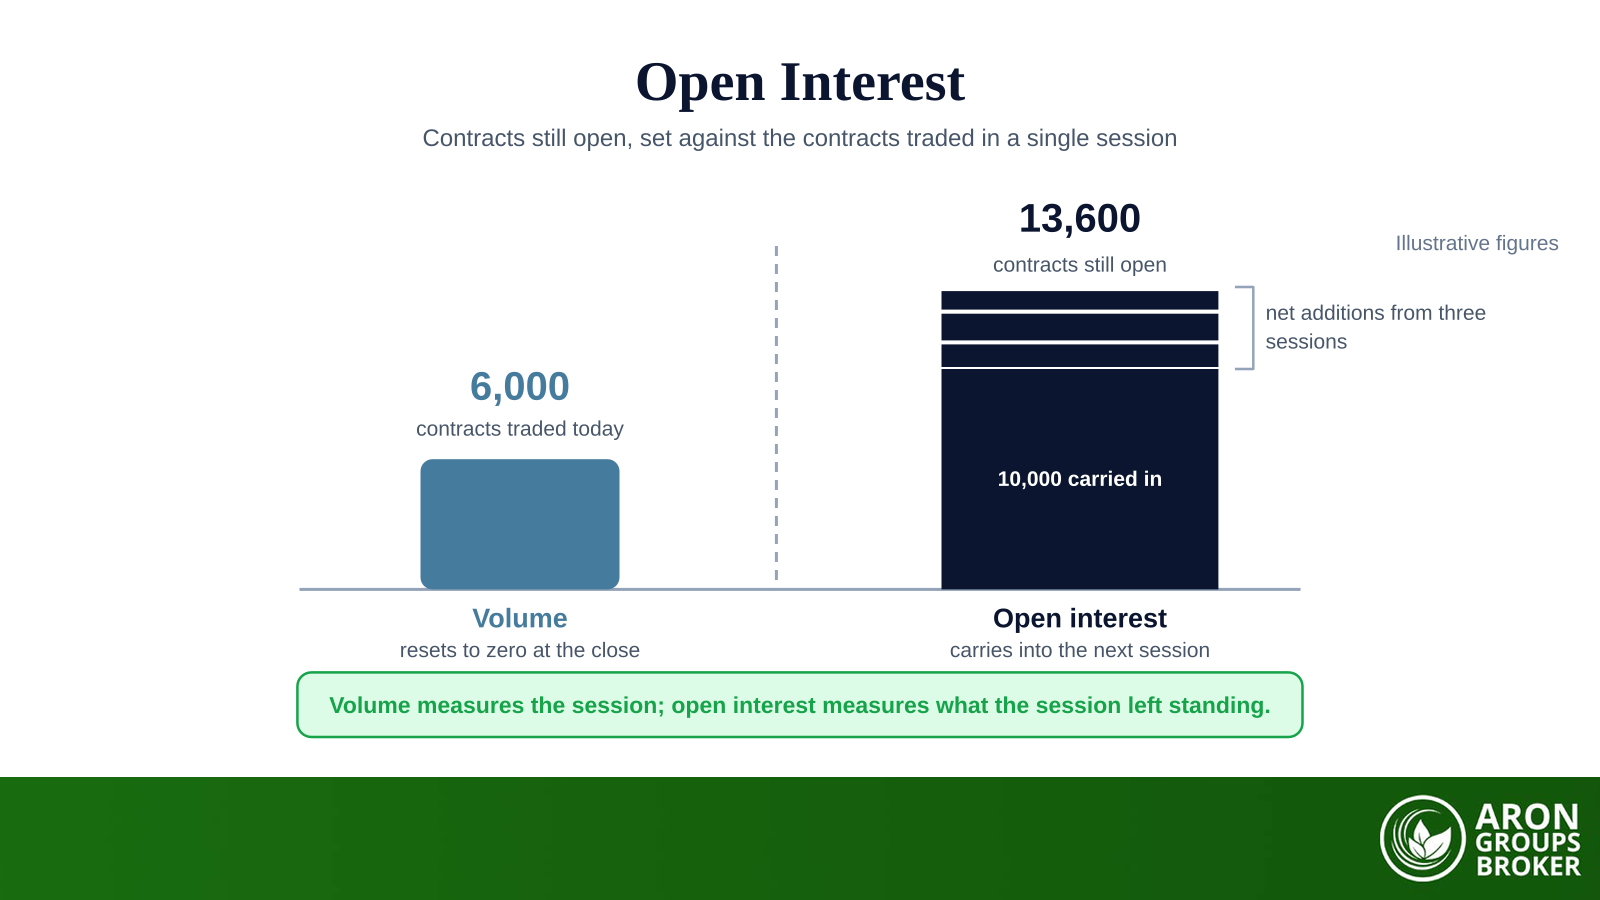
These three readings answer different questions. Open interest measures how much leveraged exposure is outstanding, so rising open interest into a trending move means more fuel. The funding rate shows which side is paying to hold its position, which identifies the crowded side. A liquidation heatmap estimates where clusters of liquidation prices sit, and price does often gravitate towards them.

Mini Example: sizing against a visible cluster

A trader wants a long position, and a heatmap shows a dense band of estimated liquidation prices three per cent below the market. The figure is illustrative, the problem is not. Entering at twenty times leverage puts that trader’s own liquidation price inside the band.

The fix is not a better entry, it is a smaller one. Cutting leverage moves the liquidation price beyond the cluster, so the position survives the move that would otherwise have added it to the cascade.

sms-star

Risk Warning
A stop loss does not guarantee an exit price. In a cascade the book can empty between your trigger and your fill, and the realised loss can be considerably larger than the planned one.


The honest limits of cascade analysis

Cascade analysis describes a mechanism well and forecasts almost nothing. The ingredients are observable, but the trigger, the timing and the depth are not. A systematic approach can encode the conditions and still miss the moment entirely. Knowing that a cluster sits three per cent below the market does not tell you whether price will reach it today, this quarter or never.

The heatmap deserves particular scepticism. It is a model built from estimated position data, not a record of real resting orders. Providers assume different things and draw different maps of one market. It shows where liquidations would occur under those assumptions, not where they will.

ReadingWhat it genuinely showsWhat it cannot show
Liquidation heatmapWhere modelled liquidation prices concentrateReal resting orders, or when price arrives
Open interestHow much leveraged exposure is outstandingWhich way that exposure will break
Funding rateWhich side is paying to hold its positionHow long the crowding will last
Headline liquidation totalNotional value force closed in a windowCapital lost, or the true number of events

Each of these readings describes conditions; none of them dates the trigger.

The claim that price is deliberately pushed towards liquidation clusters is a viewpoint rather than an established fact. Clusters form where leverage is dense, and price tends to move towards vulnerable positioning for reasons that need no intention behind them. The mechanism also travels well beyond crypto, which is why regulators publish plain warnings about leveraged currency products.

Q: Does a cascade always end in a rebound?
A: Often, but not dependably, and the distinction matters. Forced selling is mechanical rather than a considered change of view, so once it stops the price frequently recovers part of the move. It can also mark the start of a genuine repricing, in which case the buyers who stepped in during the cascade are simply early.

Where Aron Groups fits

Cascades are a property of leveraged venues, so the platform you trade through shapes how a violent move reaches your account. Aron Groups offers spot and contract for difference instruments on MetaTrader 5. Execution on its ECN accounts fills at the next available price with no requotes, and spreads float with the underlying market. A spread that widens in a fast move is information about liquidity.

Sizing down is the honest response to cascade risk, and it needs an account that allows it. The Nano account is commission free, with the cost carried in the spread. It supports micro volumes from 0.0001 lots, which makes a genuinely small position possible rather than nominal. Validate any rule you build here with out of sample testing rather than one memorable chart.

Conclusion

A liquidation cascade is the market’s own risk machinery running in a loop. Forced closures produce the price move that triggers the next set of forced closures, and the loop continues until resting liquidity absorbs the flow. Leverage decides how tightly the tiers are packed, and liquidity decides how far each tier pushes price.

The practical conclusion is unglamorous. You cannot forecast the trigger, so you plan for the move instead: lower leverage, spare margin, and a position size that survives a bad fill. Build that into risk management rather than a prediction, and protect the downside, because leveraged trading can cost more than you planned.

Frequently asked questions

Four questions come up repeatedly once traders start watching liquidation data.

What makes a liquidation cascade stop?

It stops when resting liquidity absorbs the forced orders, or when the cluster of liquidation prices is used up. Price often rebounds afterwards, because the selling was mechanical rather than considered, but that rebound is not a dependable signal.

Can a liquidation cascade happen in forex?

The same chain can form in any leveraged market with crowded positioning and thin depth. It is less common in deeply traded major currency pairs, and retail leverage is capped in several jurisdictions. The conditions matter more than the asset class.

Does every exchange use auto deleveraging?

Most large derivatives venues run some version of it, and the details differ. What stays consistent is the purpose: settling a bankrupt position when the insurance fund cannot. Read the venue’s own documentation, because trigger conditions and queue ranking are venue specific.

Is a liquidation heatmap worth using?

It is useful as a map of where leverage is concentrated and useless as a forecast. Read it as an estimate built from modelled positions, never as confirmed orders. Questions about how a broker handles execution in fast markets belong in that broker’s own documentation.

Continue Reading
not-found
calendar 6 October 2026
Rate this article

Leave a Reply

Your email address will not be published. Required fields are marked *

No thanks