Trading without a clear plan often leads to analysis paralysis or emotional decision-making. The MACD crossover trading strategy remains one of the most enduring methods for simplifying market entry and exit because it strips away the noise and focuses purely on moving averages.
In this guide, we will break down the indicator’s mechanics and show you how to separate high-probability signals from common market traps.
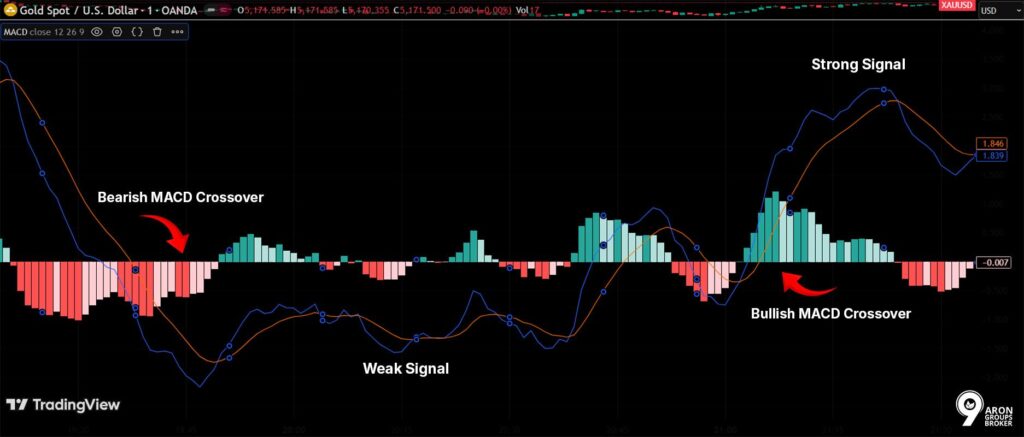
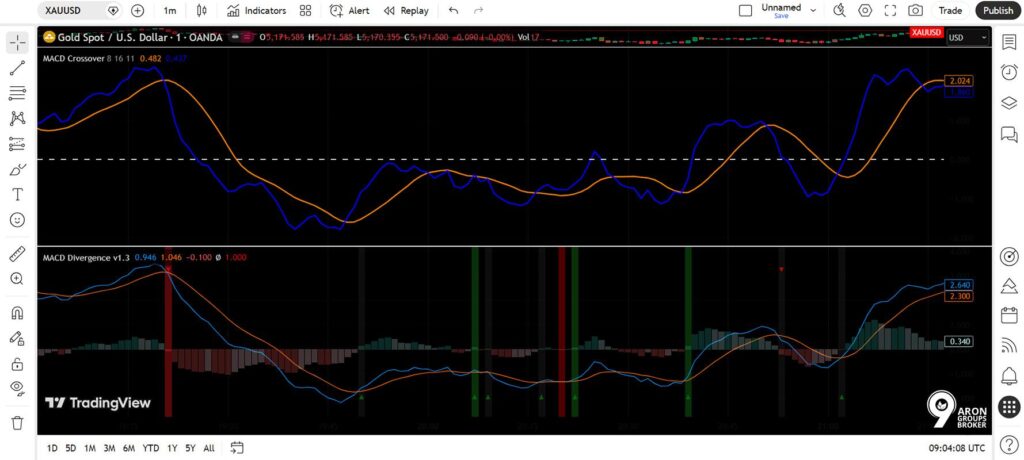
- A MACD crossover reflects a momentum shift, not a confirmed price direction. Always verify with the price structure.
- Crossovers above the zero line carry more bullish weight, as they confirm alignment across both EMAs.
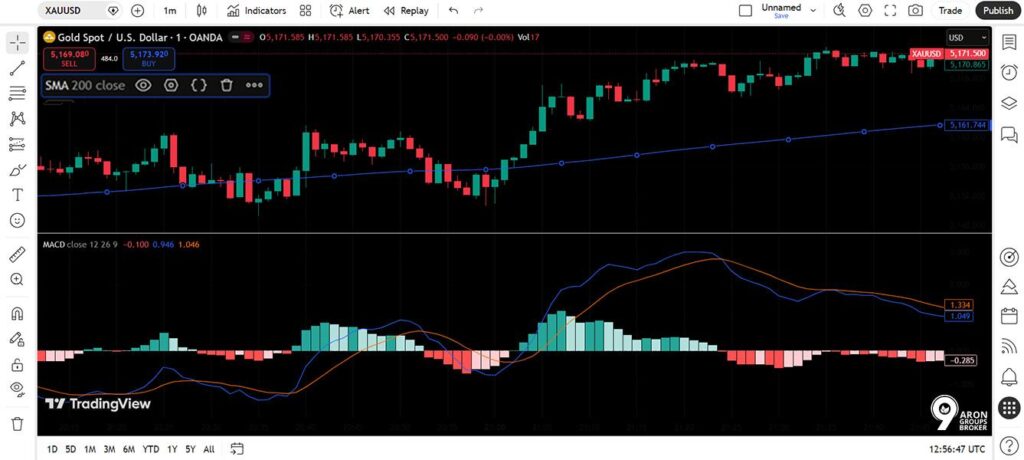
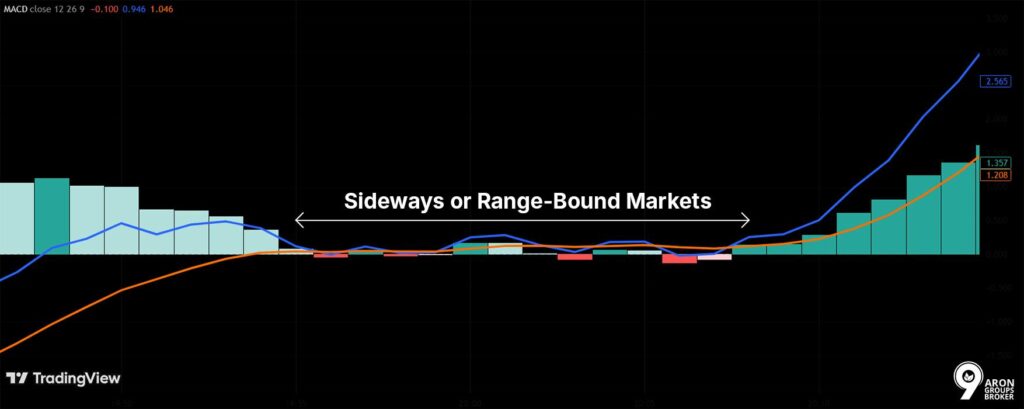
- False signals are most common in sideways markets. A trending environment, confirmed by a rising 200 SMA, improves consistency.
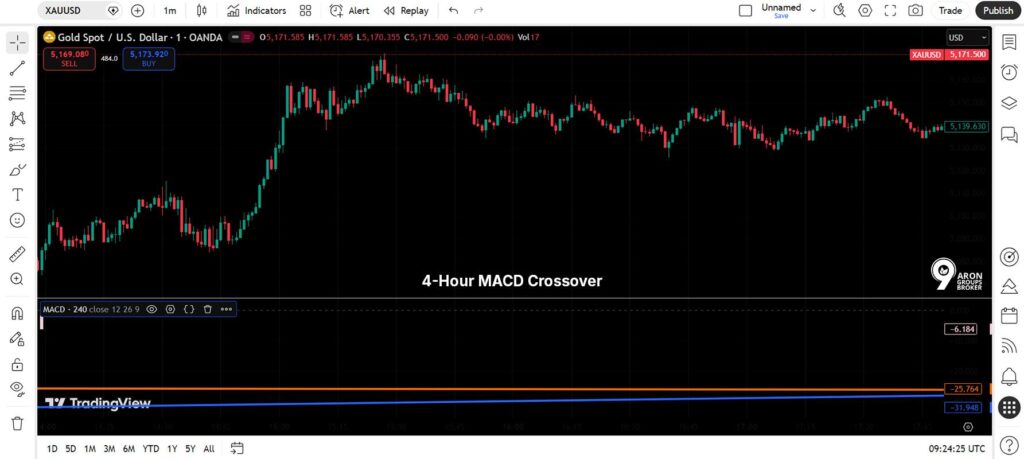
- Weekly and monthly MACD crossovers are rare but carry greater structural significance, best suited to swing and position traders.
Understanding the MACD Indicator
The Moving Average Convergence Divergence (MACD) is a popular tool used by traders to track market momentum. Examining the relationship between different moving averages helps identify whether a trend is strengthening or weakening.
Structure of MACD: Line, Signal, and Histogram
The MACD indicator is made up of three parts that work together to measure price speed and direction.
- The MACD Line: The heart of the indicator. It is calculated by subtracting the 26-period Exponential Moving Average (EMA) from the 12-period EMA.
- The Signal Line: This is a 9-period EMA of the MACD line itself. It acts as a “buffer” to smooth out the data.
- The MACD Histogram: The bar chart that sits behind the lines. It shows the gap between the MACD and signal lines.
When the MACD line moves above the signal line, the histogram grows positive (usually appearing above a centre line). When it drops below, the histogram becomes negative. These movements are the foundation of crossover signals.
| Component | Calculation | Purpose |
|---|---|---|
| MACD Line | 12 EMA − 26 EMA | Measures short-term vs long-term momentum |
| Signal Line | 9 EMA of MACD Line | Smooths MACD for crossover signals |
| Histogram | MACD Line − Signal Line | Visualises the gap between the two lines |
Key Point:
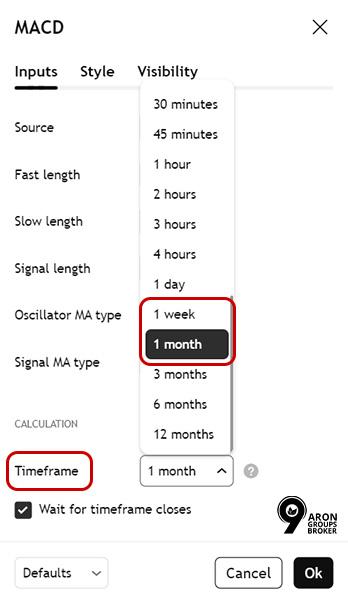
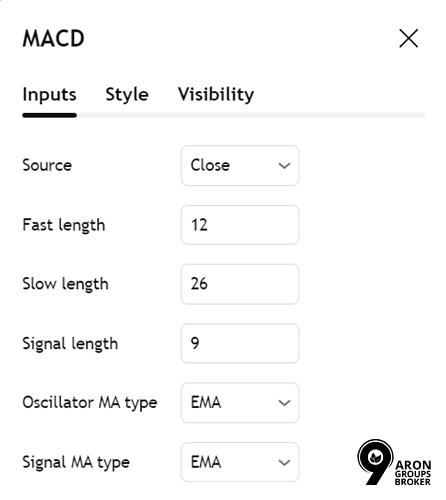
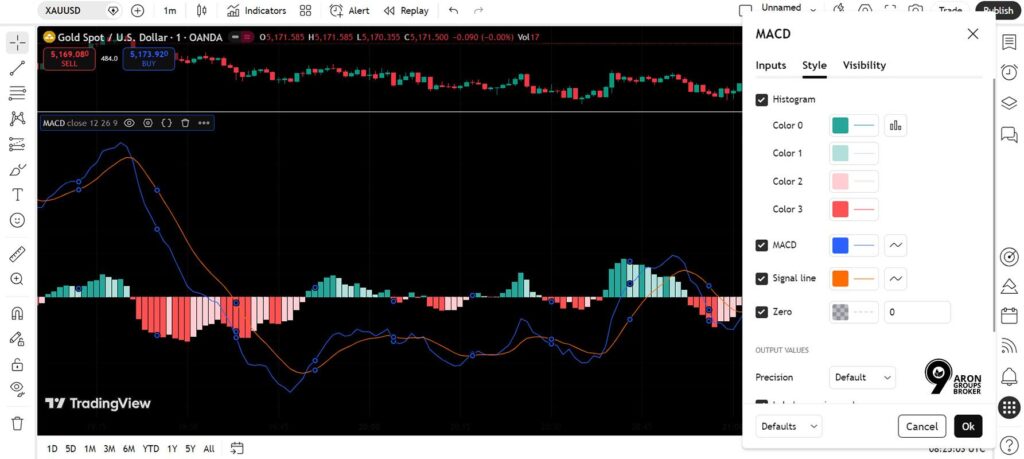
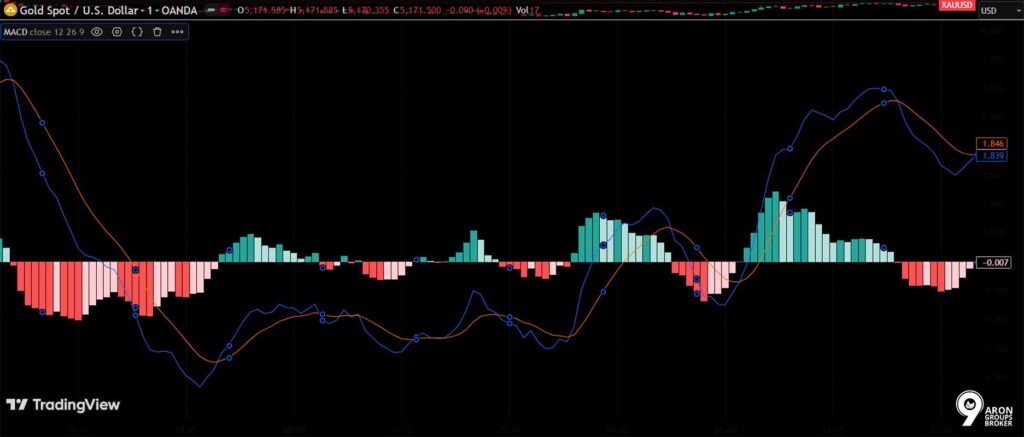
The standard MACD settings of 12-26-9 were originally created by Gerald Appel for the stock market. Today, many traders use these same default settings for forex, crypto, and indices.
Analysing Momentum Through MACD Crossovers
A MACD crossover occurs when the MACD line crosses above or below the signal line. This shift tells us that the speed of price movement is either accelerating or slowing down.
- Bullish Momentum: When short-term prices rise faster than long-term prices, the MACD line climbs above the signal line. This suggests that upward momentum is increasing.
- Bearish Momentum: When the MACD line falls below the signal line, it suggests that downward momentum is taking over.
Understanding what a MACD crossover represents in terms of momentum is vital. It helps you avoid using it as a basic “buy” or “sell” button; instead, you should use it as a signal that requires further confirmation from other market data.
Types and Strength of MACD Crossovers
This section explores how to identify high-quality trading signals by analysing the position and intensity of MACD crosses.
Bullish vs Bearish MACD Crossovers
As explained in Fidelity.com, a bullish MACD crossover occurs when the MACD line crosses above the signal line. This suggests that short-term price momentum is accelerating upward compared to the long-term average.
Conversely, a bearish MACD crossover happens when the MACD line drops below the signal line, indicating that downward momentum is gaining strength.
Both types of crossovers are considered more significant when the histogram shifts from shrinking to expanding immediately after the lines cross. Furthermore, the quality of the move matters:
- Strong Signal: A sharp, steep crossover accompanied by a rapidly widening histogram suggests powerful momentum.
- Weak Signal: A flat or lazy crossover with a small histogram suggests the market lacks conviction.
Signal Line vs Zero Line Crossovers
Traders generally distinguish between two specific types of MACD events: the signal line crossover and the zero line crossover.
- Signal Line Crossover: This is when the MACD line crosses the signal line. It is the “early warning” signal and happens frequently.
- Zero Line Crossover: This occurs when the MACD line crosses the centreline (the zero mark). This confirms that the 12 EMA and 26 EMA have actually crossed each other, representing a structural shift in the trend.
Important:
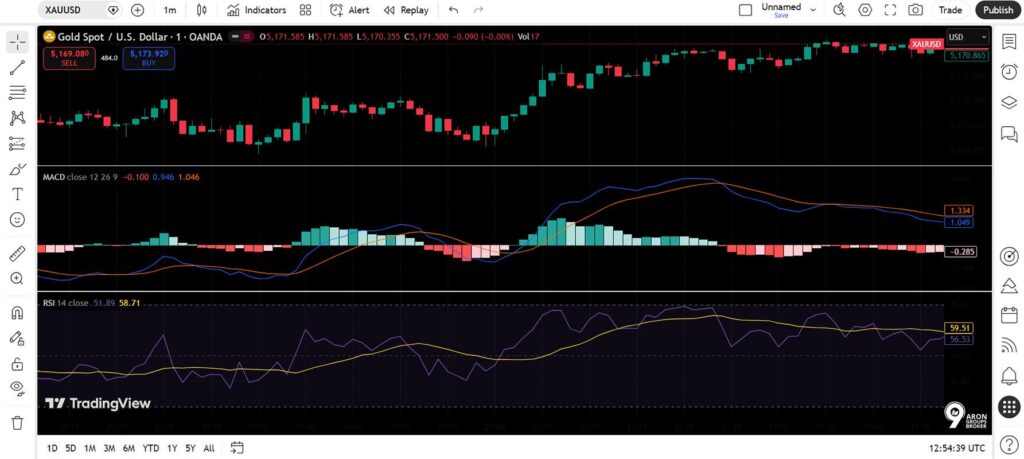
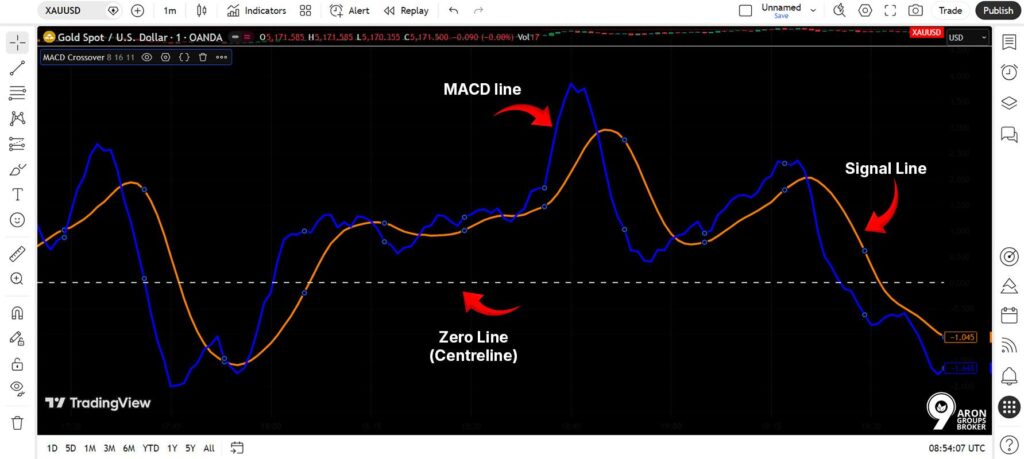
Signal line crossovers provide earlier entries but often contain more "noise" (false signals). Zero line crossovers occur later but offer a more reliable confirmation of a trend change.
Measuring Crossover Strength Relative to Zero Line
The location of a crossover in relation to the zero line is a major factor in its reliability.
- Above the Zero Line: If a bullish crossover happens while both lines are already above zero, it indicates that momentum is re-accelerating within an established uptrend.
- Below the Zero Line: A bullish crossover that occurs deep in negative territory may simply be a relief rally or a temporary pause within a larger downtrend, rather than a full reversal.
By checking the crossover’s position relative to the zero line, traders can better distinguish between a signal that continues a strong trend and one that might be a false reversal.
Signal Characteristics and Reliability
This section explains how to tell the difference between a high-quality signal and a false alarm when using the MACD.
Leading vs Lagging Nature of MACD Signals
The MACD is classified as a lagging indicator because it is based on past price data. It does not predict where the price will go; instead, it reflects momentum shifts that have already started.
This means a MACD crossover will rarely get you in at the exact bottom or out at the very top of a move. However, this delay is actually useful because it filters out the noise and random price jumps that more sensitive indicators might catch. It is best to treat the MACD as a confirmation tool rather than a crystal ball.
Divergence vs Crossover Signals
It is important not to confuse MACD divergence with a standard MACD crossover, as they provide different types of information.
- Divergence: This happens when the price reaches a new high (or low), but the MACD histogram or line fails to do the same. This suggests the current trend is losing steam, and a reversal might be coming.
- Crossover: This is a direct signal based on the lines crossing at a specific moment, providing a clearer trigger for a trade.
Key Point:
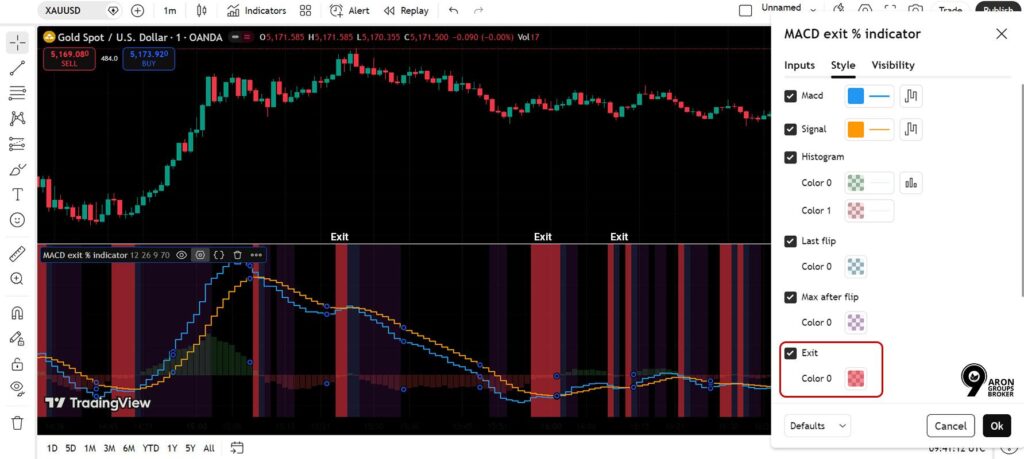
A popular strategy is to use divergence as an early warning that a trend is weakening, and then wait for a crossover to confirm the best time to enter the trade.
Identifying False Signals in Sideways Markets
According to Chartschool, the MACD performs poorly in sideways or range-bound markets. When the price has no clear direction, the MACD and signal lines tend to cross back and forth repeatedly without any real price movement.
These are known as false signals or whipsaws. If you trade every crossover in a flat market, you may suffer a series of small, frustrating losses. To avoid this, always try to identify if the market is trending before you trust a MACD signal.
Warning:
During market consolidation, even a bullish MACD crossover should be viewed with caution. Always check if the price is supported by a rising moving average before acting.
Q: How do I know if the market is trending or consolidating before using a MACD crossover?
A: A simple and effective method is to add a 200-period Simple Moving Average (SMA) to your chart. If the price is consistently above a rising 200 SMA, the market is in an uptrend. In this environment, bullish MACD crossovers (especially those above the zero line) have a much higher success rate than those found in flat or falling markets.
Timeframes and Trade Timing
This section explains how to choose the right chart settings based on your trading style and how long you plan to hold a position.
30-Minute MACD Crossover for Intraday Moves
A 30-minute MACD crossover is a popular choice for day traders looking to capture price movements within a single session. While these signals appear frequently, they are more susceptible to market noise and false starts.
Because momentum can shift rapidly on a 30-minute chart, traders usually need extra filters, such as checking the trend on a higher timeframe before taking action. Looking for volume confirmation can also help you tell the difference between a strong move and a weak one.
Important:
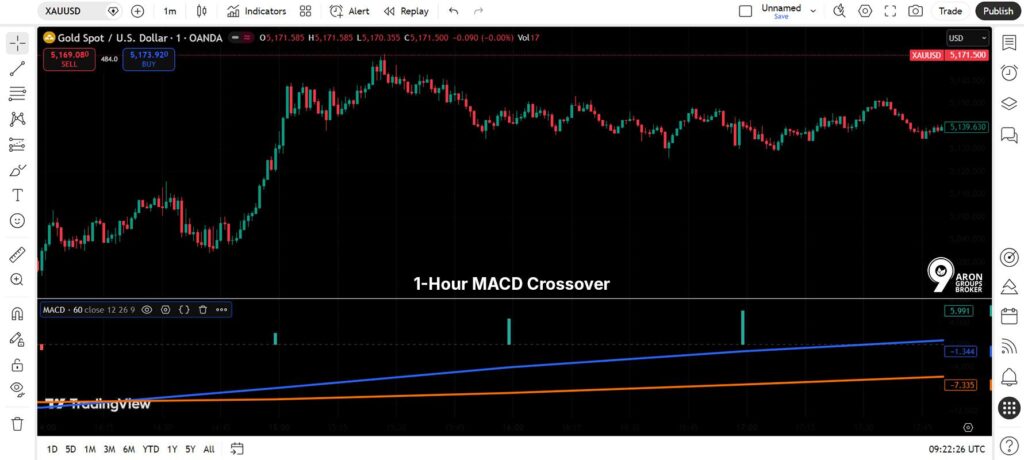
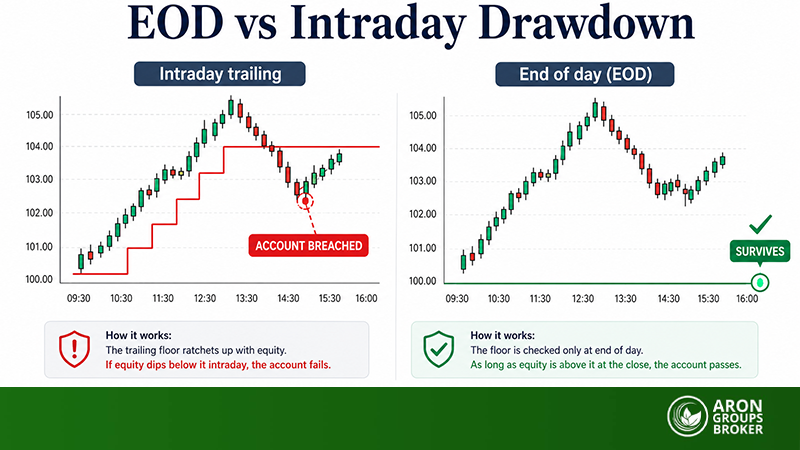
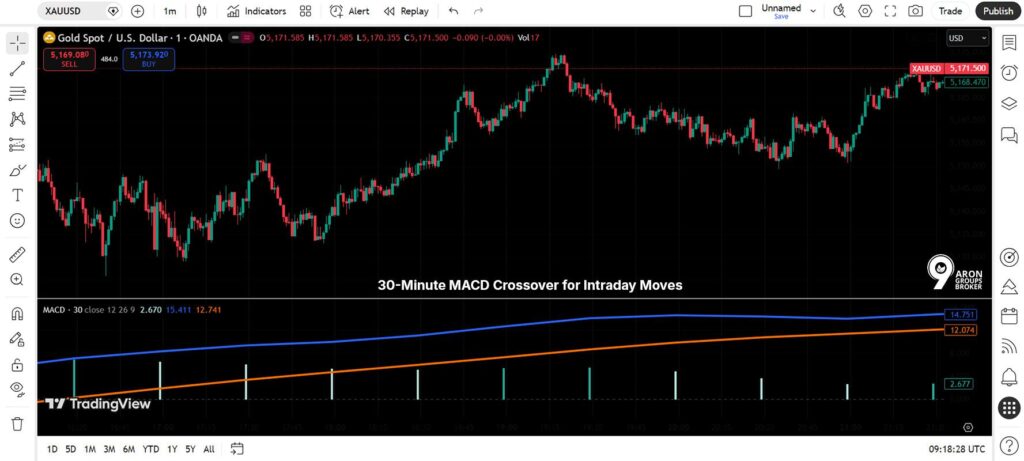
Intraday crossovers require active monitoring. They are not a good fit for traders who cannot check their screens in real time.
1 Hour and 4 Hour MACD Crossover Strategies
The 1-hour MACD crossover and the 4-hour MACD crossover offer a balanced middle ground. They filter out minor price fluctuations while still providing plenty of opportunities.
- 4-Hour Chart: This is particularly practical for part-time traders. A crossover here reflects a momentum shift that usually lasts from several hours to a few days, so you don’t need to watch the market every minute.
- 1-Hour Chart: This provides more frequent signals but carries slightly less weight or reliability than the 4-hour version.
Both timeframes work best when they align with the long-term trend seen on a daily chart.
Weekly and Monthly MACD Crossovers for Swing Trades
A weekly MACD crossover is a long-term signal used by position traders and investors to spot major shifts that last for weeks or months. These signals are rare, but they carry significant statistical weight because they represent a fundamental change in market behaviour.
A monthly MACD crossover is even rarer. It is mostly used by long-term investors or those managing broad market indices and asset allocations. Using a weekly MACD crossover screener can be a helpful way to find assets that are just beginning a major new trend.
While higher-timeframe signals (weekly and monthly) are more reliable, they also require a larger stop-loss distance to account for the natural price volatility over such a long period.
Q: Can I use a weekly MACD crossover together with a daily entry signal?
A: Yes, and this is a very effective multi-timeframe approach. You use the weekly MACD crossover to decide your overall direction (bullish or bearish). Then, you watch the daily chart for a confirming crossover to time your entry. This method results in fewer trades, but the ones you do take are generally of much higher quality.
Using MACD Crossovers in Trading
This section explains how to turn MACD signals into a structured trading plan with clear entry and exit rules.
Entry Signals and Confirmation Using MACD
In a professional MACD crossover trading strategy, the crossover itself is usually the trigger, not the entire reason for the trade. The most reliable approach is to wait for a bullish MACD crossover and then look for price action to confirm the move. This might include a candle closing above a key resistance level.
Trading a crossover without this extra confirmation increases the risk of a false signal, especially in volatile or sideways markets. Other ways to confirm an entry include:
- Higher-timeframe alignment: Ensuring the weekly trend matches your daily signal.
- Volume expansion: Seeing an increase in trading activity as the crossover happens.
- Structure break: Waiting for the price to break above a recent high.
Trade Exit Signals and Stop Placement
MACD crossovers are just as useful for leaving a trade as they are for entering one. For example, if you are in a “long” (buy) position, a bearish crossover suggests that upward momentum is fading, which may be a good time to close all or part of the trade.
When it comes to stop-loss placement, most traders rely on the price chart rather than the indicator:
- For Long Trades: Place the stop-loss just below the most recent swing low.
- For Short Trades: Place the stop-loss just above the most recent swing high.
Risk Management Strategies with MACD
A MACD strategy only works if it is backed by a solid risk framework. Before entering any trade, you must define your position sizing, stop-loss distance, and risk-to-reward ratio.
A standard rule is to risk no more than 1-2% of your total trading capital on a single trade. If you are trading on weekly or monthly charts, your stop-loss distance will likely be wider. In this case, you must reduce your position size to keep your total risk within that 1-2% limit.
Discipline in following these rules is often more important than the indicator’s accuracy.
Using Screeners and Alerts to Spot High-Probability Crossovers
You don’t need to watch charts manually all day. You can use a MACD crossover alert on platforms like TradingView or MetaTrader to notify you the moment a crossover occurs.
Furthermore, a screener MACD crossover tool can scan hundreds of assets at once to find those nearing a signal.
For those in the digital currency space, a MACD crossover alert crypto feature can help you filter through various coins in real time. These tools don’t replace your analysis, but they help you prioritise which charts deserve your attention.
Q: What is a reasonable MACD crossover strategy success rate to expect?
A: There is no “magic” number, as results vary by market and timeframe. In trending markets, systematic strategies typically achieve win rates of 40% to 55%.
Profitability depends more on your risk-to-reward ratio than your win rate; a trader can be highly successful with only a 45% win rate if their average profits are significantly larger than their average losses.
Optimising MACD Settings
This section explains how to fine-tune your indicator for different markets and how to combine it with other tools for better accuracy.
Standard MACD Settings (12-26-9) and Custom Adjustments
The default MACD settings of 12-26-9 represent the 12-period EMA, the 26-period EMA, and the 9-period signal line EMA. Originally designed for daily stock charts, this configuration remains the most popular choice for most traders.
However, you can adjust these numbers to suit different market speeds:
- Faster Markets: For volatile assets like crypto or intraday forex, some traders shorten the settings (e.g., 5-13-5) to get quicker signals.
- Slower Markets: For long-term analysis, wider settings (e.g., 19-39-9) can be used to filter out minor fluctuations.
Always test any custom changes on historical data before using them in live trading.
Quick view table of Standard MACD Settings
| Setting Type | Parameters | Best Suited For |
|---|---|---|
| Standard | 12-26-9 | Daily stocks, swing trading |
| Fast | 5-13-5 | Intraday forex, crypto scalping |
| Slow | 19-39-9 | Weekly charts, position trading |
Combining MACD with Trend and Momentum Indicators
Pairing MACD crossovers with other trend-following tools can significantly improve the quality of your signals.
- MACD + 200 SMA: A common strategy is to only take bullish crossovers when the price is above the 200-period Simple Moving Average (SMA). This ensures you are trading in the direction of the long-term trend.
- MACD + RSI: You can use the Relative Strength Index (RSI) to see if a market is “overbought” or “oversold” when a crossover occurs. While the MACD identifies the momentum shift, the RSI provides context on whether the price has already moved too far in one direction.
The goal of combining indicators is to reduce false signals and clarify your timing. To avoid analysis paralysis, limit yourself to two or three filters at most.
Conclusion
The MACD crossover represents the constant tug-of-war between short-term buyers and long-term sellers rather than just two simple lines crossing on your screen. While the default settings provide a solid foundation, success lies in pairing your signals with price action, volume, or a 200-period SMA.
This ensures you are never trading against the broader market tide, helping you filter out weak signals and improve your overall trade accuracy.