


Financial markets move in cycles. Stan Weinstein’s Stage Analysis offers a structured way to understand these cycles and trade them with discipline. Instead of guessing tops and bottoms, stage analysis focuses on identifying where a stock stands within a four-stage framework and aligning trades with the dominant trend.
In this guide, you will learn how Stage Analysis works, how to apply it on platforms like TradingView and MetaTrader, and how to use it to select, analyse, and trade stocks with greater confidence and risk control.

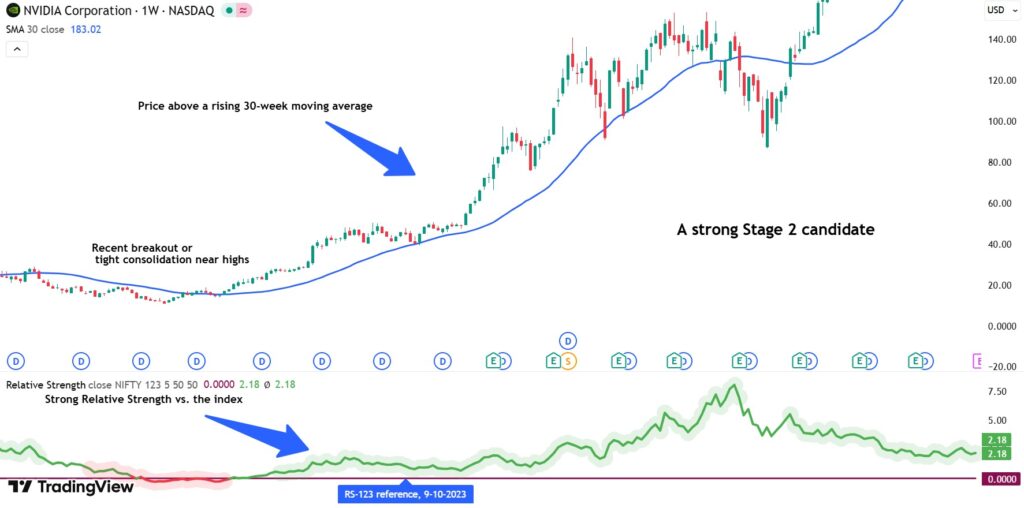
- Stage Analysis trading performs best in Stage 2, when the price is above a rising 30-week MA, RS is strong, and breakouts are supported by volume.
- A Stage 1 base becomes actionable only after confirmation — a valid breakout with volume expansion and improving Mansfield RS.
- Stage 3 is where risk shifts from growth to defence.
- Stage 4 is where long positions are usually trash.
Stage Analysis Fundamentals
Stage Analysis is not just a chart technique. It is a structured way to understand how money flows through the stock market. Developed by Stan Weinstein, this model helps traders and investors identify where a stock stands within a broader market cycle.
What Is Stage Analysis in Stock Trading?
According to Traderlion, Stage Analysis is a trend-based method that classifies a stock into one of four market phases. It was developed by Stan Weinstein and explained in his 1988 well-known book on stage analysis. The goal is simple: trade in the direction of the primary trend and avoid low-probability setups.
In simple terms, stage analysis trading divides a stock’s life cycle into four stages:
- Stage 1 – Basing (Accumulation)
- Stage 2 – Advancing (Mark-Up)
- Stage 3 – Topping (Distribution)
- Stage 4 – Declining (Mark-down)

In practical terms, stage analysis trading asks one key question:
“Is this stock in a stage where buying makes sense?”
Why Stan Weinstein Stage Analysis Remains Relevant
Even in 2026, the reason stock stage analysis continues to work is simple: trends persist, and capital rotates between sectors.
Weinstein’s stage analysis remains powerful because it is based on trend structure rather than prediction. Markets still move through:
- Accumulation
- Mark-up
- Distribution
- Mark-down
Algorithms may execute trades faster, but institutions still build positions over weeks or months. This creates identifiable basing patterns and volume signatures.
Stan Weinstein’s 4 Market Stages
Stan Weinstein’s Stage Analysis breaks every stock’s life cycle into four repeating phases. Each stage has a clear definition, a set of observable characteristics, and a distinct market psychology.
Stage 1: Basing/Consolidation Pattern Stage Analysis
Stage 1 is a stabilisation phase after a decline. Price stops falling and forms a base (a range) while the long-term trend shifts from bearish to neutral.
Key characteristics:
- Sideways price range (e.g., $40–$48 over 12–24 weeks)
- 30-week moving average flattens after falling
- Volatility contracts; “boring” candles dominate
- Volume often dries up, with occasional spikes
- Relative Strength stops getting worse, then begins to improve
Psychology:
This is where weak hands are gone, and smart money begins to quietly accumulate. Retail traders get impatient because “nothing happens.” That impatience is exactly why Stage 1 works: institutions need time to build size without chasing price.
Practical note:
Don’t buy inside the base just because it “looks cheap.” Stage 1 is about preparation, not confirmation.
Stage 2: Advancing Trend Stage Analysis
Stage 2 is the sustained uptrend. It begins when the price breaks out of the base, and the major trend turns up.
Key characteristics:
- Price holds above a rising 30-week moving average
- Higher highs and higher lows
- Breakouts above resistance with volume spike confirmation
- Pullbacks tend to find support near prior resistance (support flip)
- Relative Strength vs. the index is strong (Mansfield RS is often above zero)
Psychology:
Stage 2 is mark-up. Institutions are already positioned and now push prices higher. Sceptics keep waiting for a pullback that never comes. Late buyers chase. The trend feeds itself because dips get bought.
Practical note:
Stage 2 is the only stage where aggressive long exposure makes sense. If you “want action,” earn it by trading Stage 2, not by forcing trades elsewhere.
Stage 3: Topping/Distribution Stage Analysis
Stage 3 is a transition from bullish to neutral or bearish. The uptrend loses strength, and institutions distribute shares into public demand.
Key characteristics:
- 30-week moving average flattens
- Price becomes choppy; failed breakouts increase
- Wider swings and more volatility than Stage 2
- Down weeks show heavier volume than up weeks
- Relative Strength weakens versus the index
- Key support levels start getting tested repeatedly
Psychology:
This is where the crowd is still bullish, but smart money is selling into strength. Headlines are usually positive because the price has been strong recently. Retail interprets sideways action as “healthy consolidation,” while institutions are reducing exposure.
Practical note:
Protect profits. Reduce size. Tighten stops. Stage 3 punishes complacency.
Stage 4: Declining Phase Stage Analysis
Stage 4 is the sustained downtrend. It begins when the base/support fails and the major trend turns down.
Key characteristics:
- Price stays below a falling 30-week moving average
- Lower highs and lower lows
- Breakdowns through support with expanding volume
- Weak Relative Strength (persistent underperformance)
- Rallies are often sharp but short-lived (bear market rallies)
Psychology:
Hope turns into denial, then panic. Investors average down because they “can’t sell at a loss.” Short sellers and institutions sell rallies. Retail keeps searching for the bottom. Most of the damage happens because people refuse to accept the stage change.
Practical note:
Long trades here are usually trash unless you are trading very short-term mean reversion with strict risk rules. For most traders and investors, Stage 4 is for defence, not offence.
Recognising Stage Analysis Patterns on Stock Charts
If you want accurate stock stage analysis, stop staring at daily noise. Use a weekly chart first.
A clean process (that actually works):
- Open a weekly chart and add the 30-week moving average.
- Check where the price sits relative to the MA and whether the MA is rising/flat/falling.
- Compare the Relative Strength vs. a benchmark (S&P 500) and watch Mansfield RS behaviour.
- Study volume: Does it confirm breakouts or confirm breakdowns?
- Mark key levels where resistance-to-support flips (or fails).
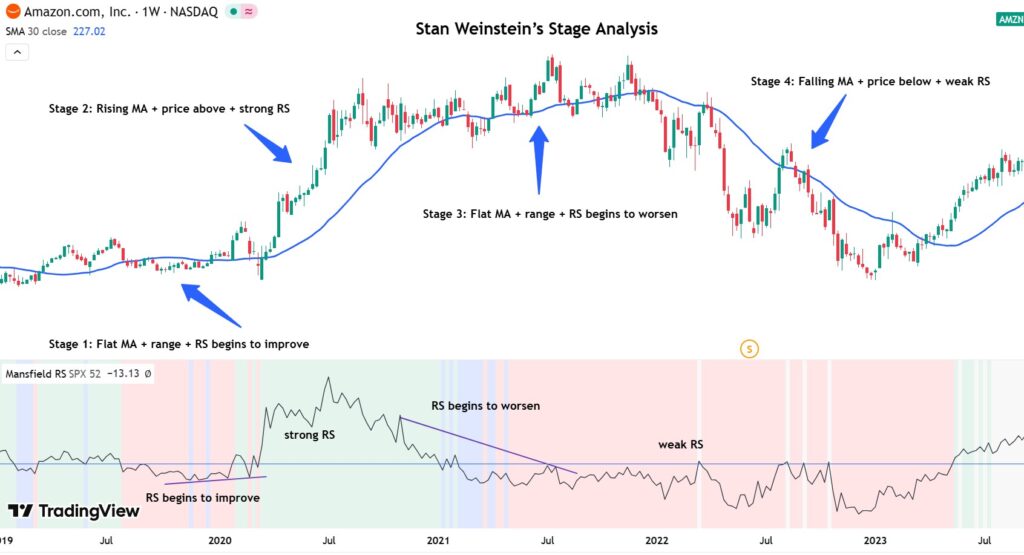
Fast stage checklist:
- Rising MA + price above + strong RS + breakout volume → Stage 2
- Flat MA + range + contracting volatility → Stage 1 or 3 (use RS + volume to decide)
- Falling MA + price below + weak RS → Stage 4
Warning:
If you can’t confidently label the stage, you have no business trading it. The whole point of Weinstein stage analysis is to stop forcing trades and start filtering for the few situations where the odds are genuinely in your favour.
Trader vs. Investor Timeframes in Stage Analysis
According to Investopedia, Stage Analysis is flexible and time-frame independent.
The core model stays the same, but the timeframe changes depending on whether you are a trader or an investor.
Stan Weinstein’s stage analysis was originally designed using weekly charts and the 30-week moving average, which naturally suits medium- to long-term positioning.
However, the logic can be adapted for all traders and investors:
- Investors focus on full Stage 2 cycles that may last 6–18 months.
- Swing traders may apply the same structure on daily charts using a 30-day moving average.
- Position traders often combine weekly Stage 2 confirmation with daily entry timing.
For example, in 2026, a stock breaks above $120 after six months of consolidation. The 30-week moving average turns upward. Relative Strength vs. the index improves:
- An investor may hold until the stock shows a clear Stage 3 distribution.
- A trader may aim for a 15–25% move and trail a stop below higher lows.
The model stays constant. Risk management and holding period change.
Stage Analysis for Traders and Investors
Investors seek trend duration. For investors, stock market stage analysis acts as a long-term capital filter. It prevents holding stocks during prolonged downtrends.
Traders seek precision. For traders, stage analysis trading provides entry timing.
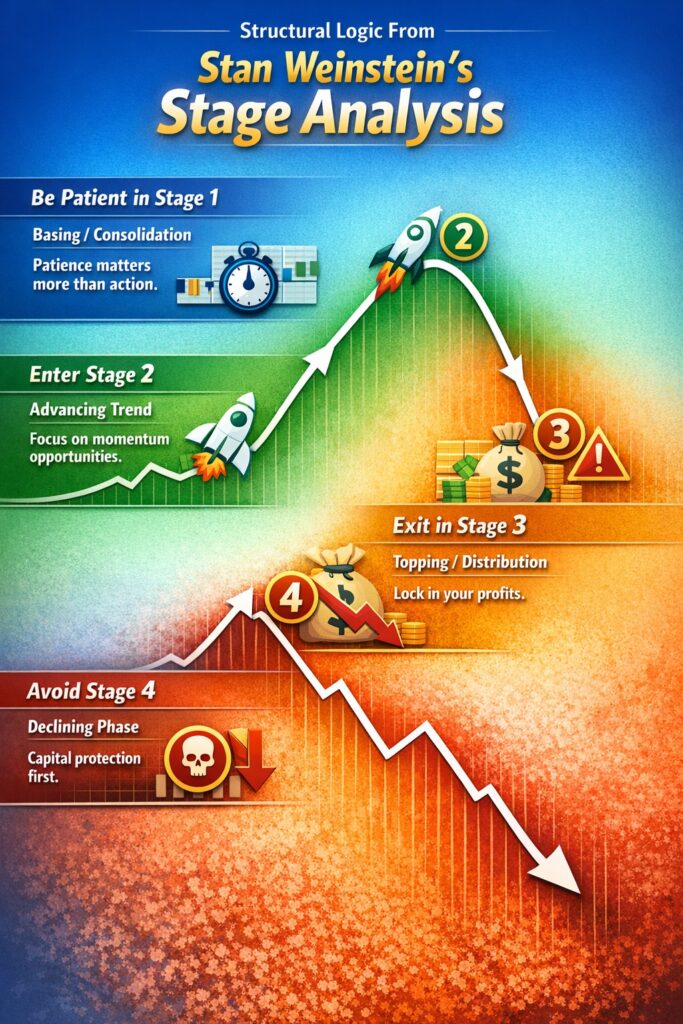
َAccording to Alphatarget, regardless of whether you are a trader or an investor, your decisions must rely on the same structural logic from stan weinstein’s stage analysis:
- Be patient in Stage 1: In the basing or consolidation phases, patience matters more than action.
- Enter Stage 2: When the market is in a confirmed uptrend, you focus on opportunities that move with momentum.
- Exit in Stage 3: Near the end of transitional topping phases, exit your position and lock in your profits.
- Avoid Stage 4: When the market shifts into a structural decline, capital protection becomes the priority.
Choosing Your Trading Approach with Stage Analysis
Before using weinstein stage analysis, ask yourself:
- Are you comfortable holding positions for 6–12 months?
- Or do you prefer shorter trades lasting weeks?
If you prefer active trading:
- Use daily charts for entry.
- Confirm weekly Stage 2 structure.
- Apply a tight stop loss below the breakout levels.
If you prefer investing:
- Focus mainly on weekly charts.
- Hold while the 30-week moving average is rising.
- Exit only when Stage 3 transitions into Stage 4.
Choosing Your Trading Approach with Stage Analysis
| Criteria | Active Trading Approach | Investing Approach |
|---|---|---|
| Primary Goal | Capture short- to medium-term price swings | Capture major Stage 2 trends |
| Chart for Entry | Daily chart | Weekly chart |
| Trend Confirmation | Confirm the weekly Stage 2 structure before entry | Focus mainly on the weekly structure |
| Moving Average Focus | Use daily levels for timing, weekly 30-week MA for trend filter | Hold while the 30-week moving average is rising |
| Risk Management | Apply tight stop loss placement below breakout levels (e.g., 5–10% below entry) | Wider stop, exit only when Stage 3 shifts toward Stage 4 |
| Holding Period | Days to weeks | Months to over a year |
| Exit Strategy | Trail stop below higher lows | Exit when Stage 3 transitions into Stage 4 |
Stage Analysis Tools
To apply Stage Analysis properly, you need structure and consistency. Guesswork is not a tool. The right setup lets you filter hundreds of stocks and focus on high-probability Stage 2 candidates.
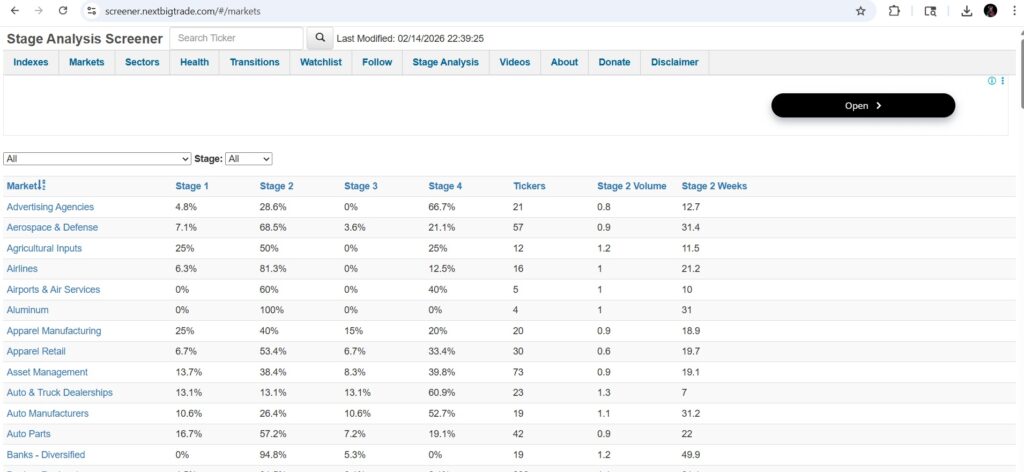
Stage Analysis Screener for Stocks
A stage analysis screener helps you efficiently scan the market. Instead of manually checking hundreds of stocks, you filter based on objective criteria.
Example filters for Stage 2:
- Price above the 30-week moving average
- 30-week MA trending upward
- Relative Strength outperforms the index
- Recent breakout above the 52-week high
- Volume above 30% of the average on the breakout week
Tradingview Setup for Stage Analysis Charts
Stage analysis TradingView setups are simple and effective. Keep your chart clean.
Step-by-step setup:
- Switch to the weekly timeframe.
- Add a 30-week moving average (simple MA).
- Add a Relative Strength comparison vs. the Market Index.
- Add volume at the bottom of the chart.
Optional:
- Add the Mansfield Relative Strength indicator.
- Draw key support and resistance levels.
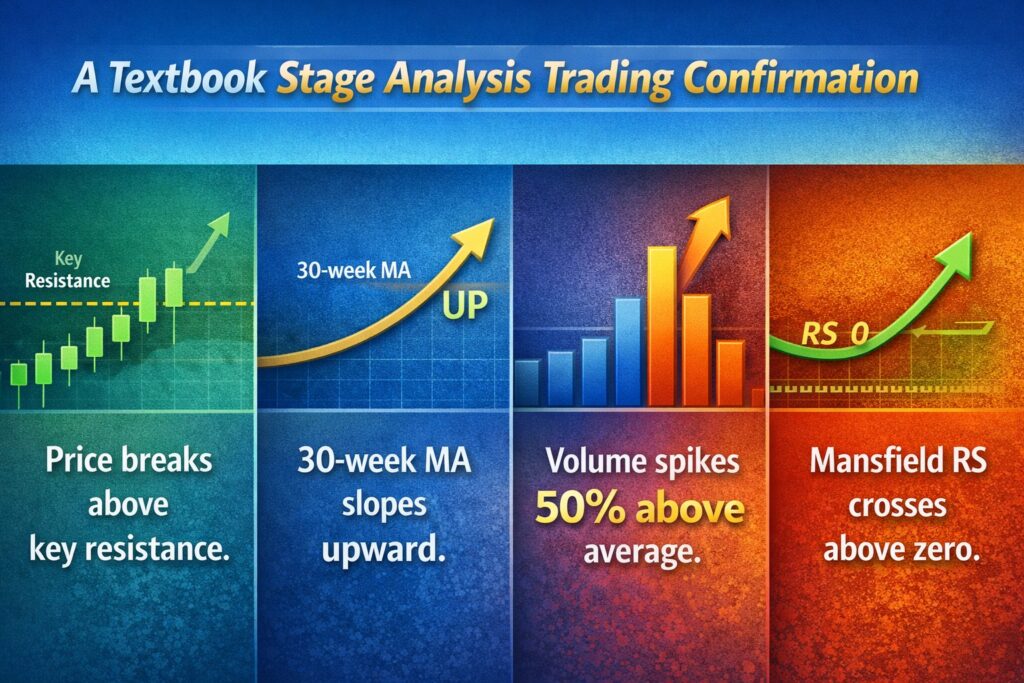
A textbook Stage Analysis trading confirmation is as follows:
- Price breaks above key resistance.
- 30-week MA slopes upward.
- Volume spikes 50% above average.
- Mansfield RS crosses above zero.
MetaTrader Tools for Stage Analysis
Although MetaTrader is more common in Forex, it can also be used for stock market stage analysis if your broker provides stock CFDs.
Here is how to adapt it:
- Add a 30-period moving average on the weekly chart (equivalent to 30-week MA).
- Use built-in volume (if available) or tick volume as a proxy.
- Compare performance manually against an index chart.
Since MetaTrader does not have a built-in Mansfield RS, you may need to use a custom indicator or perform manual comparisons.
Key Insight:
If you follow the rules of stan weinstein stage analysis 30-week moving average, you will maintain clarity regardless of the trading platform you use.
Stage Analysis Indicators
Indicators in Stage Analysis are for confirmation. Stan Weinstein’s stage analysis focuses first on trend structure. Indicators simply validate whether institutions are supporting the move.
The goal is alignment.
Let’s break down the most important stage analysis indicators.
Relative Strength & Mansfield RS for Stage Analysis
Relative Strength (RS) in stock market stage analysis measures performance relative to a benchmark index, such as the S&P 500.
RS is not RSI. It is a comparative strength.
Example:
- Stock A rises 12% in 3 months.
- S&P 500 rises 4% in the same period.
Stock A is outperforming. That is positive Relative Strength.
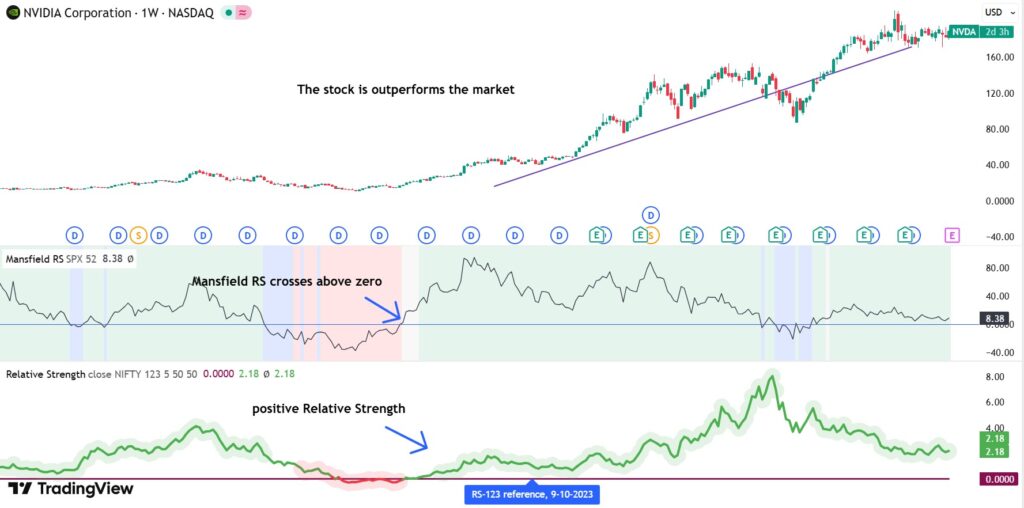
Mansfield Relative Strength (Mansfield RS) refines this concept. It compares RS against its own moving average. When Mansfield RS crosses above zero, it signals outperformance and confirms leadership.
Trading Rule:
In weinstein stage analysis, we always look the stocks which outperform the market.
Volume Spike Confirmation in Stage Analysis
Volume reveals conviction. In stage analysis trading, breakouts must be supported by strong volume.
As a typical rule, breakout volume should be at least 40–50% above average.
For example, this is proper volume spike confirmation:
- Average weekly volume: 1 million shares
- Breakout week volume: 1.6 million shares
Q: Why does volume spike matter?
A: Because institutions cannot hide volume. When large funds enter, volume expands.
Key Point:
Volume confirms Stage 2 transitions and validates Stage 4 breakdowns. Without it, you are trading hope.
Resistance-to-Support Flip Signals
One powerful structural signal in stan weinstein’s stage analysis is the resistance-to-support flip.
According to tradingsetupsreview, the resistance-to-support flip happens when a prior resistance level becomes new support after a breakout.
Example:
- Stock capped at $60 for 5 months
- Breaks above $60 with strong volume
- Pulls back to $60
- Holds and rallies again
That level flipped from resistance to support. This behaviour confirms Stage 2 strength.
If the price breaks $60 but quickly falls back below it, that is a false breakout. No flip occurred. Risk increases.
30-Week Moving Average Stage Analysis
The 30-week moving average stage analysis is the backbone of the entire model.
Stan Weinstein used the 30-week simple moving average as the major trend filter.
Here is how it works:
- Rising MA + price above = bullish structure (Stage 2)
- Flat MA + sideways price = transition (Stage 1 or 3)
- Falling MA + price below = bearish structure (Stage 4)
Warning:
If the 30-week moving average disagrees with your trade idea, your idea is probably wrong.
Applying Stage Analysis to Stocks
Understanding Stage Analysis is a theory. Applying it to real stocks is execution. The difference between average and disciplined traders lies in the process.
Picking Stocks Using Stage Analysis
Start with the broad market. If the overall index is in Stage 4, aggressive buying makes little sense.
Once the market is supportive, scan for stage analysis stocks showing:
- Price above a rising 30-week moving average
- Strong Relative Strength vs. the index
- Recent breakout or tight consolidation near highs
- Volume expansion on upward moves
Analysing Stock Charts with Stage Analysis
After screening, move to chart analysis.
Open a weekly chart and ask:
- Is the 30-week moving average rising, flat, or falling?
- Rising: The major trend is bullish. You should prioritise Stage 2 candidates and trend-following entries.
- Flat: The stock is likely transitioning (Stage 1 basing or Stage 3 topping). You need extra confirmation from RS and volume.
- Falling: The major trend is bearish. Treat it as Stage 4 until proven otherwise. Capital protection comes first.
- Rising: The major trend is bullish. You should prioritise Stage 2 candidates and trend-following entries.
- Is the price trading above or below the 30-week moving average?
- Above (and holding above): Bullish structure. Pullbacks that respect the average often signal healthy Stage 2 behaviour.
- Below (and failing to reclaim it): Bearish structure. Rallies into the moving average are often sell zones in Stage 4.
- Whipsawing around it: No clear edge. This is where impatient traders get chopped up. Wait for the structure to resolve.
- Above (and holding above): Bullish structure. Pullbacks that respect the average often signal healthy Stage 2 behaviour.
- Is Relative Strength leading the market or lagging it?
- Leading (outperforming the index): This is what institutional leadership looks like. It supports Stage 2 continuation and higher-quality breakouts.
- Lagging (underperforming the index): Even if the price is rising, the stock is not a leader. Breakouts are more likely to fail.
- Improving from weak to strong: Often a Stage 1-to-Stage 2 transition clue, especially if Mansfield RS moves toward/above zero.
- Leading (outperforming the index): This is what institutional leadership looks like. It supports Stage 2 continuation and higher-quality breakouts.
- Is volume confirming breakouts and trend continuation?
- Breakout with expanding volume: High-quality confirmation. It suggests real demand, not a random price pop.
- Breakout on weak volume: Suspicious. Often, a false move that snaps back into the range.
- Heavy volume on down weeks: Distribution risk (Stage 3) or bearish confirmation (Stage 4), depending on trend context.
- Volume contracting during consolidation: Healthy base behaviour (Stage 1), especially if selling pressure keeps fading.
- Breakout with expanding volume: High-quality confirmation. It suggests real demand, not a random price pop.
Table: Analysing Stock Charts with Stage Analysis
| Question (Weekly Chart) | Bullish Case | Neutral / Transition Case | Bearish Case |
|---|---|---|---|
| 30-week MA direction | Rising → Major trend is up (Stage 2 bias) | Flat → Likely Stage 1 basing or Stage 3 topping (need confirmation) | Falling → Major trend is down (Stage 4 bias) |
| Price vs. 30-week MA | Above and holding → Strong structure; pullbacks can be buyable | Choppy around MA → Whipsaw risk; edge is weak | Below and failing to reclaim → Weak structure; rallies often fail |
| Relative Strength vs. index | Leading → Institutional leadership; higher-quality breakouts | Improving → Possible Stage 1 → Stage 2 transition | Lagging → Low-quality trend; breakouts more likely to fail |
| Volume behaviour | Expands on breakouts / up moves → Confirms demand and continuation | Contracts in consolidation → Healthy basing (Stage 1) | Heavy on down weeks/breakdowns → Distribution (Stage 3) or decline (Stage 4) |
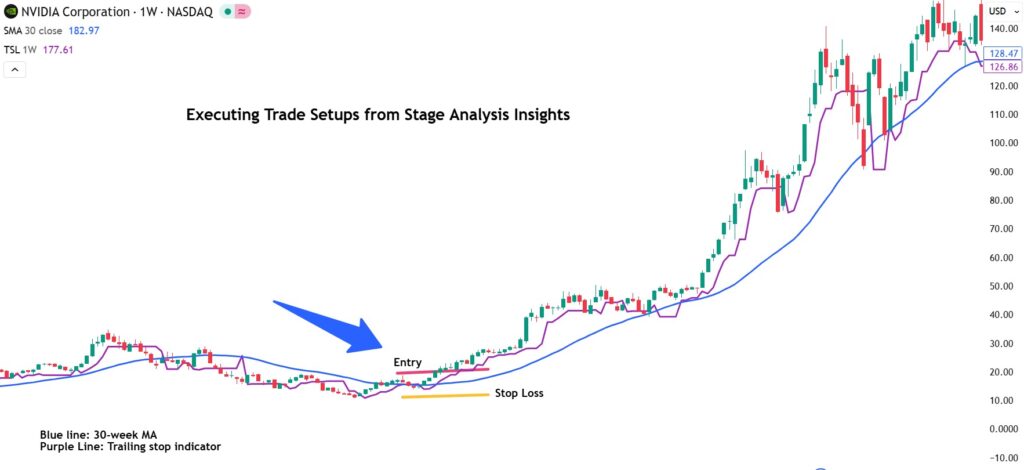
Executing Trade Setups from Stage Analysis Insights
Execution must be mechanical. A textbook Stage 2 breakout setup:
- Entry: Weekly close above key resistance.
- Stop loss placement: Below the breakout level.
- Risk per trade: 1–2% of total capital.
If price moves higher:
- Trail stop below higher lows.
- Watch for Stage 3 signs (flat MA, heavy down-volume weeks).
If the price falls back below the key resistance quickly:
- Accept the loss. Avoid emotional averaging down.
Advanced Stage Analysis Strategies
Basic Stage Analysis trading helps you identify trends. An advanced application helps you improve timing, reduce false signals, and align with institutional capital rotation.
Spotting Early Breakouts with Stage Analysis
The best trades often come at the transition from Stage 1 to Stage 2, not after a long rally.
Early breakout checklist:
- Tight consolidation (volatility contraction)
- 30-week MA flattening, then slightly rising
- Relative Strength improving before price breaks out
- Volume contraction inside the base
- Breakout with expansion in volume
Trader’s tip:
If you enter after the stock has already advanced 40–50%, risk increases, and reward decreases. The edge comes from preparation before the breakout.
Stop Loss & Whipsaw Protection Using Stage Analysis
Common rules for stop loss placement in the Weinstein stage analysis are as follows:
- Place a stop slightly below the breakout level.
- Or below the most recent higher low.
- Avoid placing stops directly at obvious round numbers.
Whipsaw protection techniques:
- Wait for weekly close confirmation, not intraday spikes.
- Avoid breakouts without volume confirmation.
- Do not buy extended moves far above the 30-week MA.
Multi-Timeframe Alignment for Stage Analysis
Multi-timeframe alignment improves timing while respecting the major trend filter.
Advanced traders align weekly and daily structures:
- The weekly chart defines the stage.
- The daily chart defines timing.
For example, this is a high-probability entry:
- The weekly chart shows confirmed Stage 2.
- Daily chart pulls back to prior resistance (now support).
- Daily volume decreases on a pullback.
Key insight:
If the weekly chart shows Stage 4 and the daily shows a small bounce, that bounce is counter-trend noise.
Sector & Market Rotation Strategies Using Stage Analysis
Capital does not flow randomly. It rotates between sectors. Strong stock market stage analysis starts at the index level.
The step-by-step approach is as follows:
- Identify the stage of the overall market index.
- Identify which sectors are in Stage 2.
- Select leading stocks inside those sectors.
For example:
- Broad market in Stage 2.
- The technology sector is outperforming.
- Energy sector in Stage 4.
You should avoid fighting rotation and focus on technology leaders with strong Relative Strength.
Conclusion
Stan Weinstein’s Stage Analysis is a practical framework for trading with the market’s real direction, not your opinions. It forces discipline by filtering trades through a clear cycle: base, advance, top, decline. The method works in 2026 for the same reason it worked decades ago—institutions still accumulate, mark up, distribute, and exit in identifiable patterns. If you consistently anchor your decisions to the 30-week moving average, confirm leadership with Relative Strength (Mansfield RS), and demand volume confirmation, you stop chasing random moves and start trading higher-probability trends. The edge is not complexity. The edge is refusing to trade when the stage is unclear.