Most retail traders glance at the volume histogram beneath their chart, see a tall bar or a short one, and move on. That approach ignores the single question volume is designed to answer: how much collective effort went into each directional move? The Weis Wave indicator reframes volume around price swings rather than time intervals, and in doing so, it exposes the supply-and-demand imbalances that conventional bar-by-bar volume conceals.
Developed by David Weis as a modern adaptation of Richard D. Wyckoff’s wave chart methodology, the indicator sums the cumulative volume within each price swing and displays it as a colour-coded histogram. When installed on MetaTrader 4, it gives forex and CFD traders a structured way to compare the effort behind buying waves against selling waves, identify exhaustion before a reversal prints, and confirm breakout strength in real time.
This guide explains exactly what the Weis Wave indicator measures, how to install and configure it on MT4, the core signal patterns it produces, and practical trading strategies for applying wave volume analysis to currency pairs and gold.
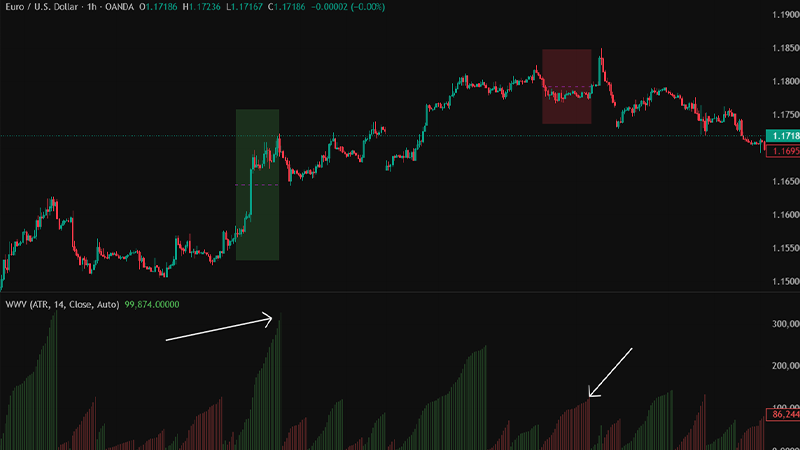
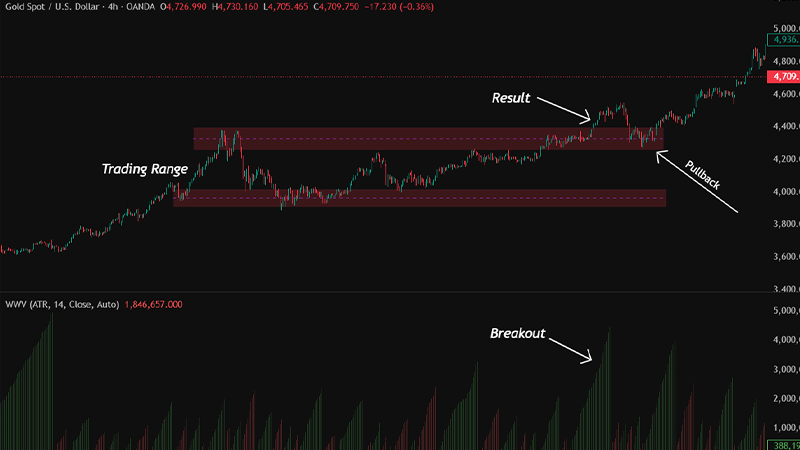
The Weis Wave indicator calculates cumulative volume per price swing, not per candle, revealing the true effort behind each directional move.
It is rooted in Wyckoff's wave chart method and adapted by David Weis for modern electronic markets.
Core signals include effort vs result divergence, shortening of the thrust, and volume-confirmed accumulation or distribution.
On MT4, the indicator uses tick volume, which correlates well with real exchange volume for liquid forex pairs.
The Speed Index feature measures the rate of volume change within each wave, adding a momentum dimension to the analysis.
Weis Wave analysis pairs effectively with price action, order flow, and market structure tools for higher-probability setups.
What Is the Weis Wave Indicator?
The Weis Wave indicator is a technical analysis tool that groups price action into alternating upward and downward swings and then calculates the total volume traded within each swing. Rather than showing volume bar by bar, it aggregates the volume of every candle that belongs to the same directional wave and plots the result as a histogram beneath the chart. Green bars typically represent buying-wave volume; red bars represent selling-wave volume.
Risk Disclosure
CFDs are complex instruments and come with a high risk of losing money rapidly due to leverage. You should consider whether you understand how CFDs work and whether you can afford to take the high risk of losing your money. Past performance is not indicative of future results. This content is provided for educational purposes only and does not constitute investment advice.
Origins in Wyckoff Wave Theory
Richard D. Wyckoff instructed his students to think in waves. He argued that price unfolds in sequences of buying and selling thrusts, and that comparing the volume and progress of successive waves reveals whether supply or demand is dominant. David Weis, a Wyckoff method analyst, translated this principle into software. His plugin, described in the book Trades About to Happen, automates the construction of wave charts and overlays cumulative volume, making Wyckoff-style analysis accessible on modern platforms including MetaTrader 4.
How Cumulative Wave Volume Differs from Standard Volume
Standard volume indicators assign each bar’s volume to the time period in which it occurs. A five-minute chart shows five minutes of volume per bar regardless of whether price moved one pip or fifty. The Weis Wave, by contrast, accumulates volume across every bar within the same directional swing. This means a wave lasting seven candles shows one composite volume reading, and the next wave in the opposite direction starts its own accumulation from zero.
The practical benefit is clarity. Instead of scanning dozens of individual volume bars, the trader sees two numbers side by side: the effort behind the most recent up-wave and the effort behind the preceding down-wave. That direct comparison is the foundation of every Weis Wave signal.
Read More: How to Make Better Decisions Through Volume Analysis
How the Weis Wave Indicator MT4 Works
Understanding the mechanics behind wave construction is essential for interpreting signals correctly. The indicator relies on three interrelated components: a reversal threshold, cumulative volume summation, and an optional speed measurement.
Wave Construction and Reversal Logic
The indicator tracks the current price direction and continues building the active wave until price reverses by a specified number of points. This reversal threshold is often labelled Difference or Dif in the indicator settings, and it is expressed in points (pips multiplied by ten on five-digit brokers). Once price exceeds the threshold against the current wave, the indicator closes that wave’s volume bar and begins accumulating a new bar in the opposite direction.
A higher Difference value produces fewer, larger waves that filter out minor retracements. A lower value creates more frequent waves that capture smaller swings. Selecting the right threshold depends on the instrument’s volatility and the trader’s timeframe.
The Speed Index Feature
Several versions of the Weis Wave indicator include a Speed Index, which divides the cumulative volume of a wave by the number of bars it spans. The result measures how quickly volume was absorbed during the move. A high Speed Index on a buying wave suggests aggressive demand; a low Speed Index on a selling wave implies half-hearted distribution. Comparing Speed Index values across successive waves adds a momentum filter that raw volume alone does not provide.
Key Parameters and Settings
The following parameters appear in most MT4 implementations of the Weis Wave indicator:
Difference / Dif: The minimum point movement required for a wave reversal. Start with a value close to the instrument’s average candle range on your chosen timeframe and adjust from there.
AutoDifference: When enabled, the indicator calculates the reversal threshold automatically based on recent volatility, often using ATR as a proxy.
Wave Type: Some versions offer multiple display modes including regular volume, pips (price distance), time, and progressive volume rate. Regular volume is the standard Wyckoff application.
Speed Index Display: Toggle for showing or hiding the Speed Index alongside the volume histogram.
Installing the Weis Wave Indicator on MT4
The Weis Wave is not included in MetaTrader 4 by default. Free versions are available on community forums such as Forex Factory and MQL5; paid versions with advanced features like Plutus pattern alerts can be purchased from the developer’s website or the MQL5 marketplace.
Step-by-Step Installation
The process follows the standard custom indicator workflow on MT4:
- Download the .ex4 or .mq4 file from your chosen source.
- Open MetaTrader 4 and navigate to File, then Open Data Folder.
- Inside the data folder, open MQL4, then Indicators, and paste the downloaded file.
- Restart MetaTrader 4 or right-click the Navigator panel and select Refresh.
- Drag the Weis Wave indicator from the Navigator onto any chart. The histogram will appear in a sub-window beneath the price chart.
Configuring the Difference Parameter
For major forex pairs on the H1 timeframe, a Difference value between 50 and 100 points typically produces clean, readable waves. On gold (XAUUSD), where daily ranges are wider, values between 200 and 500 points often work better. If the AutoDifference feature is available, enable it first and observe whether the generated waves match the visible swing structure before switching to a manual setting.
Trading Tip
After installing the indicator, open a historical chart and scroll back several weeks. Compare the wave volume readings at major turning points with the price action at those same points. This exercise builds pattern recognition before any capital is risked.
Reading Weis Wave Signals
The Weis Wave indicator produces three primary signal categories, each rooted in the Wyckoff principle that volume represents effort and price movement represents result. When effort and result do not align, the market is telegraphing a potential change in direction.
Effort vs Result Analysis
This is the core Wyckoff concept adapted into wave form. If a buying wave consumes significantly more volume than the previous buying wave yet price advances by a smaller distance, the effort was large but the result was poor. That imbalance suggests sellers are absorbing the demand, and a reversal or at least a stall becomes probable. The same logic applies in reverse: a selling wave with heavy volume but shallow price decline signals that buyers are stepping in.
Shortening of the Thrust
When successive waves in the same direction produce progressively smaller price advances while volume remains steady or increases, the pattern is called shortening of the thrust. Each thrust covers less ground, indicating that the dominant side is losing its ability to push price further. This pattern frequently precedes trend reversals and is visible on the Weis Wave histogram as a series of roughly equal or growing volume bars paired with diminishing price progress on the chart.
Identifying Accumulation and Distribution
In a sideways range, the Weis Wave can reveal whether large participants are accumulating or distributing. During accumulation, down-waves inside the range tend to show declining volume while up-waves show steady or increasing volume. The final wave that breaks out of the range typically carries the largest cumulative volume of the entire consolidation. During distribution, the pattern inverts: up-waves weaken and the breakdown wave arrives on heavy volume.
Q: Does the Weis Wave work with tick volume on MT4? A: Yes. Although MT4 reports tick volume rather than actual exchange volume, research and practitioner experience consistently show that tick volume correlates closely with real volume on liquid forex pairs. David Weis himself acknowledged that for assets lacking exchange volume, substituting true range or tick data still captures meaningful shifts in participation. |
Weis Wave Trading Strategies for Forex
Wave volume analysis provides context rather than mechanical buy or sell signals. The strategies below combine Weis Wave readings with price action and market structure for higher-probability setups.
Trend Confirmation with Wave Volume
In a confirmed uptrend, buying waves should consistently show larger cumulative volume than selling waves. If a pullback occurs on noticeably lighter volume than the preceding impulse, the trend remains healthy and the pullback may offer a continuation entry. Conversely, if a pullback wave matches or exceeds the impulse wave in volume, the trend’s integrity is in question and the trader should wait for further confirmation before adding positions.
Divergence-Based Reversal Entries
A bearish divergence forms when price prints a higher high but the corresponding buying wave’s cumulative volume is lower than the previous buying wave at the prior high. This signals diminishing demand. A bullish divergence forms when price prints a lower low but the selling wave volume is smaller than the previous selling wave at the prior low. In both cases, the divergence is more reliable when it occurs at a known support, resistance, or liquidity level.
Mini Example: XAUUSD Reversal on the H1 Chart
- Gold rallies from 2 320 to 2 345 on a buying wave of 48 000 ticks.
- A shallow pullback to 2 338 forms a selling wave of only 18 000 ticks, confirming weak supply.
- A second rally targets 2 352 but the buying wave registers only 29 000 ticks, well below the first wave’s effort.
- Price stalls and prints a bearish engulfing candle at the high. The effort vs result divergence flags the setup.
- A short entry below 2 348 with a stop above 2 354 targets the previous swing low near 2 320.
Q: Can the Weis Wave indicator generate automated trading signals? A: The standard Weis Wave indicator is interpretive, not mechanical. It does not produce automatic buy or sell arrows. Some premium versions include pattern-recognition alerts (such as Plutus patterns), but even those require the trader to confirm the setup with price action context before executing. |
Read More: What Is a Market Cycle in Trading?
Weis Wave Indicator vs Traditional Volume Indicators
Traders often ask how wave volume compares to the tools already available on MT4. The following table highlights the key structural differences.
| Weis Wave Indicator | Standard Volume / OBV |
|---|---|
| Aggregates volume per price swing | Displays volume per time-based candle |
| Shows cumulative effort behind each directional move | Shows bar-by-bar activity or a running total |
| Facilitates direct wave-to-wave effort comparison | Requires manual visual comparison across many bars |
| Includes optional Speed Index for momentum | No built-in momentum layer on raw volume |
| Requires custom installation on MT4 | Built into MetaTrader by default |
| Interpretive, no automatic signals | OBV can be coded into mechanical systems more easily |
Limitations and Practical Considerations
No indicator operates without constraints, and the Weis Wave is no exception. Recognising its limitations is as important as understanding its strengths.
Tick Volume vs Real Volume in Forex
MetaTrader 4 provides tick volume, which counts price changes rather than actual contracts traded. On highly liquid pairs such as EURUSD during the London or New York session, tick volume tracks real volume closely enough for wave analysis to remain valid. On exotic pairs or during low-liquidity hours, the correlation weakens and wave readings may overstate or understate true participation.
Repainting on the Latest Wave
The most recent wave is still being constructed, so its volume bar updates with every new tick. This is not a flaw; it is inherent to the cumulative calculation. However, traders should base decisions on completed waves rather than the live, in-progress bar. Only once price reverses by the Difference threshold is the previous wave’s volume finalised and reliable for analysis.
Key Point
The Weis Wave is a reading tool, not a signal generator. It tells you the strength behind a move but not when to press the button. Pairing it with market structure, supply and demand zones, or ICT concepts like order blocks and fair value gaps provides the execution framework that wave volume alone does not supply.
Conclusion
The Weis Wave indicator translates one of the oldest principles in technical analysis, that volume reveals the conviction behind price, into a format that modern MT4 traders can apply on any instrument and any timeframe. By aggregating volume into directional waves, it simplifies the comparison between buying effort and selling effort, making patterns like effort vs result divergence and shortening of the thrust visible at a glance.
Installing it on MetaTrader 4 is straightforward, but extracting consistent value from it requires practice. Spend time on historical charts, calibrate the Difference parameter to your instrument, and always confirm wave volume signals with price structure before committing capital.