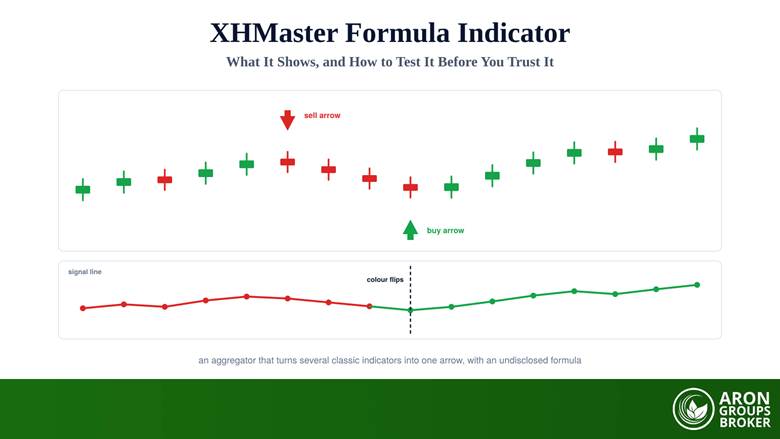

The XHMaster Formula indicator is a custom, arrow-based trend and momentum tool for MetaTrader 4, MetaTrader 5, and TradingView. It combines several classic indicators, commonly listed as moving averages, MACD, RSI, Stochastic, and Parabolic SAR, into two simple visual cues: a colour-coded line or dots showing the current momentum regime, and green or red arrows marking potential buy and sell points.
Its popularity is easy to explain. Instead of stacking five oscillators on one chart and squinting at them, you get one signal. That convenience is real, and so is the catch: the tool aggregates lagging inputs behind a formula its publisher does not disclose, which means the only responsible way to judge it is by how it behaves on your own charts. This guide treats it that way, as a candidate input to a trading edge rather than a finished system.
Below: what the signals mean, the Xmaster and XHMaster naming confusion, what is genuinely known about the calculation, the repaint test that matters more than any other check, installation on both platforms, the higher-timeframe filter that removes most losing arrows, safe download practice, and an honest account of the limitations.
- XHMaster Formula is an arrow-based aggregator: green arrow for buy, red for sell, with a colour-coded line showing the current momentum regime.
- Its exact calculation is proprietary and undisclosed, so published component lists vary between sources and should be treated as claims rather than specifications.
- The single most important check is repainting: a signal printed on a closed candle must never move or vanish afterwards.
- Taking arrows only in the direction of the higher-timeframe trend removes most of the whipsaw losses that come from trading every signal.
- Download only from your platform's official marketplace or the developer's own page; indicator files are executable code.
What Is the XHMaster Formula Indicator?
It is a custom indicator, meaning a third-party file you install rather than a tool built into your platform, designed to compress several standard technical readings into one visual output. The original Xmaster Formula appeared in the early 2010s and is commonly attributed to the developer TradingFinder, spreading widely through free download sites and forums because it is easy to read and costs nothing in most versions. It plots on forex, metals, indices, and crypto charts, and works across timeframes, though intraday charts are where most users apply it.
Risk Disclosure
CFDs are complex instruments and come with a high risk of losing money rapidly due to leverage. You should consider whether you understand how CFDs work and whether you can afford to take the high risk of losing your money. Past performance is not indicative of future results. This content is provided for educational purposes only and does not constitute investment advice.
Xmaster or XHMaster: Are They Different Tools?
Treat the two names as the same family. Some sources describe XHMaster as a later, refined version of Xmaster with added noise-reduction filtering and broader platform coverage, while the developer side has separately noted that XHMaster is also a very common mistyping of Xmaster when people search for it. Both accounts circulate, versions have been rebranded and re-uploaded countless times, and in practice traders use the names interchangeably. The honest conclusion is that the name on the file tells you very little; only testing the specific file you downloaded tells you anything reliable.
How to Read Its Signals
The visual language is deliberately simple, which is the whole selling point. A green upward arrow marks a potential buy and a red downward arrow a potential sell. The line or dot series carries the regime: green for bullish momentum, red for bearish, and the moment the colour changes is the indicator flagging a possible turning point. Many versions also highlight overbought and oversold conditions, inherited from the oscillator components inside it. Display details vary between versions, with some plotting arrows directly on price and others putting the signal line in a separate pane beneath the chart.
What Is Actually Under the Hood
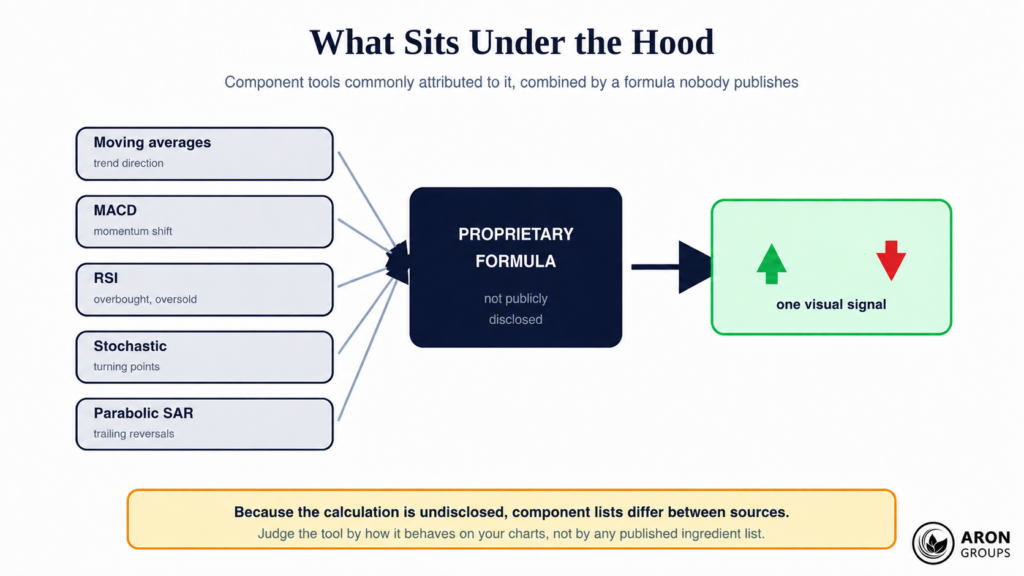
The indicator works as an aggregator: it plots an arrow when its internal components agree, which is why its signals feel decisive compared with reading five tools separately. The components most often listed are moving averages for direction, MACD for momentum shifts, RSI and Stochastic for stretched conditions, and Parabolic SAR for trailing reversals. Some descriptions also mention Bollinger Bands.
Several familiar inputs, one output, and a formula in between that nobody publishes.
Here is the honest part, and it is the reason this article exists in the form it does: the exact calculation is proprietary and has never been publicly disclosed. That has a consequence worth sitting with. Different sources publish different component lists and different parameter settings for what is supposedly the same indicator, and some of those published formulas do not survive scrutiny as descriptions of the tools they name. When the specification is secret, every ingredient list is a claim rather than a fact, so the only meaningful evidence is behaviour on a live chart.
Rule: Treat every performance claim about this indicator as a hypothesis with a test attached. Accuracy percentages, non-repainting guarantees, and win-rate screenshots are marketing until you have reproduced them yourself on the exact file you installed. |
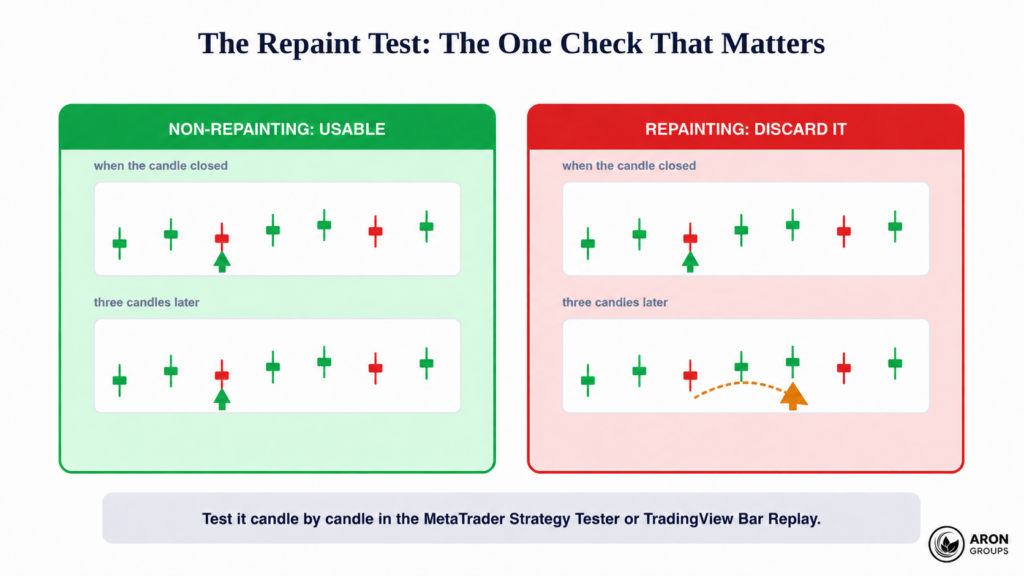
The Repaint Test
Repainting is when an indicator changes its historical signals after the fact. A repainting arrow appears, price moves, and the arrow quietly relocates or disappears, leaving a chart history that looks flawless and a live experience that does not. It is the single most important thing to verify, because a repainting tool makes every backtest and every screenshot meaningless. The standard is simple: a signal printed on a closed candle must stay exactly where it printed, permanently.
The same signal, three candles later: if it moved, the history you were shown never existed.
Step 1: Open a Visual Replay
In MetaTrader, run the Strategy Tester in visual mode with the indicator attached. On TradingView, use Bar Replay. Both let you move forward one candle at a time.
Step 2: Note Every Signal As It Prints
Step forward candle by candle and record the exact candle and price where each arrow appears. Do not rely on memory; write them down or screenshot them.
Step 3: Compare After Several Candles
Continue forward, then check your earlier notes against the chart. Any signal that has moved, vanished, or appeared retroactively means the version repaints.
Step 4: Discard or Accept, Then Forward-Test
If it repaints, delete that file and find another version. If it holds, forward-test it on a demo before it earns any real capital.
Q: Some sources say this indicator does not repaint. Is that settled?
A: Not for your copy. Non-repainting is claimed for the original, but the indicator has been copied, modified, and re-uploaded for over a decade, so behaviour varies file to file. The claim applies to a specific build; the test applies to yours.
Installing It on MetaTrader and TradingView
Installation differs by platform, and neither takes long. The MetaTrader route involves the data folder; the TradingView route is a search box. Follow whichever matches your setup, then apply it to a demo chart before anything else.
Step 1: MetaTrader: Open the Data Folder
With the terminal open, choose File, then Open Data Folder. This opens the directory MetaTrader actually reads from, which is not always where you expect it to be.
Step 2: MetaTrader: Copy the File In
Open the MQL4 or MQL5 folder depending on your version, then the Indicators subfolder, and copy the indicator file into it. Restart the terminal so it is registered.
Step 3: MetaTrader: Drag It From the Navigator
Find it in the Navigator panel under Indicators and drag it onto a chart. Its inputs appear in the settings dialogue, where colours and any sensitivity options can be adjusted.
Step 4: TradingView: Search the Indicators Panel
Open the Indicators panel and search by name. Community scripts with this name vary in quality, so prefer ones whose source you can open and inspect.
The Filter That Makes It Usable
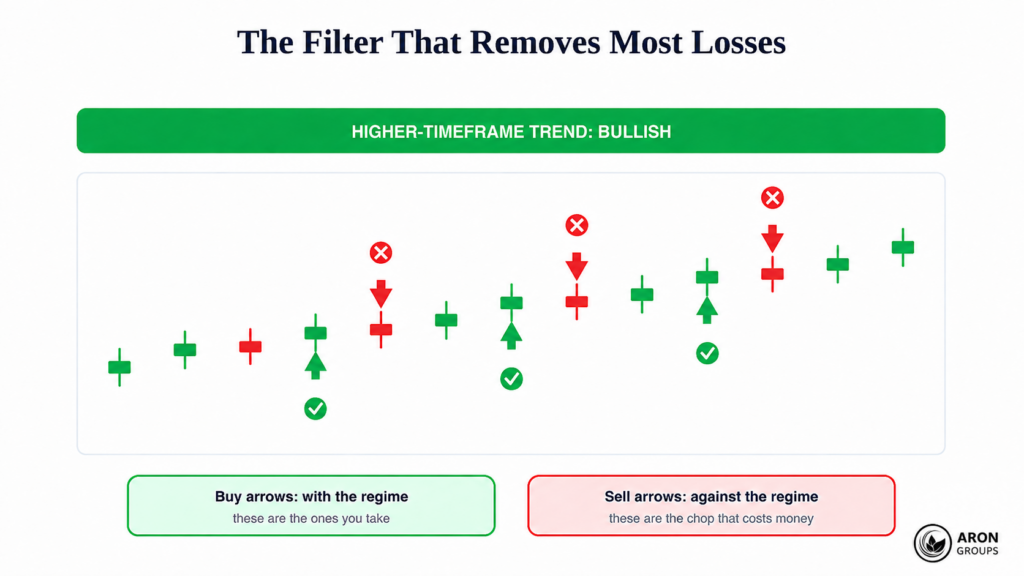
Traded naively, an arrow indicator produces its worst results in exactly the conditions it appears most confident: ranging markets, where momentum flips repeatedly and every flip prints a signal. One filter fixes most of that. Establish the trend on a higher timeframe, then take only the arrows pointing in that direction and ignore the rest. In a bullish four-hour regime you take buy arrows on the fifteen-minute chart and skip every sell arrow, and the reverse in a bearish one. The discarded signals are where most of the chop losses live.
Same indicator, same chart: the higher-timeframe regime decides which arrows are worth taking.
Two more layers make it a method rather than a reflex. Confirm the arrow against price structure, so a buy signal into obvious resistance is skipped regardless of colour, and use volatility context such as Keltner Bands to avoid entries where the move has already stretched. Then size every position from the stop distance using deliberate position sizing, and require a defined risk-to-reward ratio before entry rather than after it.
Mini Example: Two Weeks, Two Approaches
A trader takes every arrow on a fifteen-minute gold chart. During a two-day range the indicator prints eleven signals as momentum flips back and forth; most are stopped out within an hour, and the spread and commission bill lands on all eleven.
The same trader, filtering by a bullish four-hour trend, takes three of those eleven and skips the rest. The three are not magically profitable, but they share a direction, they can be managed to a planned target, and eight losing tickets never existed. The filter did not improve the indicator; it removed the trades where the indicator had nothing useful to say.
Marketing Claims and How to Check Them
Because the formula is closed, this indicator attracts more claims than most. Each one can be converted into a test you can run in an afternoon, which is a far better use of time than arguing about it.
| Common claim | What it would mean | How to check it yourself |
|---|---|---|
| Never repaints | Closed-candle signals are permanent | Strategy Tester visual mode or Bar Replay, candle by candle |
| High accuracy percentage | A stable win rate across conditions | Forward-test on demo across trending and ranging weeks |
| Works on all timeframes | Comparable behaviour at every scale | Run it on three timeframes and compare signal quality |
| Combines five indicators | A specific documented calculation | Unverifiable while the formula stays undisclosed |
| Profitable on its own | A complete system | Compare filtered against unfiltered results over months |
Every claim converts into a test; treat any claim you cannot test as decoration.
Downloading It Safely
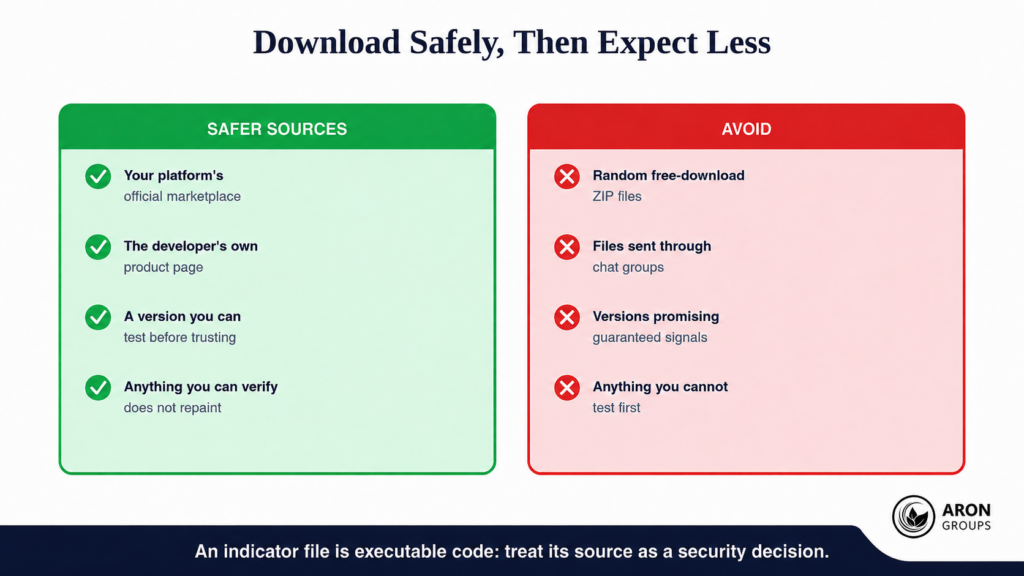
One point deserves more weight than it usually gets: an indicator file is executable code running inside the platform connected to your trading account. Download only from your platform’s official marketplace inside the terminal or from the developer’s own product page. Avoid random free-download archives, files circulated in chat groups, and any version whose promotion promises guaranteed signals, since tampered files are a real distribution channel and the promise itself is a warning sign. Regulators’ advisories on retail forex trading make the general point plainly: knowing exactly who you are dealing with is a trader’s first line of defence, and that applies to software as much as to counterparties.
Where the file comes from is a security decision, not a convenience one.
Honest Limitations
Three limits are structural rather than fixable. It is lagging by construction, because every component inside it is calculated from past prices, so it describes what has happened rather than what will. It produces false arrows in ranging markets, which is where most retail trading time is actually spent. And it is not a system: it has no position sizing, no exit logic beyond the next opposing signal, and no awareness of context. Without a higher-timeframe filter and strict risk management it flatters a backtest and disappoints in live trading, which is the standard biography of arrow indicators.
Keep the base rates in view while evaluating any tool that promises simplicity. European regulators found the large majority of retail accounts lose money on leveraged products, and investor-education guidance on leveraged strategies is blunt that amplified exposure amplifies every false signal. An indicator changes what you look at; it does not change that arithmetic, which is why the honest test is a systematic one run over months rather than a screenshot.
Testing It With Aron Groups
The sensible sequence costs nothing. Install the indicator on the MetaTrader 5 platform at Aron Groups, run the repaint test in the Strategy Tester, and if it passes, forward-test it on a demo account for a few weeks with the higher-timeframe filter applied and every trade logged.
Only then consider live trading, and preferably on a small account where micro volumes keep the verdict affordable. Judge it the way out-of-sample backtesting judges anything, on a stable equity curve across many trades, and remember that the mechanics in our guide on how to trade forex matter more than any arrow drawn on top of them.
Conclusion
The XHMaster Formula indicator does one thing well: it turns several familiar readings into a signal a beginner can act on without a chart full of oscillators. That clarity is genuine value. What it does not provide is an edge on its own, and the undisclosed formula means nobody can tell you precisely why an arrow appeared, only that its internal components agreed.
So use it the way you would use any unverified tool: test whether your copy repaints, take arrows only with the higher-timeframe trend, confirm against structure, size by rule, and download only from sources you can name. Do that and it becomes a reasonable filter in a larger process. Skip it and, as with every arrow indicator before it, the chart looks perfect in hindsight while capital preservation quietly becomes somebody else’s problem, which is the difference a professional trader‘s process makes.
Frequently Asked Questions
Quick answers to the questions traders ask most about the XHMaster Formula indicator.
What is the XHMaster Formula indicator?
It is a custom arrow-based trend and momentum indicator for MT4, MT5, and TradingView that combines several classic tools, commonly listed as moving averages, MACD, RSI, Stochastic, and Parabolic SAR, into green buy arrows, red sell arrows, and a colour-coded momentum line.
Does the XHMaster Formula indicator repaint?
It depends entirely on the version you downloaded. Non-repainting is claimed for the original, but the file has been copied and modified for over a decade. Test yours candle by candle in the MetaTrader Strategy Tester or TradingView Bar Replay before trusting any signal.
Where can I download it safely?
Use your platform’s official marketplace from inside the terminal, or the developer’s own product page. Avoid random free-download archives and files shared through chat groups, because indicator files are executable code and tampered versions circulate widely.
Is the XHMaster Formula indicator profitable on its own?
No indicator is. It is a lagging aggregator that produces false signals in ranging markets and has no position sizing or exit logic. Used with a higher-timeframe trend filter, structural confirmation, and strict risk limits, it can be a useful filter; used alone, it is just another arrow tool.