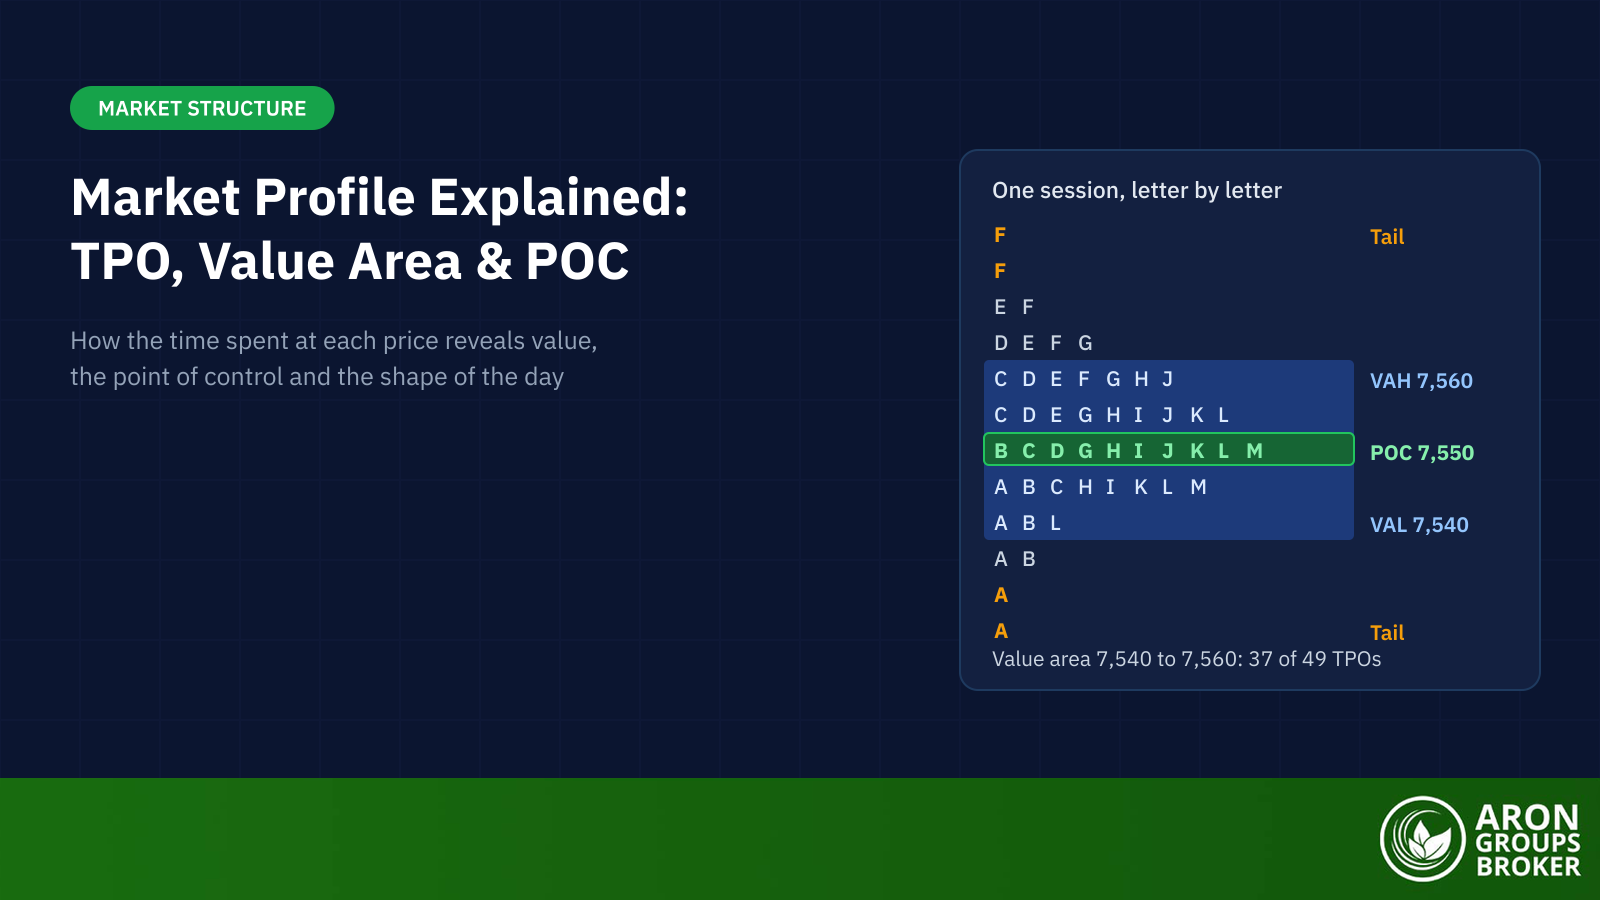

Market Profile is a charting method that organises a trading session by how much time the market spends at each price. Each 30-minute period prints a letter, called a TPO, at every price it trades, and the stacked letters form a sideways bell curve. The fat middle shows value; the thin ends show rejected prices.
It matters now because a profile depends on how you define the trading day, and the day is stretching. Nasdaq and NYSE Arca plan to add a 21:00 to 04:00 New York session for US stocks from 6 December 2026, leaving a one-hour pause each weekday. Futures are busier as well: CME Group’s equity index contracts averaged 7.7 million a day in Q3 2026, up 23% on a year earlier.
This guide builds a TPO chart and works out the point of control and value area. It then reads profile shapes and compares Market Profile with volume profile.
- Market Profile records time at price: each 30-minute period prints a letter, called a TPO, at every price it trades, and the stacked letters form a sideways bell curve.
- J. Peter Steidlmayer initiated Market Profile and the Liquidity Data Bank while on the Chicago Board of Trade's board from 1981 to 1983, and the exchange put both online in 1985.
- The point of control is the price with the most TPOs, and the value area is the band around it holding about 70% of them, a convention close to the 68.27% inside one standard deviation.
- In this guide's worked example, 49 TPOs set a target of 34.3, and two steps give a value area from 7,540 to 7,560 that holds 37 TPOs, or 75.5%.
- Market Profile needs only price and time, so it works on forex and CFD prices, while a volume profile on spot forex relies on tick volume, a count of price changes rather than traded size.
What Is Market Profile?
Market Profile reads a market as an auction by recording how long it trades at each price. Rather than bars or candles, a Market Profile chart builds a distribution of time at price for one session. The busiest prices show where buyers and sellers agreed on value. It is unrelated to marketing’s target market profiles.
Risk Disclosure
Trading forex and CFDs carries a high level of risk and can result in the loss of all your capital. This content is educational and is not investment advice. Never risk money you cannot afford to lose.
From the Chicago Board of Trade to Mind Over Markets
J. Peter Steidlmayer, a Chicago Board of Trade (CBOT) member since 1963, initiated Market Profile while on the exchange’s board from 1981 to 1983. He also initiated the Liquidity Data Bank, a record of the volume traded at each price. Both went online at the CBOT in 1985, though some accounts date the first public manual to 1984.
James Dalton, Eric Jones and Robert Dalton turned the idea into a trading framework in Mind Over Markets, first published in 1990. Its day types and open types remain the standard vocabulary.
How a TPO Chart Is Built
A TPO chart is the letter-based form of Market Profile, and TPO stands for time price opportunity. The CBOT’s study guide defines it as an opportunity the market creates at a certain time and price. One TPO is one 30-minute period trading at one price.
Letters, Brackets and the Trading Session
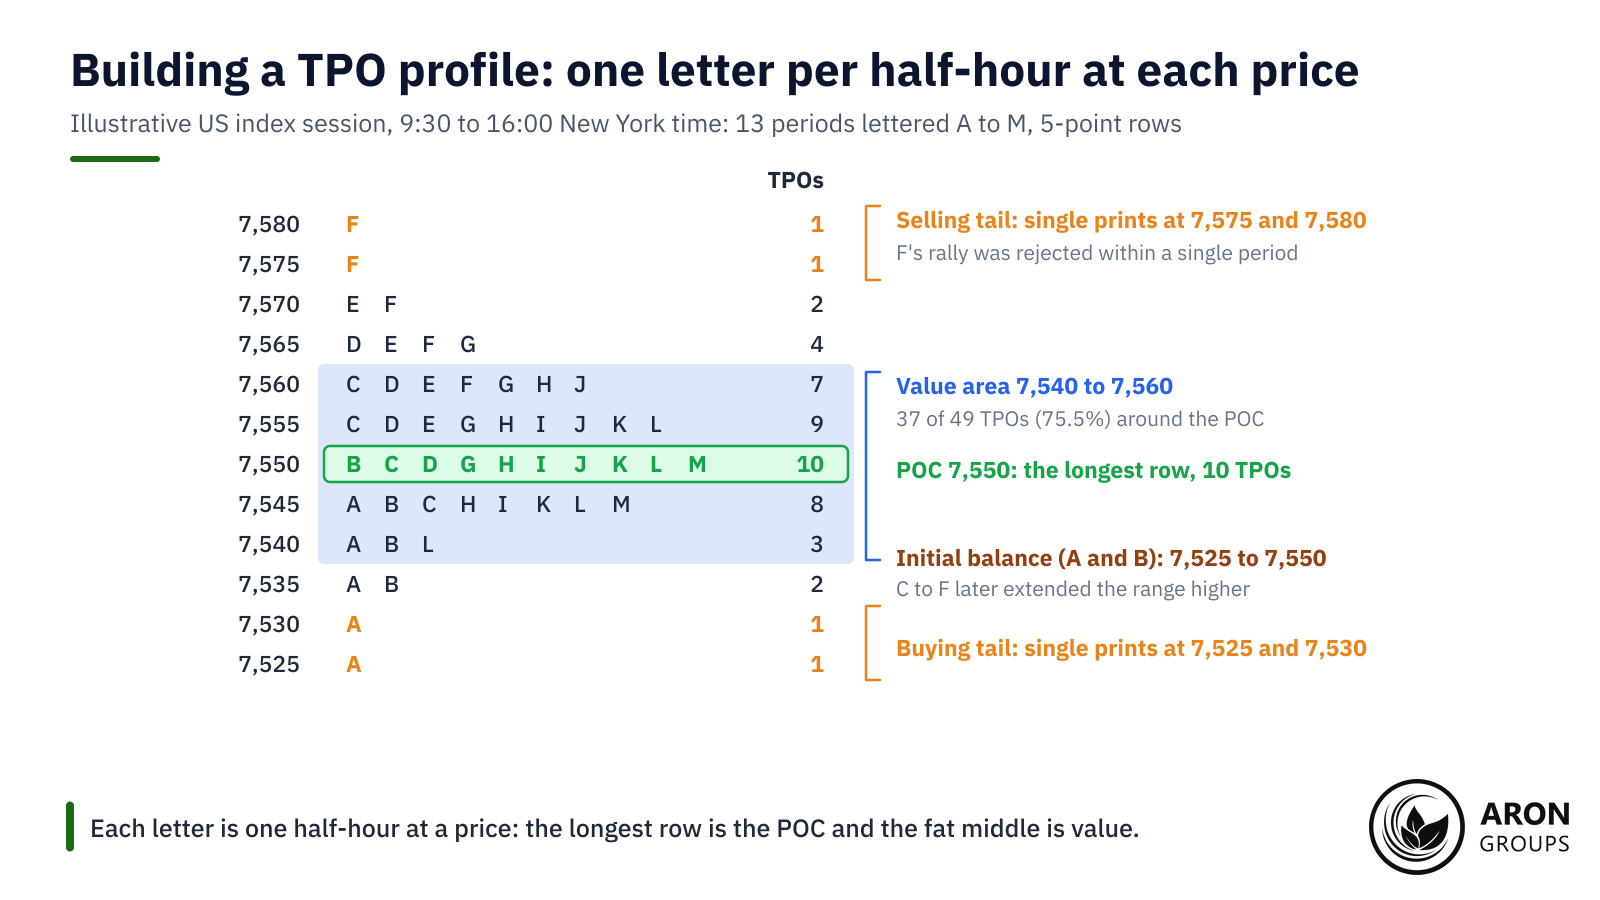
Each 30-minute period, or bracket, gets a letter, printed at every price it touched. Software usually labels the first period A, the next B, and so on. A US index profile on regular trading hours (RTH), 9:30 to 16:00 New York time, has 13 periods, A to M.
Letters stack left to right in time order, so a row’s length shows how many periods traded there. From January 1990 the CBOT tied letters to the clock instead: A to X for the half-hours before noon, a to x after it.
The Initial Balance and Range Extension
The initial balance is the first hour’s range, the A and B periods on a US index profile. The CBOT described it as the time short-term traders need to find two-sided trade. Later trade beyond it is range extension, read as a sign that longer-term traders have stepped in.
Single Prints, Tails and Poor Highs
A single print is a price with only one TPO, where the market moved quickly. Two or more single prints at the top or bottom form a tail, which marks excess: the auction went too far and was rejected. The CBOT’s guide says it takes at least two to show that longer-term traders competed at an extreme.
Single prints mid-profile mean a fast move between two areas of value instead. A poor high or low has no tail: several letters print at the extreme, which traders read as an unfinished auction.
The Point of Control and the Value Area
The point of control (POC) is the price with the most TPOs, the longest row. If two rows tie, the CBOT picks the one nearer the middle of the range; if both are equally near, Sierra Chart takes the lower. In balance, the POC is the session’s fairest price and a magnet for rotations.
The value area is the band around the POC holding about 70% of TPOs, bounded by the value area high (VAH) and low (VAL). Prices inside it were accepted; prices outside were tested and mostly rejected.
How the Value Area Is Calculated
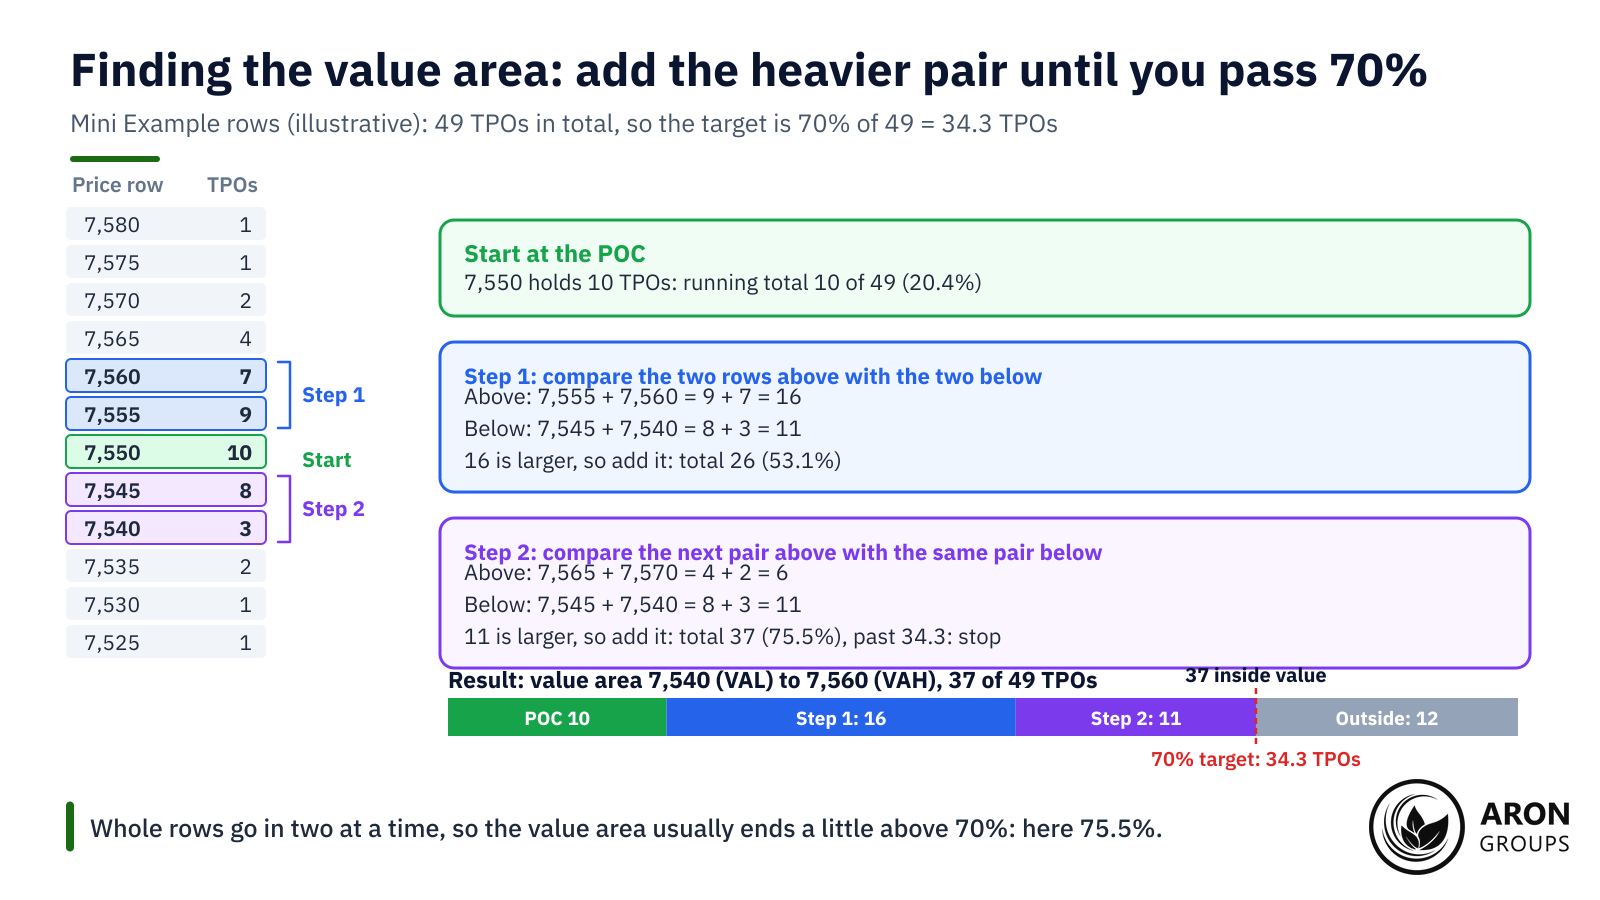
The classic method, from the CBOT and Mind Over Markets, starts at the POC and compares the two rows above with the two below. Add the heavier pair and repeat until the total reaches 70% of all TPOs. Whole rows go in two at a time, so the result usually lands slightly above 70%. The rule was written for volume: the CBOT applied it to Liquidity Data Bank volume, and Mind Over Markets uses TPOs when volume is missing.
Mini Example: Finding the Value Area in an Illustrative Session
Take an illustrative US index session on 5-point rows, lettered A to M. It holds 49 TPOs, so the 70% target is 34.3, and the longest row, 7,550 with 10 TPOs, is the POC.
| Price row | Letters | TPOs | Role in the profile |
|---|---|---|---|
| 7,580 | F | 1 | Selling tail |
| 7,575 | F | 1 | Selling tail |
| 7,570 | E F | 2 | Outside value |
| 7,565 | D E F G | 4 | Outside value |
| 7,560 | C D E F G H J | 7 | Value area high (step 1) |
| 7,555 | C D E G H I J K L | 9 | Value (step 1) |
| 7,550 | B C D G H I J K L M | 10 | Point of control |
| 7,545 | A B C H I K L M | 8 | Value (step 2) |
| 7,540 | A B L | 3 | Value area low (step 2) |
| 7,535 | A B | 2 | Outside value |
| 7,530 | A | 1 | Buying tail |
| 7,525 | A | 1 | Buying tail |
| Total | 13 periods, A to M | 49 | Target: 70% of 49 = 34.3 |
The illustrative session row by row: 49 TPOs, a POC at 7,550 and value from 7,540 to 7,560.
Step 1: start from the POC’s 10 TPOs. The two rows above hold 9 + 7 = 16 and the two below 8 + 3 = 11. Add the 16 for a running total of 26, or 53.1%.
Step 2: the next pair above holds only 4 + 2 = 6, against 11 below. Add the 11 for 37, or 75.5%, which passes 34.3, so you stop: the value area runs from 7,540 to 7,560.
Why 70% Is a Convention
The 70% echoes the normal distribution, where 68.27% of observations fall within one standard deviation of the mean, according to the NIST statistics handbook. TPOs are not normally distributed and no curve is fitted to them, so 70% is a rounded convention, not a measured statistic.
Auction Market Theory: The Idea Behind the Profile
Market Profile rests on auction market theory: a market is a two-way auction searching for the price that brings the most trade. The CFTC’s glossary defines price discovery as finding a price through the interaction of buyers and sellers. The profile draws that process one half-hour at a time.
Balance and Imbalance
In balance, the market rotates around a fair price and the profile grows a fat D-shape. News or new money tips it into imbalance, and price travels to find the other side. It then builds new value or is rejected and returns. Spotting the state is the profile’s way of reading the market regime.
Initiative and Responsive Activity
Buying above value or selling below it is initiative activity, from traders who think value is moving. Buying below value or selling above it is responsive activity, fading a move back to value. Tails usually show responsive traders, while range extension on initiative trade is how trends start.
Profile Shapes and Day Types
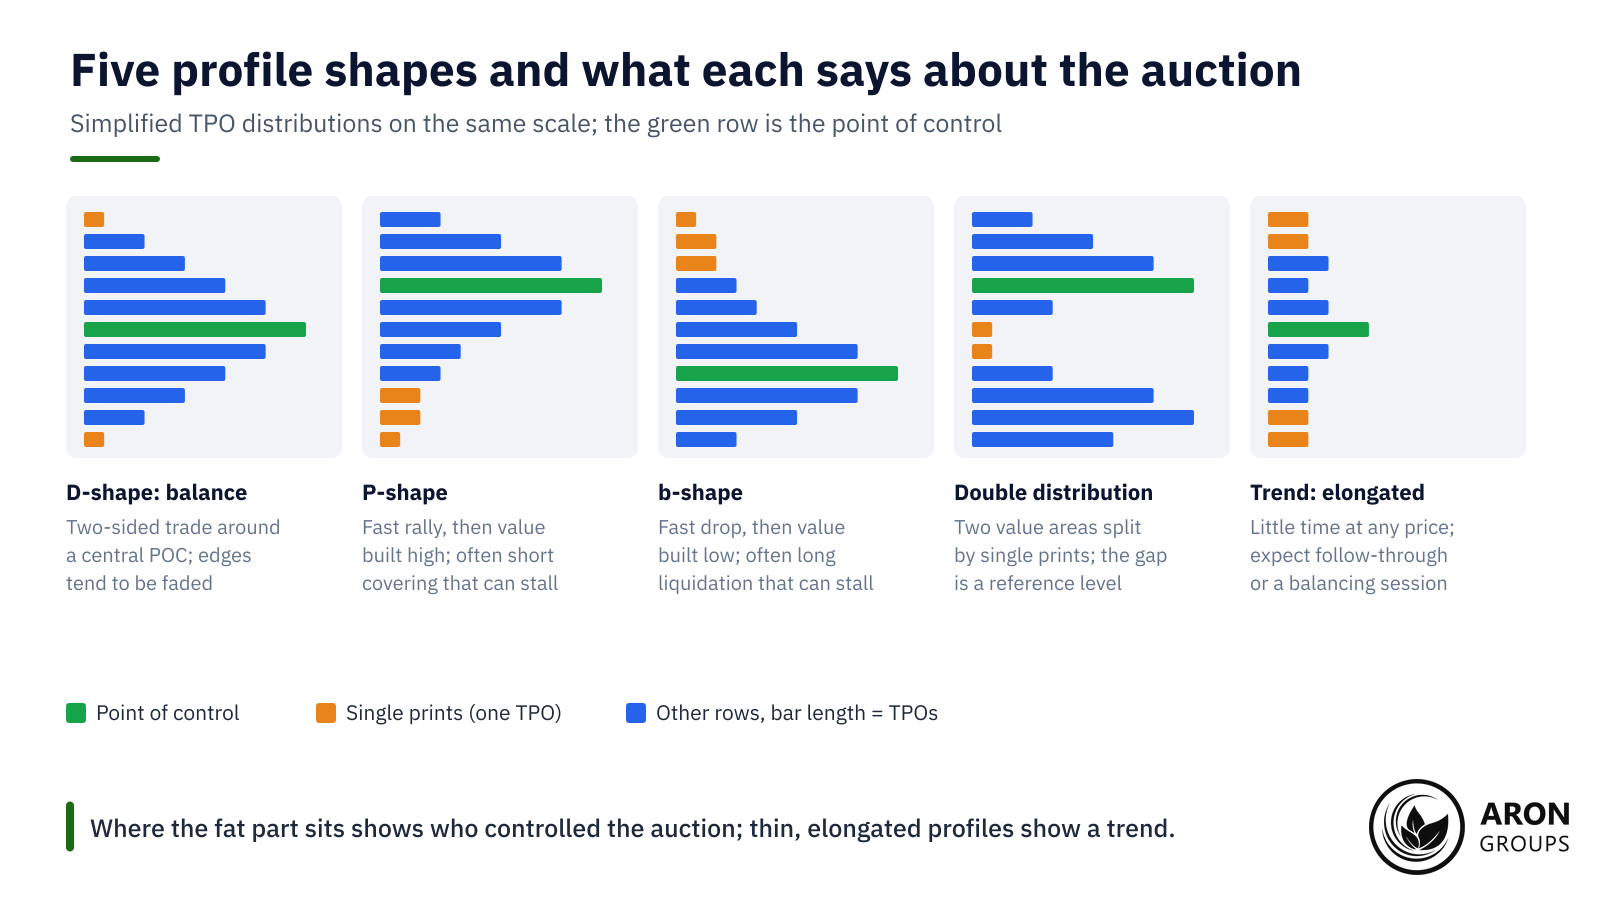
A finished profile’s shape summarises who controlled the session. Five shapes recur.
A D-shape is a balanced, rotational day, and traders tend to fade its edges. A P-shape is a fast rally followed by value built near the high, often short covering that can stall once sellers have bought back.
A b-shape mirrors it: a fast drop, then value built near the low, often long liquidation. A double distribution splits two value areas with single prints, and the gap becomes a reference. A thin trend profile tends to bring follow-through or a pause.
Dalton's Day Types
Mind Over Markets sorts sessions into six day types by how they treat the initial balance. On a normal day, a wide initial balance holds most of the range. A normal variation extends it on one side, and a trend day moves one way and closes near its extreme.
A double distribution trend day breaks from a narrow balance into a second distribution. A neutral day extends the range both ways, and a close at either extreme favours that side next session. A non-trend day has a narrow range and little extension, a sign that neither side is committed.
Open Types
Dalton also classed opens. An open drive moves hard one way and never trades back through the open. An open test drive probes the other way first, finds no business, then drives. In an open rejection reverse the first move fails and price trades back through the open, while an open auction rotates around it.
How Traders Use the Profile
Traders use Market Profile for context: whether price is inside value, and so fair, or outside it, and so unfair. In balance they fade moves to the edges of value and target the POC. In imbalance they trade breakouts that hold outside value, because acceptance at new prices means value is moving.
Value Migration and Yesterday's Levels
Comparing today’s value area with yesterday’s shows value migration: higher means buyers in control, lower means sellers, and overlapping means balance. Yesterday’s VAH, VAL and POC then frame today’s open.
Mind Over Markets treats three opens differently: inside yesterday’s value, outside value but within yesterday’s range, and outside that range. The further out the open, the stronger the hint that value is moving, if prices are accepted there.
Traders also quote the 80% rule. If price opens outside yesterday’s value area and then holds inside it for two consecutive 30-minute periods, it tends to cross to its far side. The 80% is not an audited success rate, so test it on your own market; the idea is a cousin of gap fill trading.
POC, VAH and VAL as Support and Resistance
Because many traders did business there, the POC, VAH and VAL often act as support and resistance later. Some traders treat an untested prior POC, a naked POC, as a magnet. A level is a place to watch, not a reason to trade.
To time entries there, many traders add order flow tools. Cumulative delta shows whether aggressive buyers or sellers are hitting the level, and the depth of market shows the orders resting near it.
Q: Does price always return to the point of control?
A: No. The POC pulls price back mainly while the market is balanced and rotating. On a trend day, or after a news shock, value can migrate and leave the old POC behind for days, so treat it as a reference, not a target that must be hit.
Market Profile vs Volume Profile
Market Profile counts time at each price; a volume profile counts the contracts, shares or lots traded there. Both draw a horizontal histogram with a POC and a 70% value area, but they answer different questions.
| Feature | Market Profile (TPO) | Volume profile |
|---|---|---|
| What it counts | Time: one TPO per 30-minute period at each price | Traded volume at each price |
| Data needed | Price and time only | Price plus a volume feed |
| Point of control | Price where the market spent the most time | Price with the most traded volume |
| Value area | Band holding about 70% of TPOs | Band holding about 70% of volume |
| Best for | Reading the day's structure: balance, trend and shape | Finding the prices where most business was done |
| Spot forex | Works on any price feed | Usually tick volume, a count of price changes |
| Where to find it | TradingView, Sierra Chart, NinjaTrader; a simple version in MetaTrader 5 | TradingView, Sierra Chart, NinjaTrader and many add-ons |
Market Profile and volume profile compared. Sources: CBOT study guide, MetaTrader 5 help and platform documentation, October 2026.
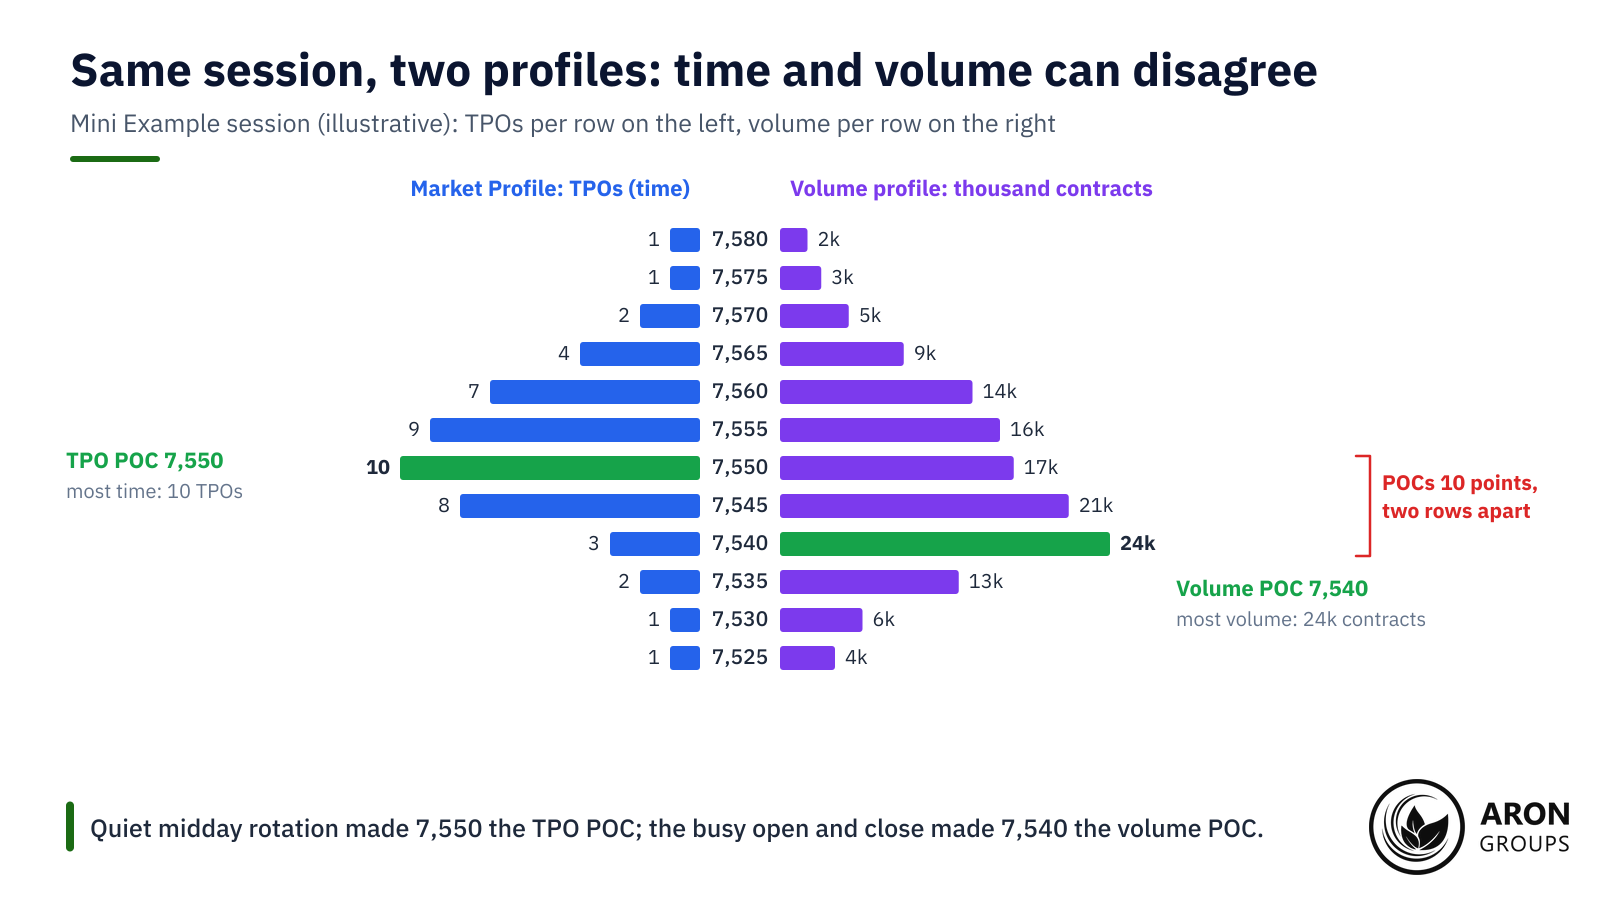
Why the Two POCs Can Disagree
On uneven-volume days the two POCs can sit at different prices. A quiet midday rotation leaves many letters on light volume, while a busy open does heavy business a few rows away. In the Mini Example, time puts the POC at 7,550 and the illustrative volume puts it at 7,540.
Key Point
Time shows where the market was comfortable; volume shows how much conviction was behind it. A common workflow reads the day's story from the TPO profile and takes execution levels from the volume profile.

Which One Works on Forex and CFDs
Spot forex has no central exchange and no single record of traded volume. The BIS found that over-the-counter FX turnover averaged $9.6 trillion a day in April 2025, with spot at $3 trillion.
MetaTrader 5’s own help describes forex volume as the number of price changes per period, known as tick volume, while exchange instruments show traded volume. A forex volume profile therefore measures activity, not size, while Market Profile can be built from any price feed.
Market Profile Software and Platforms
TradingView added a TPO indicator for Premium and higher plans in February 2024. Sierra Chart’s TPO Profile Chart defaults to 30-minute letters and a 70% value area. NinjaTrader’s order flow volume profile can be set up as a market profile.
MetaTrader 5 ships a simple Market Profile indicator in its Free Indicators folder, according to a July 2025 MQL5 article. It shades time at price for the Asian, European and American sessions but prints no letters and no POC.
The Honest Limits of Market Profile
Market Profile describes; it does not predict. Shape reading is subjective, and two traders can label the same session differently. The levels also lag, because a profile is only complete when the session ends.
The session definition changes the answer. On near 24-hour markets such as forex and gold, a New York profile differs from a London session or full-day one. The 70% is a convention, and even the arithmetic varies. Run the Mini Example one row at a time, as Sierra Chart does by default, and value becomes 7,545 to 7,565.
Above all, it is not an entry trigger on its own: it shows where value is, not when to act. It is popular with intraday traders, and the SEC warns that day traders typically suffer severe financial losses in their first months of trading. Pair any profile read with a stop and a position size that fits your account.
Where Aron Groups Fits
Aron Groups does not list a dedicated Market Profile tool. Markets that suit the method do trade on its MetaTrader 5 platform, whose standard terminal includes the simple indicator above. Index CFDs such as SPXUSD, NDXUSD and DJIUSD follow the US indices, whose cash session gives the classic A to M letters. Gold trades as XAU/USD alongside the major forex pairs.
The Nano account allows micro volumes from 0.01 nano lots, or 0.0001 lots, with no commission and a fixed spread. A demo account lets you mark profile levels on live prices with no capital at risk. Keep one market and one session definition fixed while you learn its value areas.
Conclusion
Market Profile turns a session into a distribution of time at price. The longest row is the point of control, the band with about 70% of TPOs is value, and the thin ends were rejected.
Its strength is context: fair versus unfair prices, balance versus trend, and how yesterday’s value frames today’s open. Because it needs only price and time, Market Profile also works on forex and CFDs. Treat its levels as places to watch, and let price confirm before you act.
Frequently Asked Questions
Short answers to common questions about Market Profile.
What is a TPO chart?
It is the letter-based form of Market Profile. Each 30-minute period gets a letter at every price it trades, so each row’s length shows how long the market spent there.
Is Market Profile better than volume profile?
Neither is better in general, because they measure different things: time spent at a price versus business done there. On spot forex, volume profile usually relies on tick volume.
Does MetaTrader 5 have a Market Profile indicator?
Yes, a simple one: a July 2025 MQL5 article says its Free Indicators folder includes one that shades time at price by session. It prints no TPO letters and no POC.
Can you use Market Profile on forex?
Yes, because it needs only price and time. Forex trades around the clock, so the harder part is choosing a session and using it consistently.