EN
EN


Technical
-
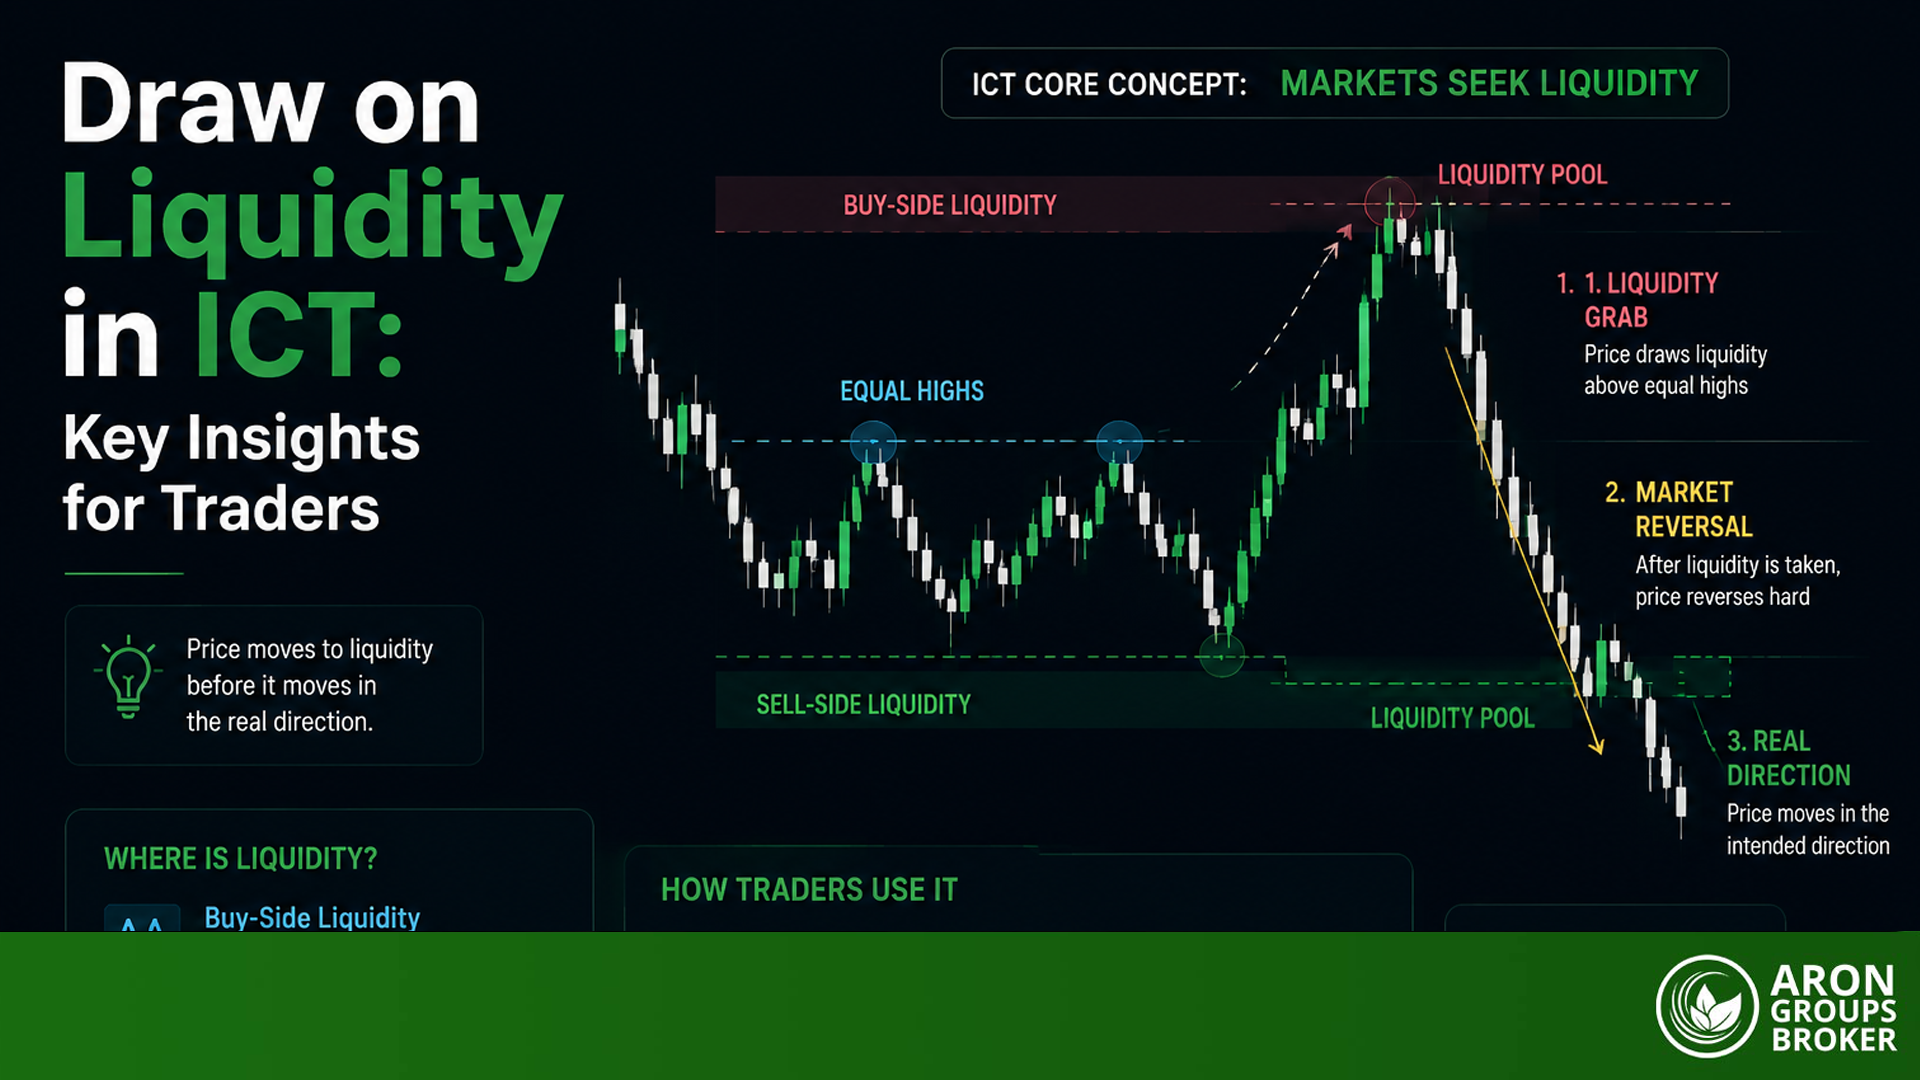
Draw on Liquidity in ICT: Key Insights for Traders
 8 May 2026
,
Abe Cofnas
8 May 2026
,
Abe Cofnas
In ICT terms, a draw on liquidity is the idea that price usually has a “common-sense” destination. Markets often travel toward places where orders stack up, equal highs, equal lows, prior day high/low, and other obvious swing points. It’s not a magic prediction trick, and it definitely doesn’t mean the price will reverse once it […]
- Read more
-
How the Weis Wave Brings Wyckoff Volume Analysis to MetaTrader 4
27 April 2026
,
Abe Cofnas
Most retail traders glance at the volume histogram beneath their chart, see a tall bar or a short one, and move on. That approach ignores the single question volume is designed to answer: how much collective effort went into each directional move? The Weis Wave indicator reframes volume around price swings rather than time intervals, […]
- Read more
-
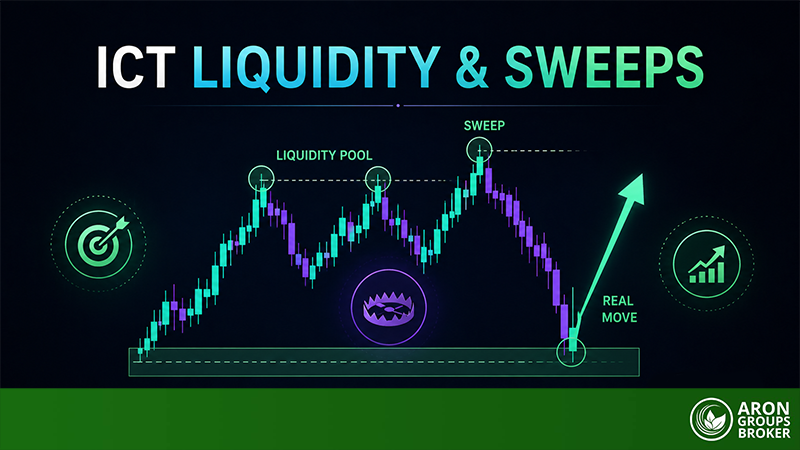
Understanding How IPDA Frames Liquidity, Imbalance, and Institutional Price Delivery
25 April 2026
,
Abe Cofnas
Price on a forex chart can appear chaotic, yet certain moves repeat with striking regularity. Liquidity above yesterday’s high gets swept before a reversal. A fair value gap left behind a fast impulse attracts price back days later. These patterns form the backbone of a concept Michael J. Huddleston (ICT) calls the Interbank Price Delivery […]
- Read more

-
What Is UTAD in Wyckoff? A Complete Guide to Upthrust After Distribution
21 April 2026
,
Abe Cofnas
Upthrust After Distribution (UTAD) in Wyckoff is the classic last squeeze above range resistance that lures breakout buyers in, then snaps back into the trading range and sets up weakness. But here’s the real question: when you see a false breakout above resistance, how do you know it’s a true Wyckoff distribution UTAD (late Phase […]
- Read more
-
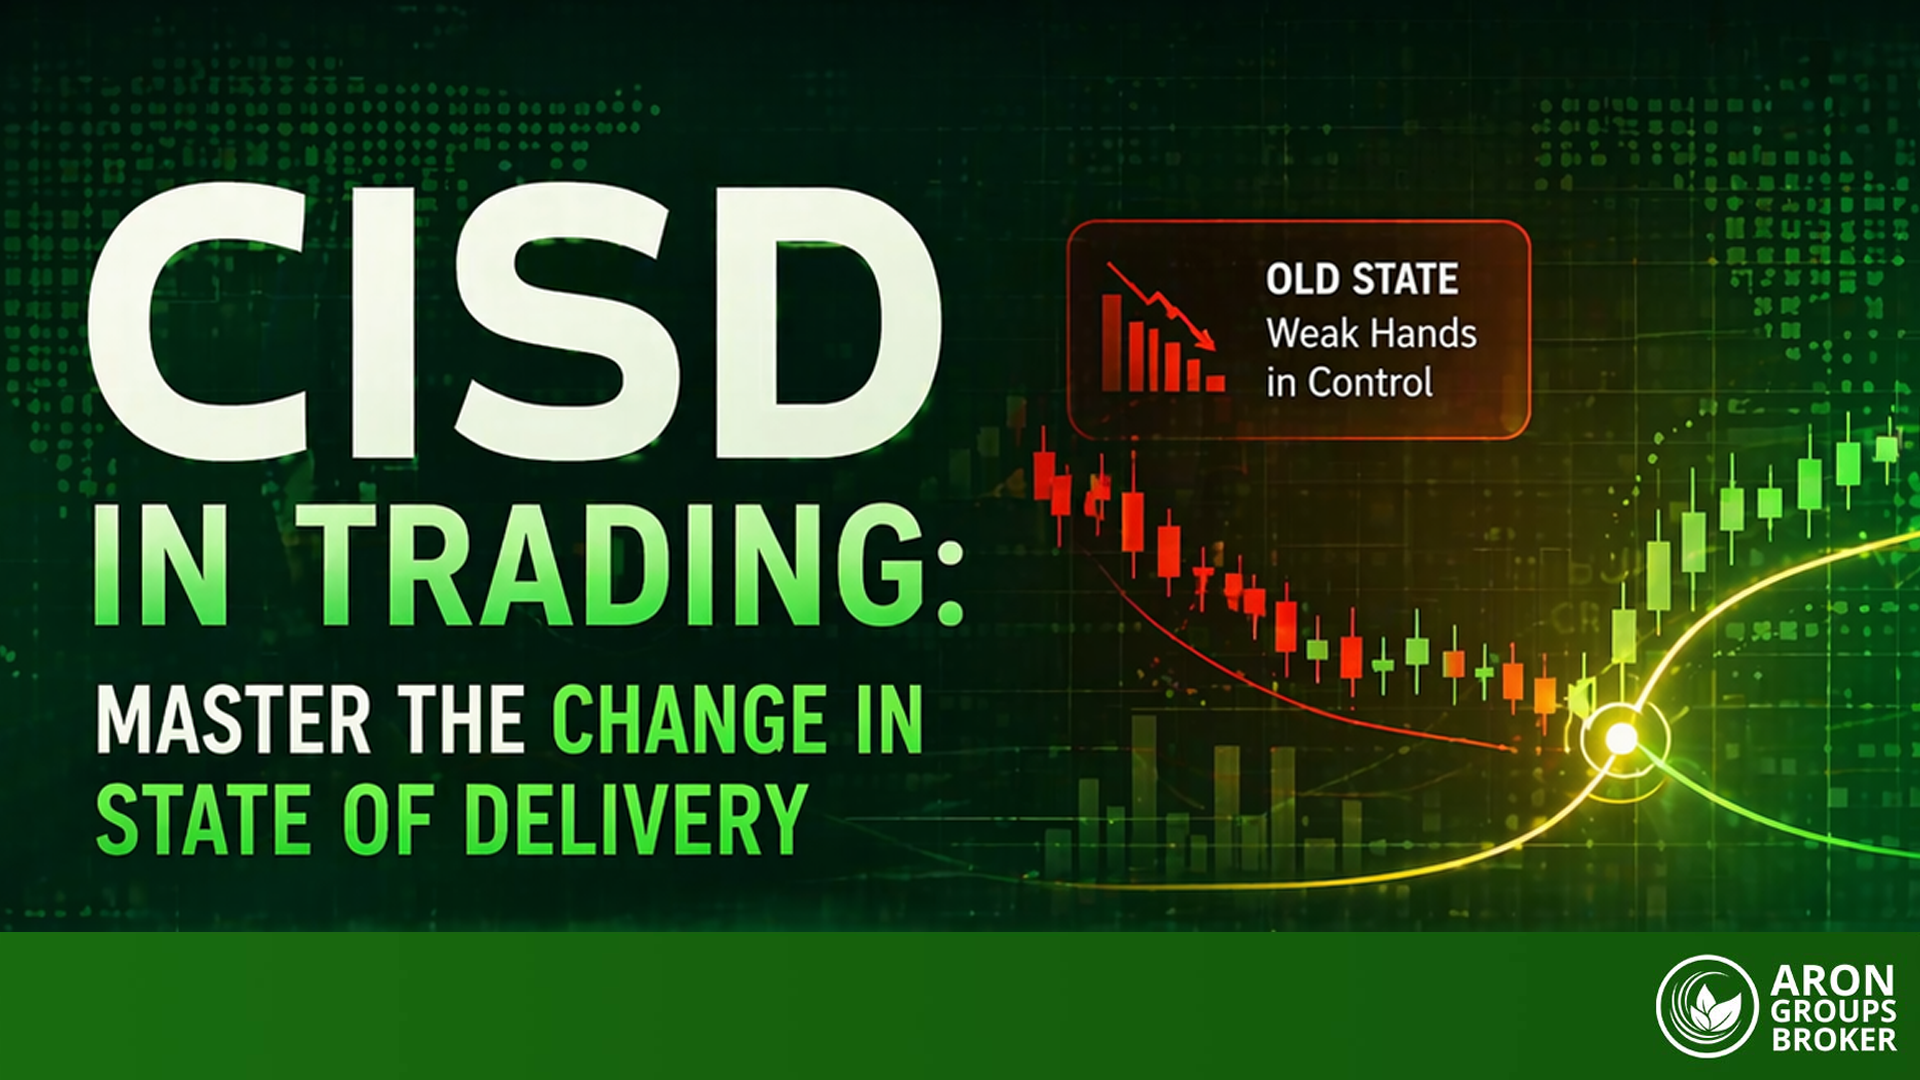
Recognising CISD for Accurate Market Entries
21 April 2026
,
Abe Cofnas
Most traders learn about Break of Structure and Change of Character early in their price action journey, yet a subtler signal often precedes both. That signal is the Change in State of Delivery, commonly abbreviated as CISD. Understanding the CISD meaning in trading gives you a practical edge: you can identify the precise moment when […]
- Read more
-
How to Use the MACD Crossover to Read Momentum and Time Your Trades
20 April 2026
,
Abe Cofnas
Trading without a clear plan often leads to analysis paralysis or emotional decision-making. The MACD crossover trading strategy remains one of the most enduring methods for simplifying market entry and exit because it strips away the noise and focuses purely on moving averages. In this guide, we will break down the indicator’s mechanics and show […]
- Read more
-
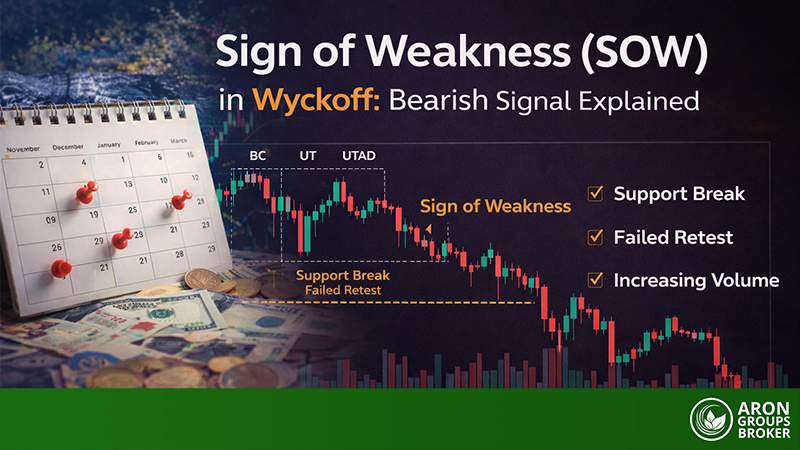
Wyckoff SOW Insights: Identifying Supply-Controlled Breakdowns
15 April 2026
,
Abe Cofnas
The Sign of Weakness (SOW) is one of the most important bearish clues in the Wyckoff method, but it is often misread as any sharp drop. In practice, SOW is not just a red candle or a quick breakdown. It is a context-based signal that shows supply taking control, usually after a distribution process has […]
- Read more
-
Building an Intraday Trading Edge with Refined MACD Settings
14 April 2026
,
Abe Cofnas
Default MACD settings can feel clean on daily charts, but on intraday timeframes, they often react too late, after the move you wanted is already half done. So the real question is: do you want faster MACD settings for intraday trading that catch momentum earlier, or do you want fewer signals and accept that you […]
- Read more
-
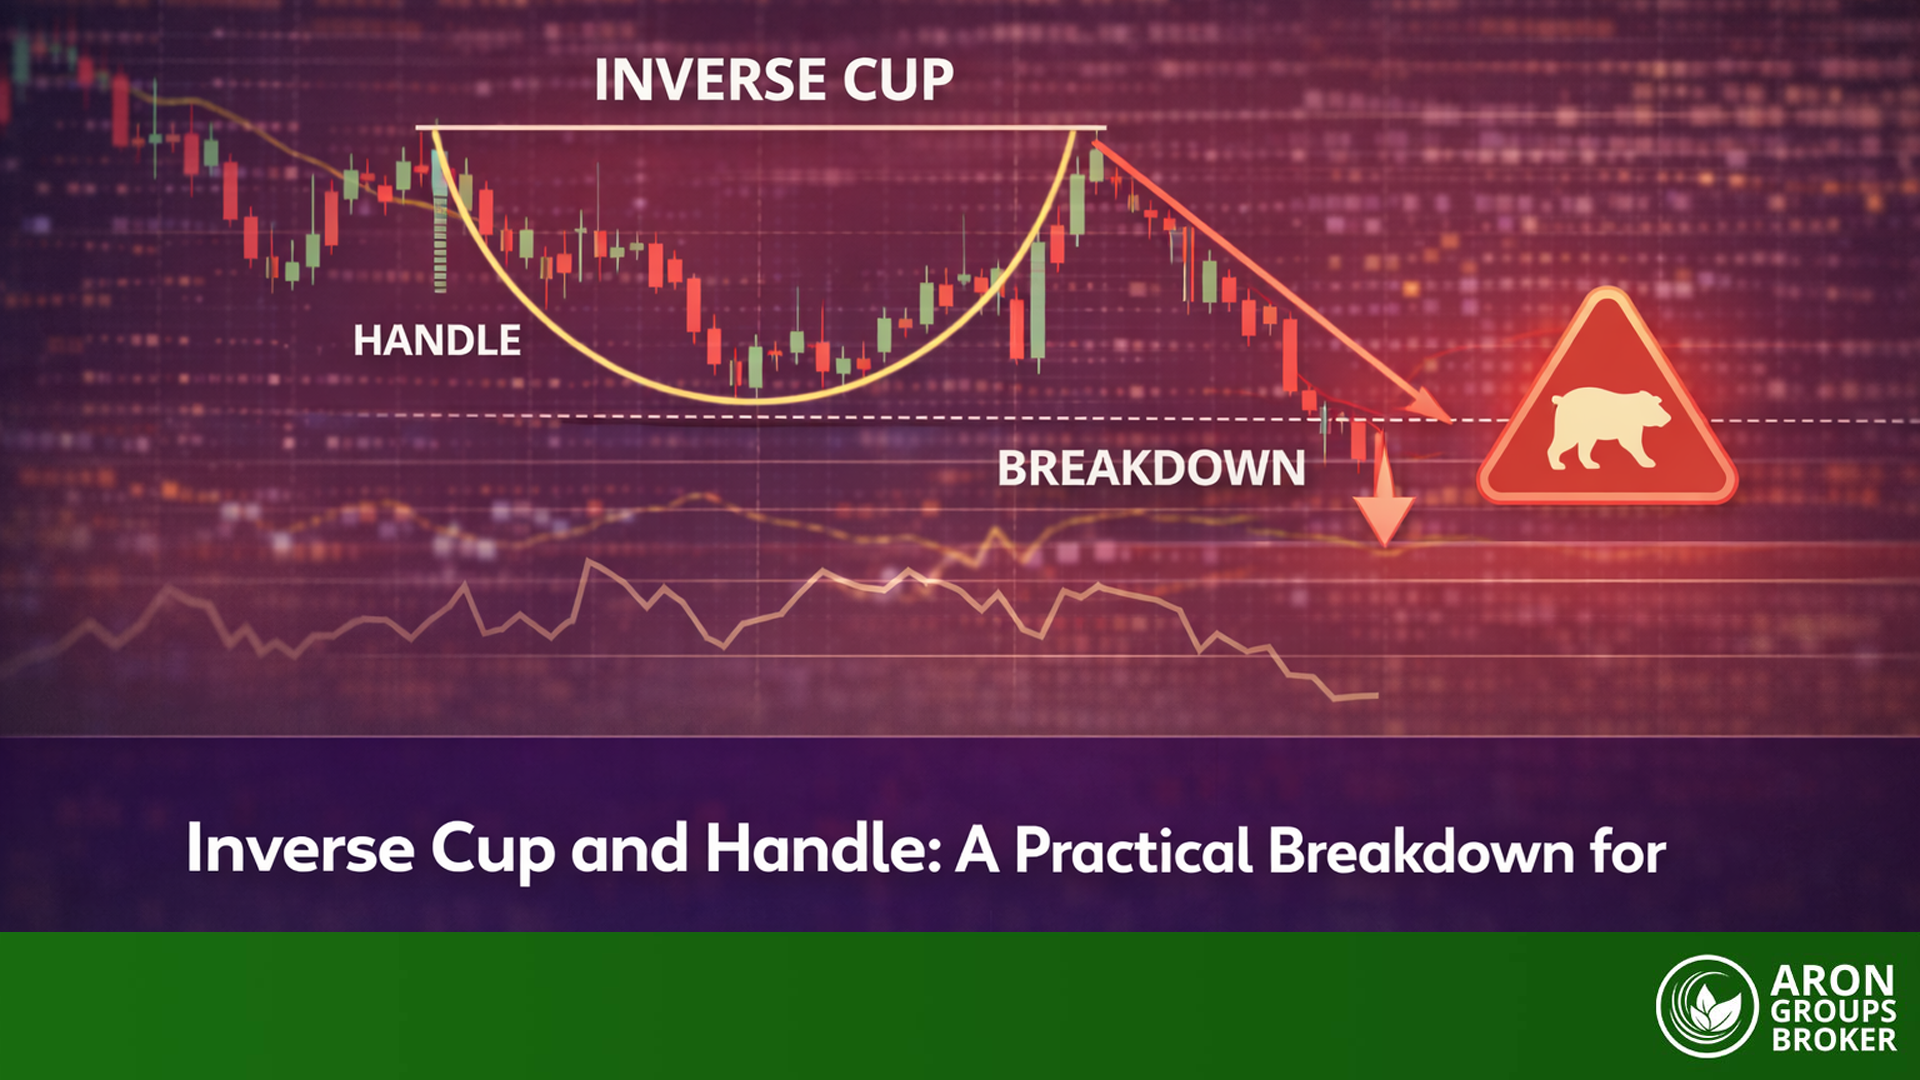
Inverse Cup and Handle: A Practical Breakdown for Bearish Traders
13 April 2026
,
Abe Cofnas
The Inverse cup and handle is a bearish chart pattern. It often signals a support breakdown after the price fails to recover. You usually see a rounded top, then a small pullback (the handle). If price breaks the neckline/support with rising volume, sellers often take control, and a strong drop can follow. In this guide, […]
- Read more
-
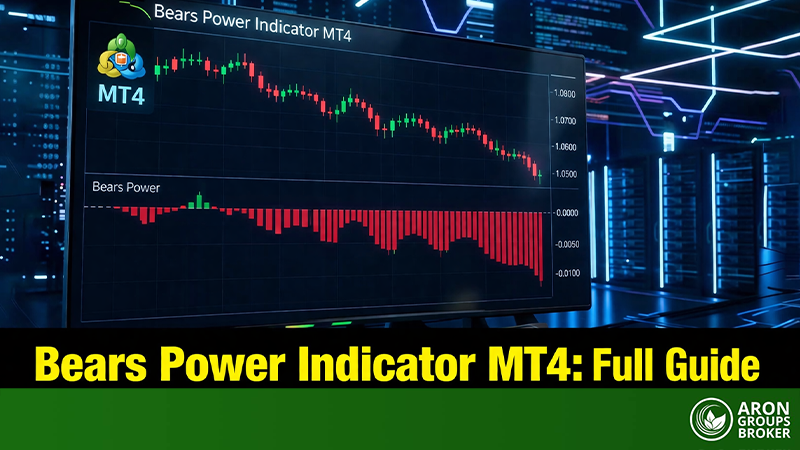
Measuring Selling Pressure with Alexander Elder’s Bears Power Oscillator on MetaTrader 4
13 April 2026
,
Abe Cofnas
Every candlestick records a battle. Buyers push for the high; sellers drive toward the low. The closing price shows who won the session, but it does not reveal how much power the losing side still holds. Alexander Elder designed the Bears Power indicator to answer precisely that question for the sell side: how far were […]
- Read more
Load more