
icon icon Home
icon icon Accounts
icon icon Quick start
icon icon Symbols

Term Premium Explained: The Risk Compensation Hidden Inside Long-Term Bond Yields

Author
Abe Cofnas
Abe Cofnas
calendar Last update: 16 October 2026
watch Reading time: 9 min

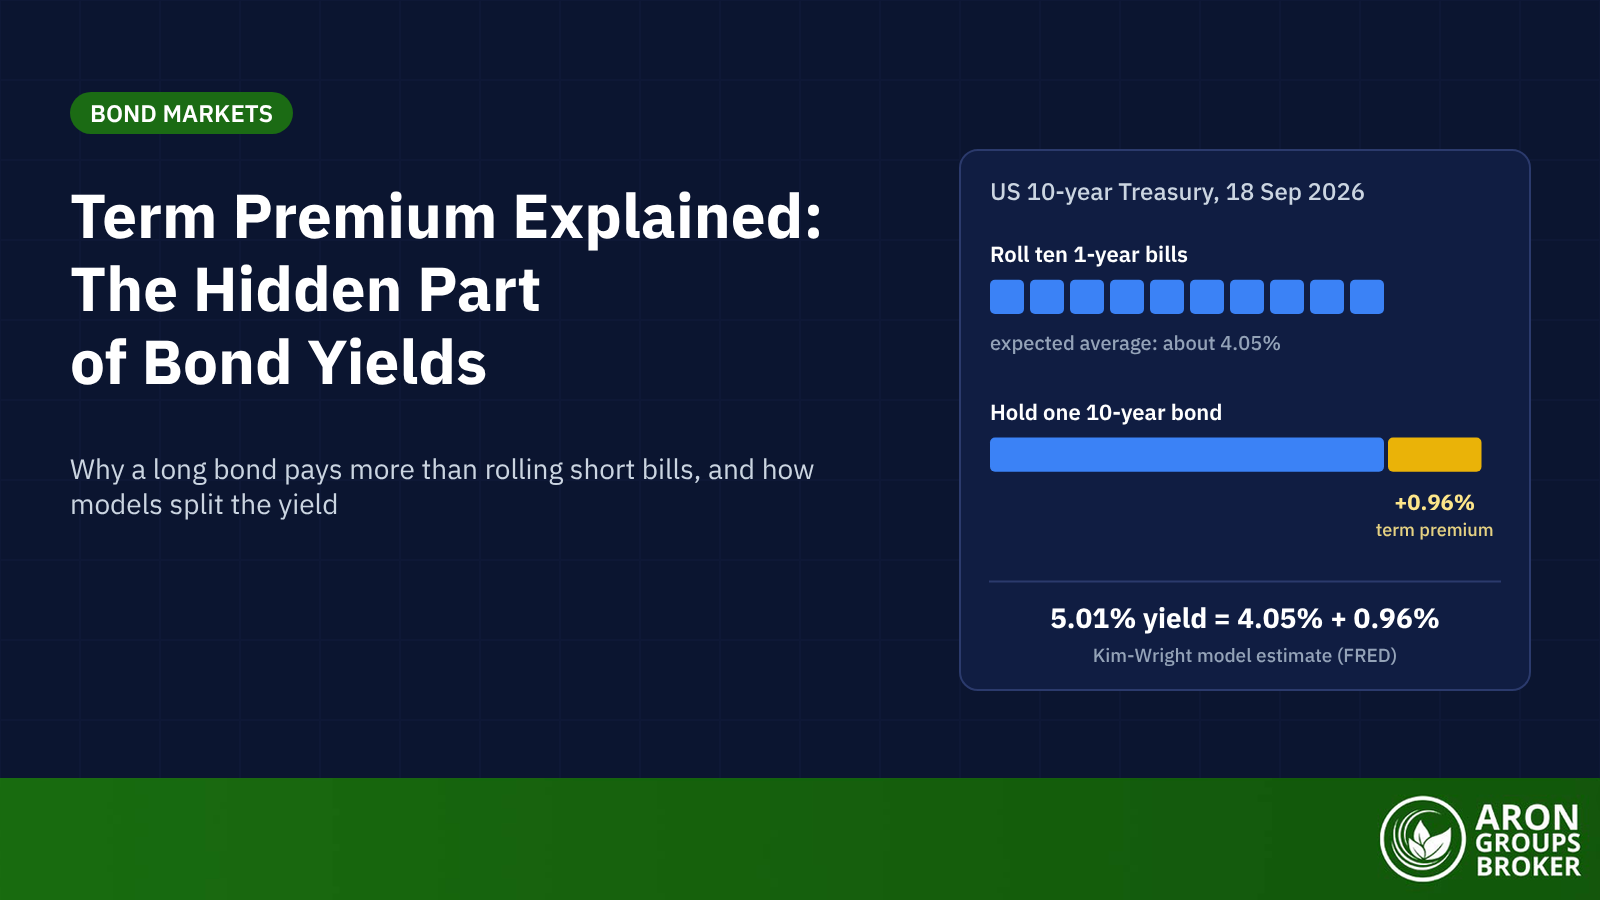
The term premium is the extra yield investors demand for holding a long-term bond instead of rolling over a series of short-term ones. It is their pay for locking money away and for carrying the risk that interest rates or inflation move against them. Despite the name, it has nothing to do with term life insurance premiums.

It matters now because it is doing much of the work in the bond market. On 18 September 2026 the Kim-Wright model put the US 10-year term premium at 0.96%, up from 0.06% two years earlier. Meanwhile the 10-year Treasury yield has climbed above 5%, its highest level since 2007.

This guide shows how a long yield splits into rate expectations and term premium, and why the premium can turn negative. It also covers the models that estimate it and what a rising premium means for gold, the dollar and stocks.

bookmark
Key Takeaways
  • The term premium is the extra yield investors demand to hold a long-term bond rather than roll short-term bills, as pay for interest rate and inflation risk.
  • A long yield splits into the average expected short-term rate plus the term premium, but both parts are model estimates rather than market prices.
  • On 18 September 2026 the Kim-Wright model put the 10-year premium at 0.96%, while the San Francisco Fed's model showed 1.20% on 22 September.
  • FRED publishes the Kim-Wright series as THREEFYTP10; the New York Fed's ACM estimates come in a separate spreadsheet, and FRED has no ACMTP10 series.
  • A rising premium lifts long yields without any change in rate expectations, tightening financial conditions and often weighing on gold and stocks.

What Is the Term Premium?

The term premium is the gap between the yield on a long-term bond and the average short-term interest rate investors expect over its life. If you could lock in 5% for ten years, or roll one-year bills that you expect to average 4%, the extra point is the term premium: your reward for committing for longer.

sms-star

Risk Disclosure
Trading forex and CFDs carries a high level of risk and can result in the loss of all your capital. This content is educational and is not investment advice. Never risk money you cannot afford to lose.
Why Investors Demand It

Holding a long bond exposes you to interest rate risk that rolling short bills avoids: if rates rise, the bond’s price falls, and the longer the maturity, the bigger the fall. It also carries inflation risk, because an upside surprise erodes the real value of fixed coupons.

Investors want paying for both. As an SEC investor bulletin explains, long-term bonds generally offer higher coupons than short-term bonds of the same credit quality to compensate for this risk.

Mini Example: What a Rate Rise Does to a Long Bond

Say you pay $1,000 for a 10-year Treasury with a 3% coupon. If market rates rise to 4% within a year, new bonds pay more, and in the SEC’s worked example your bond’s price falls to about $925.

An investor who rolled one-year bills instead would simply reinvest at the higher rate, with no capital loss. The term premium is what persuades people to accept the first outcome.

How a Long Yield Splits Into Expectations and Term Premium

Economists write a long-term yield as two parts: the average short-term rate expected over the bond’s life, and the term premium on top. The first part reflects where investors think the Fed will set the federal funds rate. The term premium is what is left: the compensation for bearing risk.

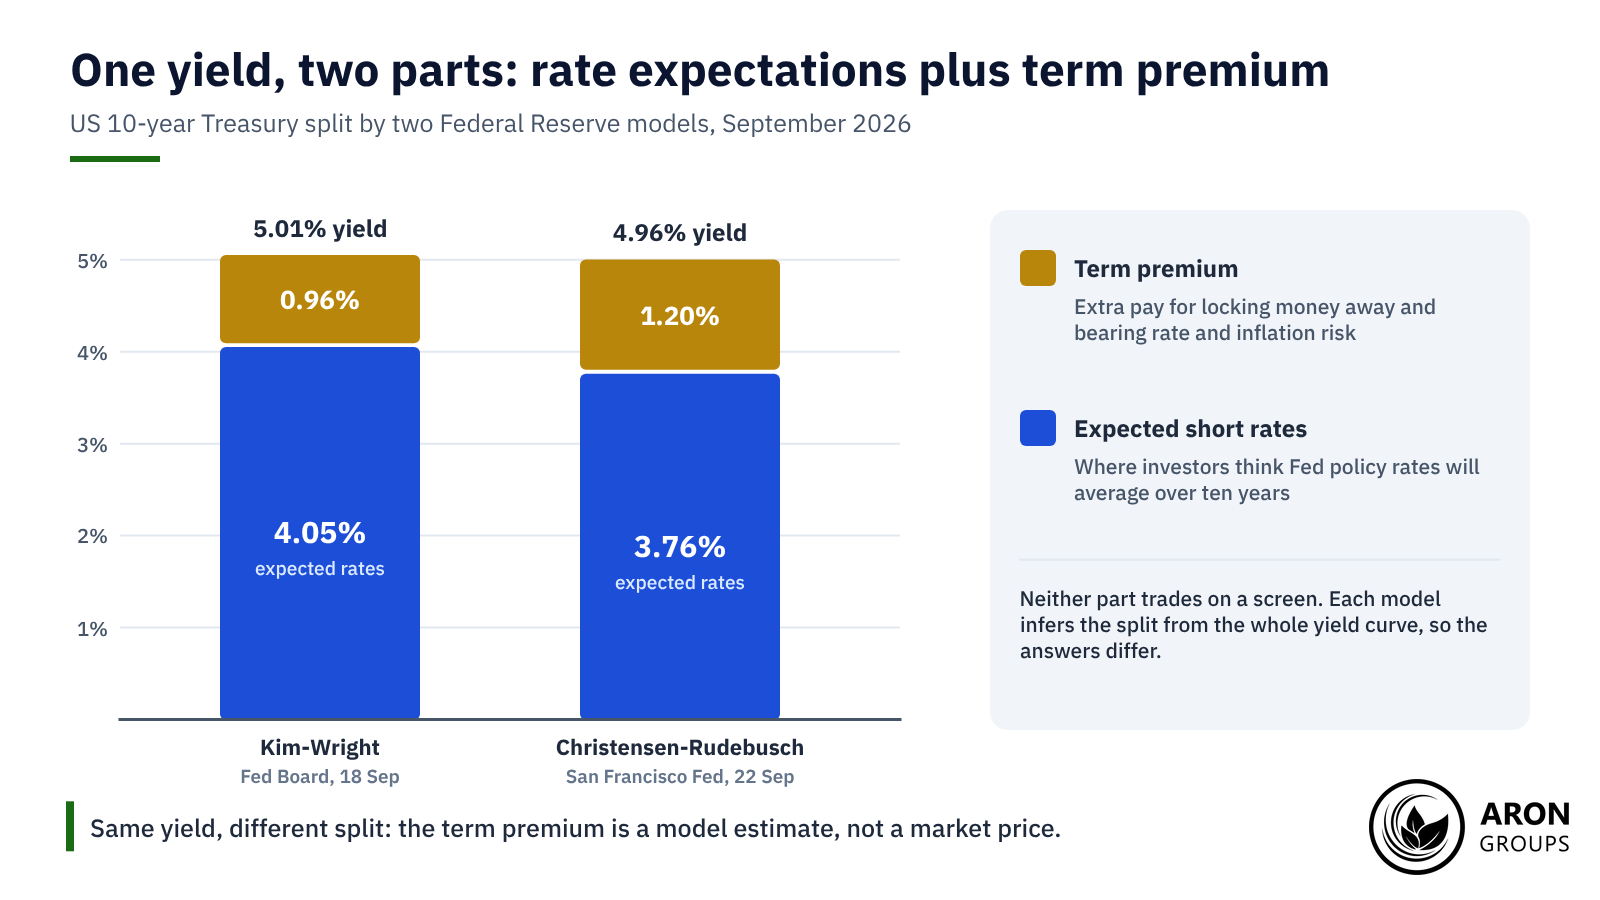
Take September 2026. On 18 September the 10-year Treasury yielded 5.01% and the Kim-Wright model put the term premium at 0.96%, leaving about 4.05% for expected short rates. On 22 September the San Francisco Fed’s model showed a premium of 1.20% on a 4.96% yield, leaving about 3.76%. These splits are approximate, because the models work with zero-coupon yields rather than the par yields quoted here.

The same 10-year yield splits differently by model: about 4.05% plus 0.96% in Kim-Wright and 3.76% plus 1.20% in the San Francisco Fed's model.

Why the Split Matters

The split tells you why yields are moving. If the expectations part rises, markets expect a tighter Fed. If the premium rises, investors want more pay for risk even though the rate outlook has not changed, and that is much harder for the Fed to steer with guidance alone.

Late 2024 showed the difference. Between 17 September 2024 and 13 January 2025 the 10-year yield rose from 3.65% to 4.79%, even though the Fed was cutting rates. Over the same period the Kim-Wright premium rose from about 0.05% to 0.8%, so risk pay, not a more hawkish rate outlook, explained much of the move.

Can the Term Premium Be Negative?

Usually the premium is positive, but it can turn negative when investors want long bonds so much that they accept less than the expected path of short rates. That tends to happen when central banks are buying bonds, when investors rush to safety or when long bonds are prized as a hedge against falling stock prices.

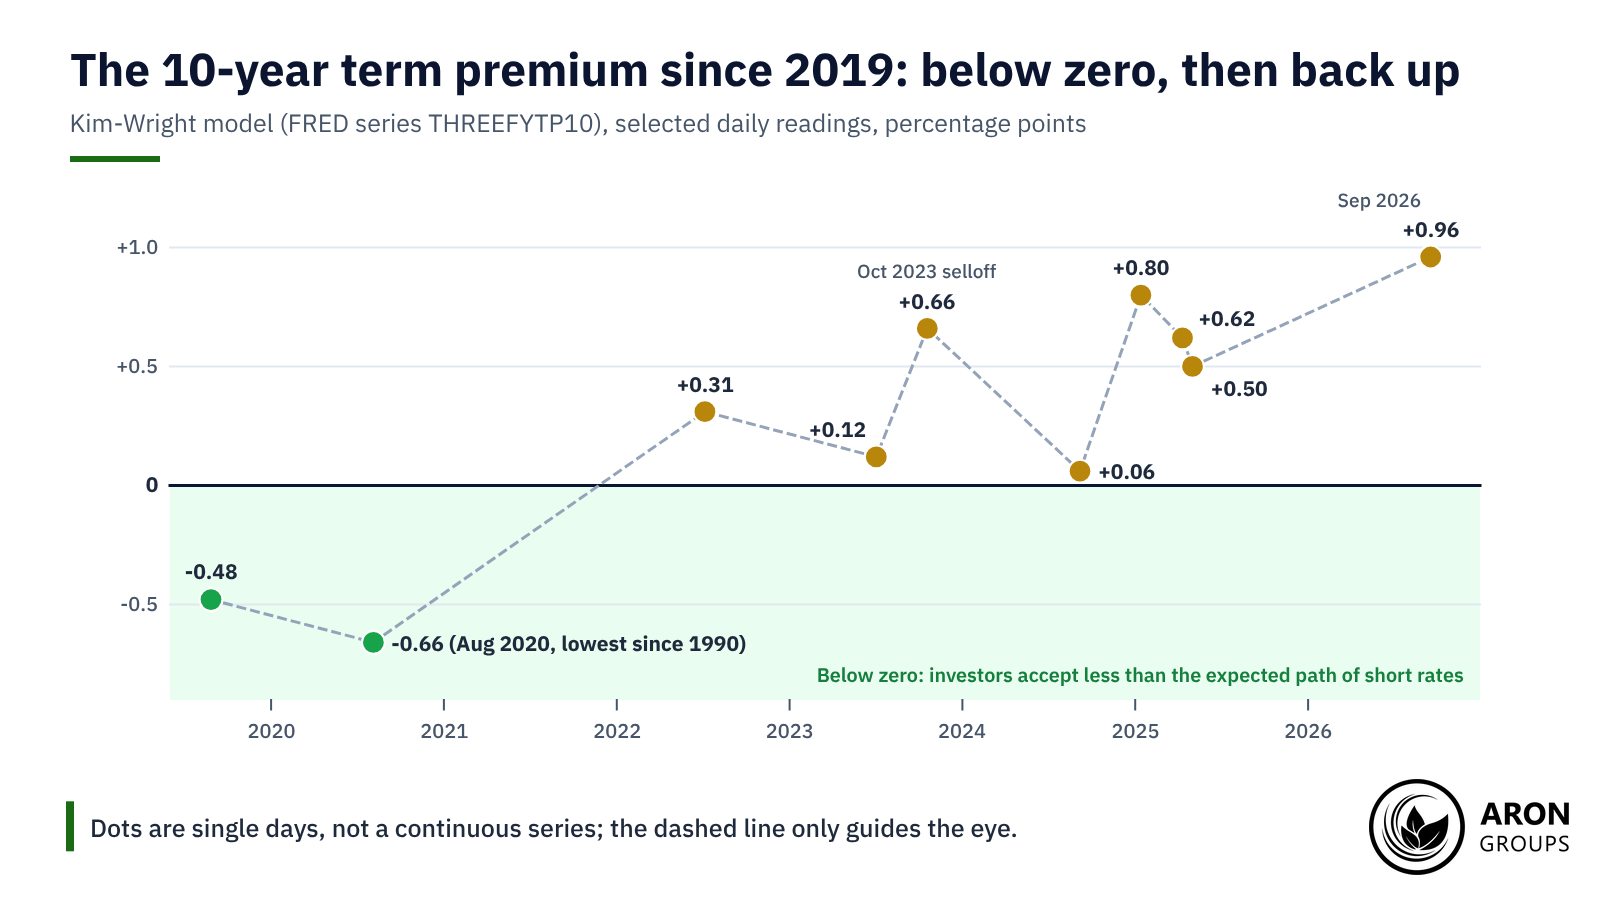
The New York Fed’s ACM estimate was negative at times in the 1960s and for much of the decade after 2012. It turned positive in October 2023 for the first time in more than two years, and only rose above 0.5% in January 2025, for the first time since 2014. In the Kim-Wright series, which starts in 1990, the low was -0.66% on 4 August 2020.

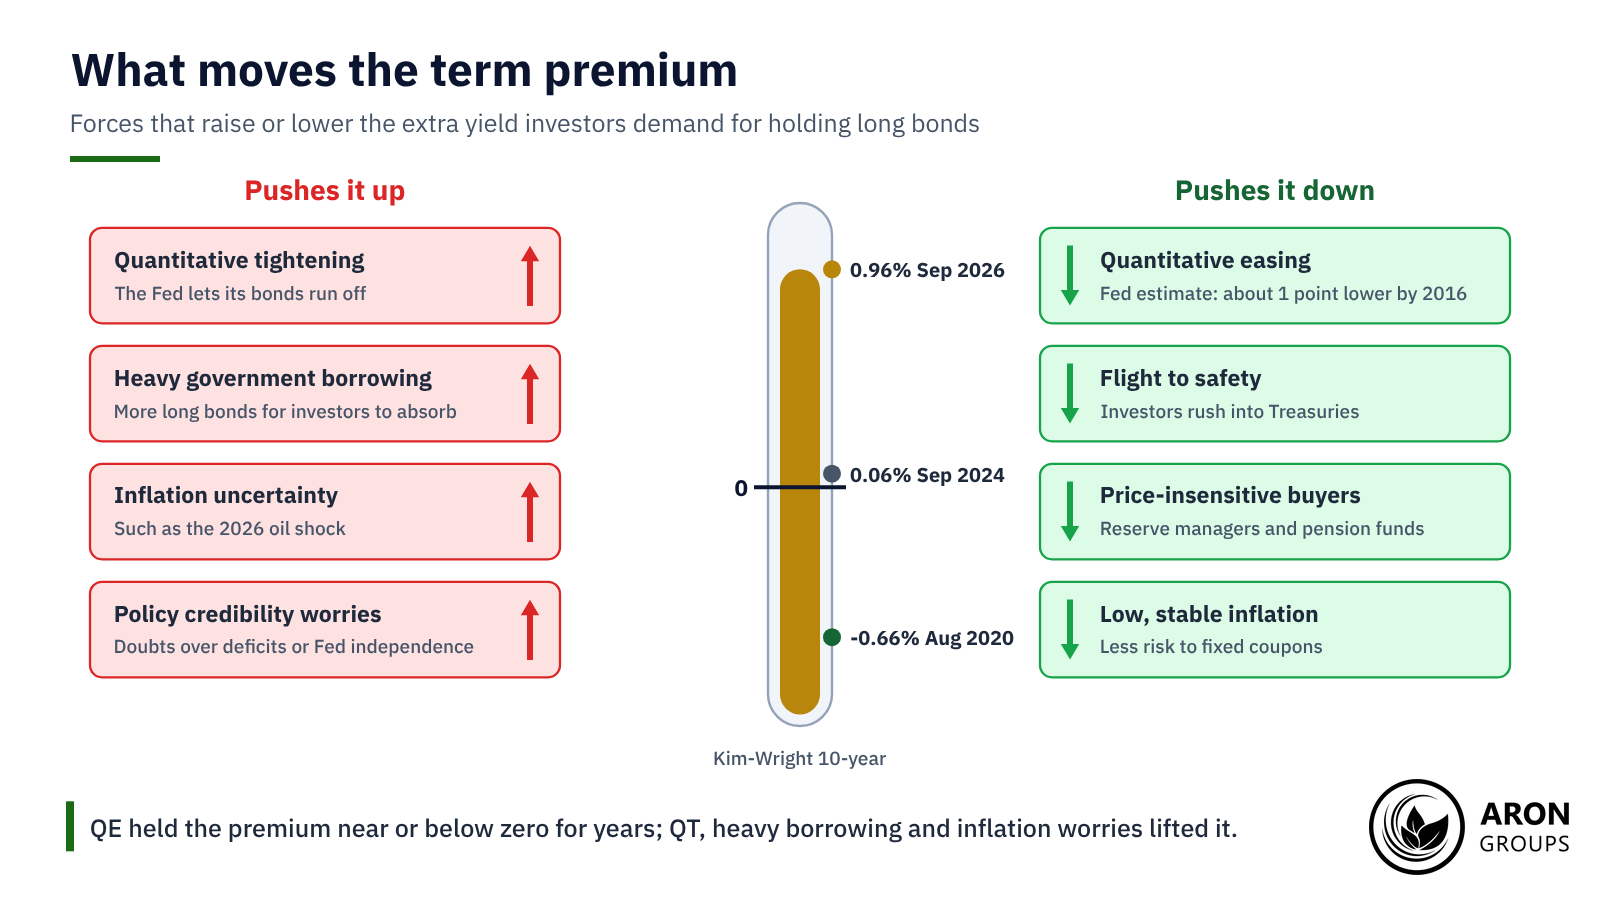
The Kim-Wright estimate hit -0.66% in August 2020, was positive by mid-2022 and reached 0.96% in September 2026.

What a Negative Premium Means

A negative premium means investors are effectively paying to hold long bonds, usually because they see them as insurance. It also means a long yield can sit below the expected path of short rates, which can flatten or invert the yield curve without the market forecasting a recession.

All the main estimates trended down after the 2008 crisis, as central banks bought bonds and inflation stayed low and stable. Against that history, a premium near 1% is high for the past decade but modest next to the ACM reading of more than 2% as recently as July 2011.

How the Term Premium Is Estimated: ACM, Kim-Wright and Others

Nobody can observe the term premium directly, because nobody can observe the rate path investors expect. It has to be estimated with a statistical model of the whole yield curve, and different models give different answers. A BIS review found the main models can differ in level by as much as 2 percentage points, although they tend to move in the same direction.

ModelPublisherWhere to find itLatest 10-year estimateNotes
ACMNew York Fed (Adrian, Crump and Moench)ACMTermPremium.xls on the New York Fed's term premia pageDownload the file for the latest valueFive-factor model; data from 1961, updated weekly
Kim-WrightFederal Reserve BoardFRED series THREEFYTP100.96% (18 Sep 2026)Three-factor model; data from 1990; a staff research product
Christensen-RudebuschSan Francisco FedTreasury yield premiums page1.20% (22 Sep 2026)Re-estimated daily since 1998
NIESR trackerNational Institute of Economic and Social ResearchQuarterly term premium trackerAbout 0.68% (end of Jun 2026)Also covers UK gilts and German Bunds

The main term premium estimates compared. Sources: New York Fed, Federal Reserve Board via FRED, San Francisco Fed and NIESR.

Why the Models Disagree

Each model infers expected rates from the shape of the yield curve using a handful of hidden factors. ACM uses five factors estimated with a series of linear regressions, Kim-Wright uses three, and the San Francisco Fed’s model is re-estimated every day. Different factors and data produce different expected paths, and so different premiums.

A Common Mix-Up: There Is No ACMTP10 on FRED

Many guides say FRED publishes the ACM term premium as ACMTP10. It does not. FRED’s 10-year series is THREEFYTP10, which comes from the Kim-Wright model at the Federal Reserve Board. The ACM data, whose 10-year column is commonly labelled ACMTP10, come from the New York Fed as a downloadable spreadsheet.

The Term Premium in UK Gilts

The same idea applies to gilts. NIESR estimated the UK 10-year term premium at 0.56% in June 2026, down from 1.20% in April 2025, while Germany’s stood at 1.22%. By NIESR’s own estimates, the UK premium was below the US figure of about 0.68% at the end of June.

What Moves the Term Premium

Several forces push the premium up or down, and in 2025 and 2026 most of them pointed upwards:

  • Central bank balance sheets: quantitative easing removes long bonds from the market and compresses the premium, while quantitative tightening does the reverse.
  • Government borrowing: bigger deficits mean more long-term bonds for investors to absorb, and they want more pay to take them.
  • Inflation uncertainty: when investors are unsure where inflation is heading, fixed coupons look riskier.
  • Safe-haven demand: in a flight to safety, investors buy long bonds and the premium falls.
  • Price-insensitive buyers: reserve managers and pension funds that buy regardless of price can hold the premium down.

Commentators also cite doubts over fiscal policy and central bank independence, although no model puts a reliable number on that effect.

Balance-sheet policy, borrowing, inflation risk and safe-haven demand push the premium in opposite directions; since 2024 the upward forces have dominated.

How Much QE Compressed It

Fed staff estimated in 2017 that the Fed’s bond purchases had lowered the 10-year term premium by about 1 percentage point by the end of 2016. When the Fed announced purchases in March 2020, 10-year yields fell 24 basis points within a day.

A BIS study of pandemic bond buying found that term premia fell because the central bank absorbed duration risk from the market.

Why It Rose in 2025 and 2026

The premium climbed as those forces reversed. The Fed shrank its balance sheet until quantitative tightening ended on 1 December 2025, and Treasury issuance stayed heavy. Then the oil shock that followed the outbreak of war in the Middle East in early 2026 revived inflation worries. In August 2026, US consumer energy prices were 16.3% higher than a year earlier.

Kevin Warsh, Fed Chair since May 2026, has long favoured a smaller balance sheet and set up a balance-sheet task force in June, so markets are alert to any renewed shrinkage.

The 2023 Bond Selloff: A Term Premium Story

The clearest recent example came in 2023. Between 26 July, when the Fed made what proved to be its last hike of that cycle, and 19 October, the 10-year yield rose from 3.86% to 4.98%. Most models found that rate expectations did little of the work.

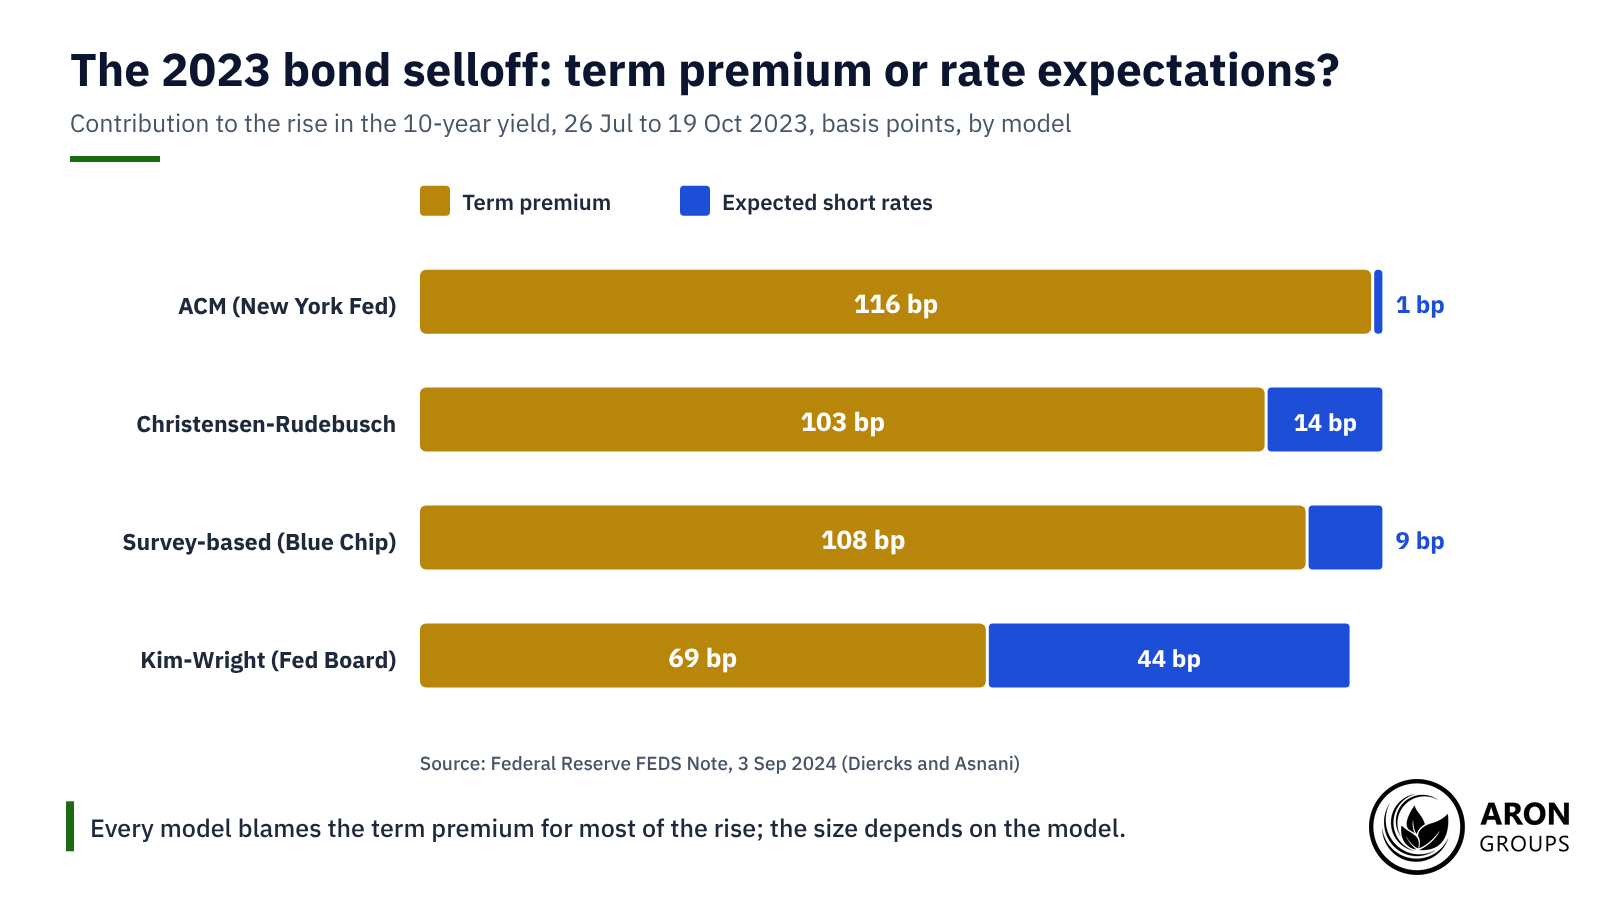
A Federal Reserve note decomposed the move with four approaches. The ACM model attributed 116 basis points to the premium and just 1 to expectations, while Kim-Wright attributed 69 and 44. The note pointed to quantitative tightening, heavier Treasury issuance and higher uncertainty as the drivers.

All four decompositions blame the term premium for most of the 2023 selloff, from 69 basis points in Kim-Wright to 116 in ACM.

The 2013 Taper Tantrum

In 2013, yields jumped after the Fed hinted at slowing its bond purchases. According to New York Fed economists, that taper tantrum was driven entirely by the term premium in the ACM model. In both episodes, investors demanded more pay for risk rather than pricing a much tighter Fed.

The Term Premium and the Yield Curve Signal

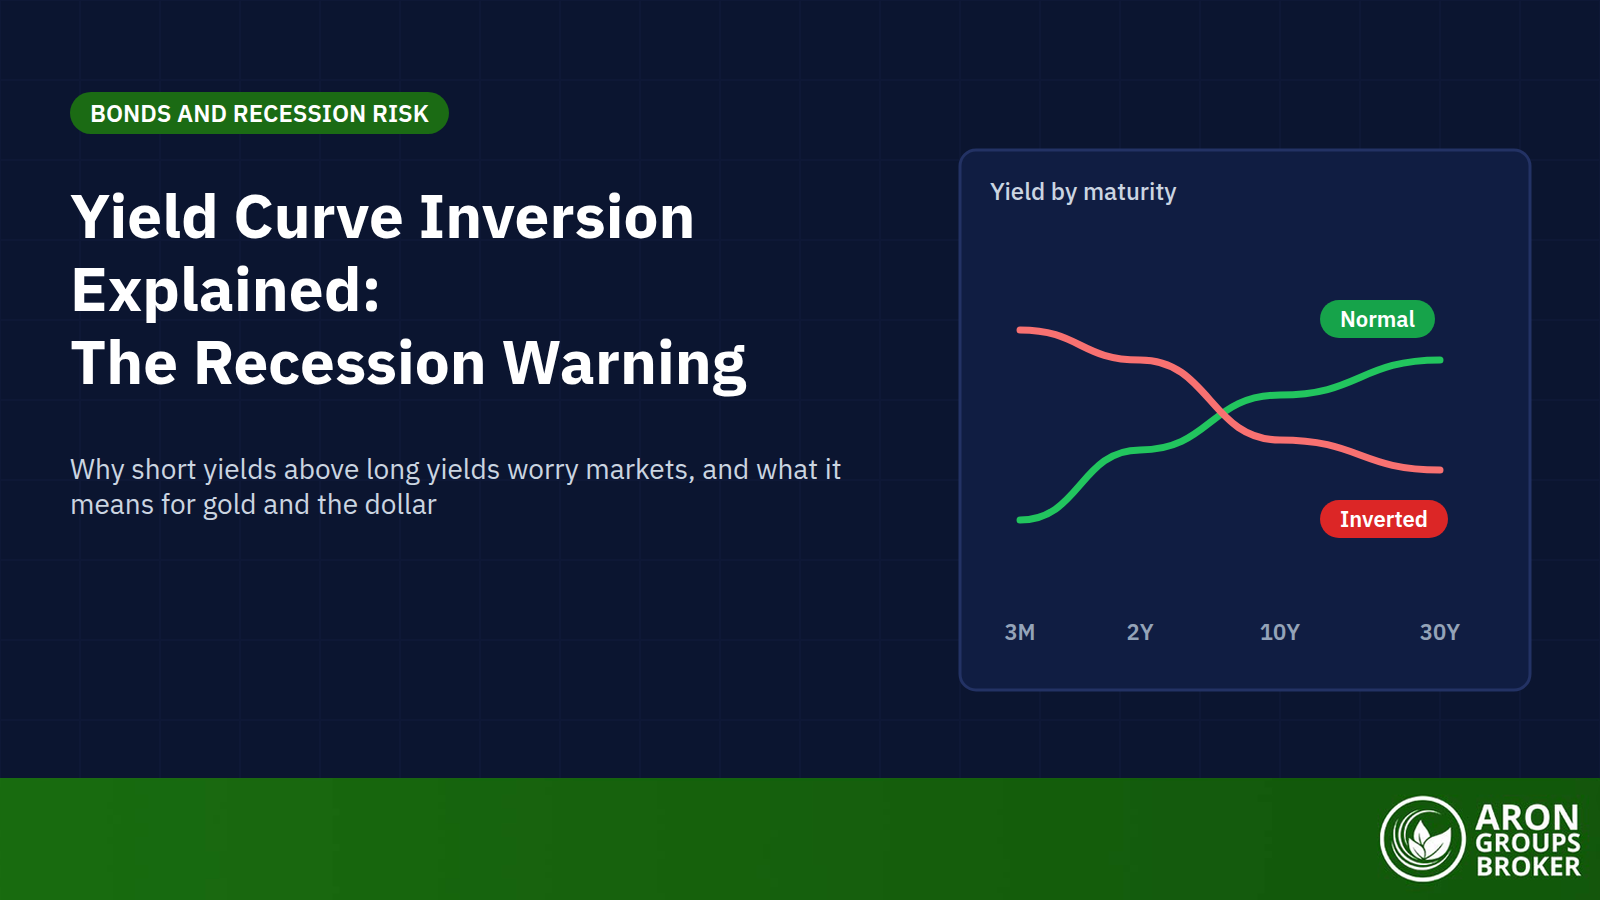
Because a low premium drags down long yields, it can flatten or invert the yield curve without any change in growth expectations. Ben Bernanke made this argument in March 2006, when he suggested a flat curve partly reflected a low term premium rather than a coming recession. The next recession began in December 2007.

The debate returned in 2022 to 2024. The 10-year minus 2-year spread reached -1.08 points on 3 July 2023 while the ACM premium was negative, and no recession has followed. Fed Board economists have argued that a near-term forward spread, which strips out most of the premium, is a cleaner signal.

Q: Does a rising term premium mean a recession is coming?
A: Not on its own. A rising premium steepens the curve, and past recessions have more often followed a steepening driven by falling short-term rates. A steepening driven by a higher premium mainly tells you investors want more pay for risk.

Why the Term Premium Matters for Gold, the Dollar and Stocks

A rising term premium lifts long yields even when rate expectations stay put. That raises mortgage and corporate borrowing costs, tightens financial conditions and makes bonds more competitive with stocks. In late 2023, Fed officials pointed to higher long-term yields when explaining why conditions had tightened.

Gold pays no interest, so higher real yields raise the opportunity cost of holding it, and a premium-driven rise in yields is usually a headwind. The dollar tends to benefit from higher US yields, but not always. When the premium rises on fiscal or credibility worries, investors can sell bonds and the currency together. That happened in April 2025, when the 10-year yield jumped from 4.01% to 4.48% in a week while the dollar fell.

How Traders Can Use It

The premium is most useful as a way to read the bond market’s mood:

  • Diagnose yield moves: compare the change in the 10-year yield with a premium estimate to see whether expectations or risk pay is driving it.
  • Watch supply: Treasury refunding announcements and long-bond auctions show how much debt investors must absorb.
  • Track the Fed’s balance sheet: any plan to shrink it again would tend to lift the premium.
  • Treat it as context: estimates are revised and differ by model, so use them to explain moves, not to time entries.

The Honest Limits of the Term Premium

The term premium is a model’s answer to a question markets cannot answer directly. Estimates differ by model, sometimes by more than a percentage point, and they change as models are re-estimated. The Board describes the Kim-Wright series as a staff research product rather than an official statistic.

Use it to explain why yields moved, not to forecast where they go next. A premium that looks high can stay high, and one that looks low can keep falling, as it did through much of the 2010s.

Where Aron Groups Fits

Aron Groups does not offer bond trading, but the term premium moves markets it does offer, including major forex pairs and gold on XAU/USD, through MetaTrader 5. When long yields jump on a rising premium, the dollar and gold often react within the same session.

Fed meetings and inflation releases are among the moments when the premium tends to move, and the economic calendar lists them. A Nano account lets you trade small sizes while you learn how bond moves feed into currencies and gold.

Conclusion

The term premium is the part of a long bond yield that pays investors for risk rather than for expected interest rates. It cannot be seen directly, so the New York Fed, the Fed Board and the San Francisco Fed each estimate it with their own models, and their answers differ.

In September 2026 those models put the 10-year premium at roughly 1%, far above the negative readings of 2020. That premium is part of why long yields have topped 5% while the Fed has only just started hiking again.

When yields move, check whether expectations or the premium is doing the work, and treat the premium as context for gold and the dollar rather than a trading signal.

Frequently Asked Questions

Short answers to common questions about the term premium.

What does the term premium mean?

It is the extra yield investors demand for holding a long-term bond instead of rolling short-term bills. It compensates them for the risk that interest rates or inflation rise during the life of the bond.

How do you calculate the term premium?

You cannot calculate it from market prices alone. Economists estimate it by subtracting a model’s forecast of average future short-term rates from the long-term yield, which is why the ACM, Kim-Wright and San Francisco Fed estimates differ.

What is the 10-year term premium now?

On 18 September 2026 the Kim-Wright estimate on FRED was 0.96%, and the San Francisco Fed’s estimate was 1.20% on 22 September. Check the New York Fed’s spreadsheet for the latest ACM figure.

Do you get all your money back when a bond matures?

Yes, if the issuer does not default, you receive the bond’s face value at maturity. Price falls caused by rising rates only become losses if you sell before then, although inflation can still erode what that money buys.

Continue Reading
not-found
calendar 16 October 2026
Rate this article

Leave a Reply

Your email address will not be published. Required fields are marked *

No thanks