
A wage-price spiral is a self-reinforcing loop between pay and prices. Rising prices push workers to demand higher pay, and higher pay pushes firms to raise prices again. Each round feeds the next, so inflation can outlast the shock that started it. Economists treat it as a form of cost-push inflation.
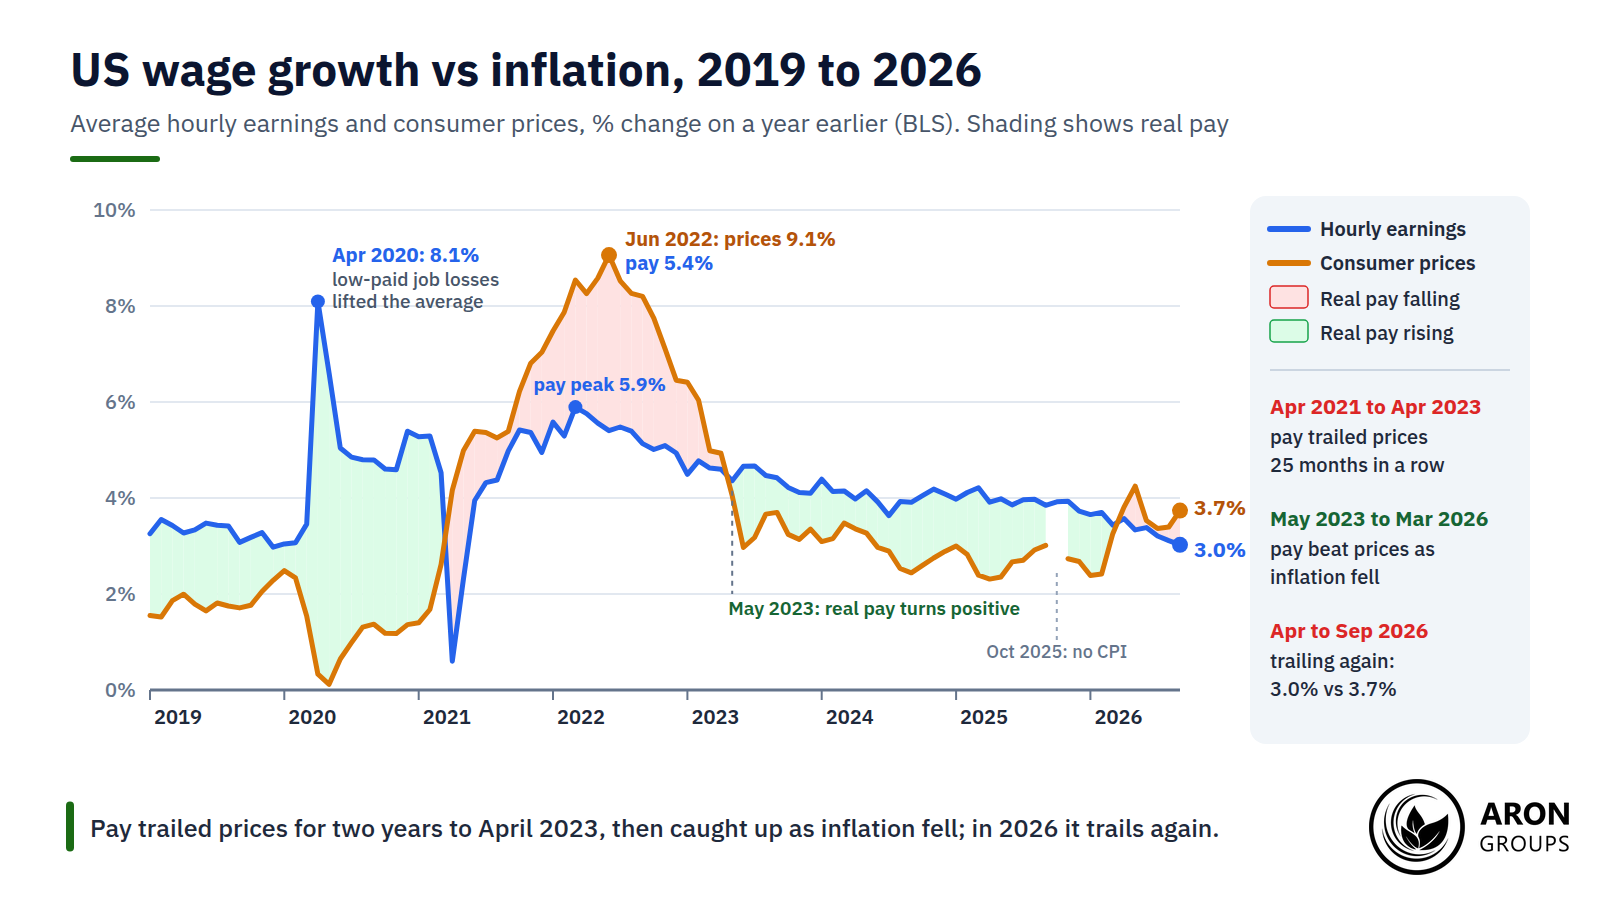
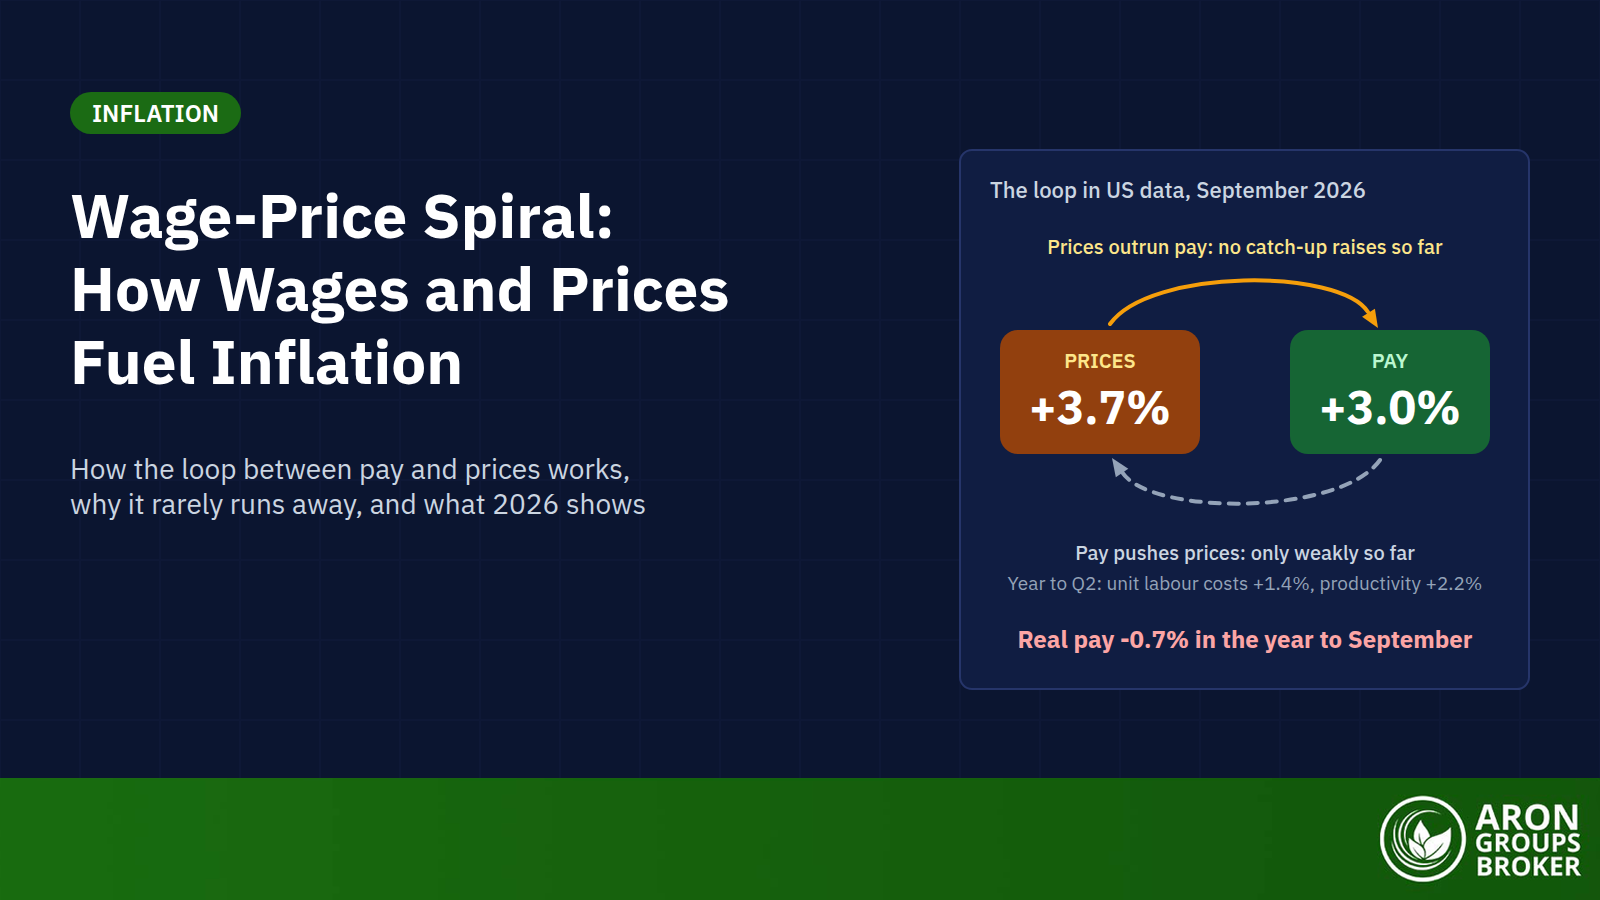
US inflation was 3.7% in the year to September 2026, while average hourly earnings rose 3.0%, so real pay fell 0.7%. US crude futures closed at $101.41 a barrel on 16 October. On 16 September the Fed raised its target range for the federal funds rate to 3.75% to 4.00%. Markets now want to know whether pay will start chasing prices.
This guide covers the loop, cost-push inflation, the 1970s and the post-COVID scare. It then explains why spirals are rare, what 2026 shows and what wage data mean for markets.
- A wage-price spiral is a feedback loop: prices lift pay demands, pay lifts unit labour costs and firms pass those costs back into prices. It is the wage-driven form of cost-push inflation.
- In the year to September 2026, US consumer prices rose 3.7% and average hourly earnings 3.0%, so real pay fell 0.7% (BLS, 14 October 2026).
- An IMF study of 79 wage-price episodes in advanced economies since 1960 found that only a small minority led to sustained acceleration. The 22 most like 2021 were, on average, followed by falling inflation, not a spiral.
- Real pay fell first even in the 1970s: in the year to March 1980 prices rose 14.8% and production workers' hourly pay 7.6%. Indexation for about 60% of workers under major union contracts kept the loop turning.
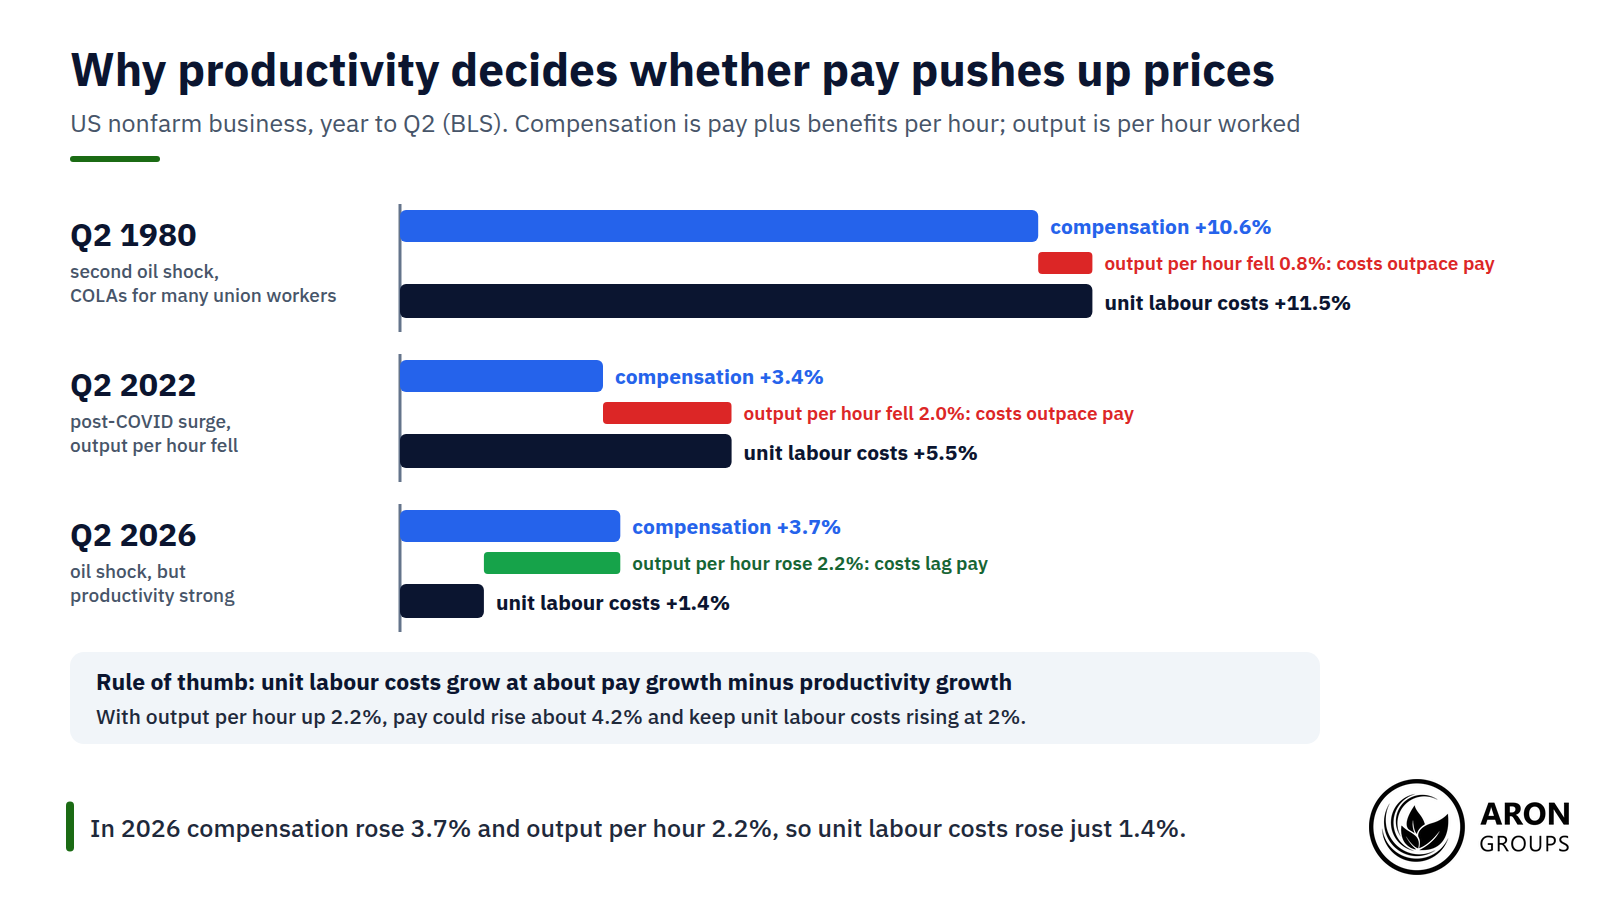
- Productivity is the quiet brake. In the year to Q2 2026, US hourly compensation rose 3.7% and output per hour 2.2%, so unit labour costs rose only 1.4%.
What Is a Wage-Price Spiral?
A wage-price spiral, sometimes called a price-wage spiral when prices move first, is inflation that sustains itself through pay and prices. When prices rise faster than pay, workers lose purchasing power and push for raises. Those raises lift labour costs, firms raise prices to protect margins, and purchasing power falls again. BIS economists define it as feedback, in both directions, between wages and prices.
Risk Disclosure
Trading forex and CFDs carries a high level of risk and can result in the loss of all your capital. This content is educational and is not investment advice. Never risk money you cannot afford to lose.
Real Wages, Purchasing Power and Expectations
The key variable is the real wage: pay adjusted for inflation. If your pay rises 3% while prices rise 4%, your real wage falls by about 1%. That squeeze starts the bargaining; it is the inflation risk every wage earner carries.
Expectations decide how hard people bargain. When inflation expectations are anchored, workers and firms trust the central bank to restore its target, so pay deals assume inflation of about 2%. When expectations come unanchored, deals build in today’s high inflation or more. Wage indexation, which ties pay to past inflation automatically, makes the link mechanical.
How the Wage-Price Spiral Works, Step by Step
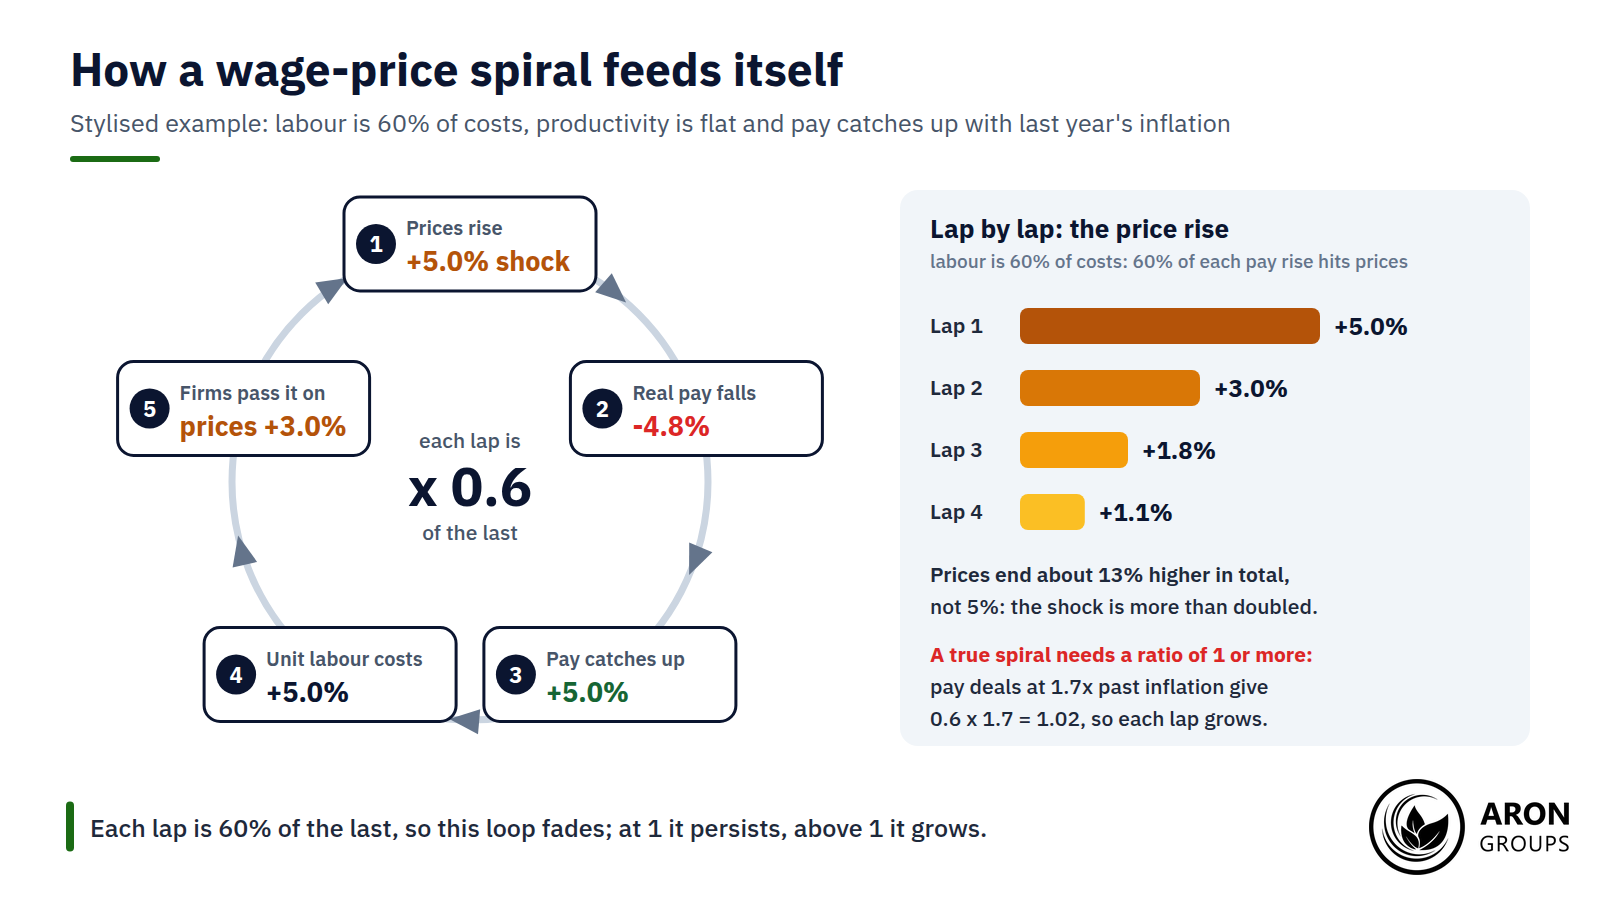
The loop has five steps. Prices rise, real pay falls, workers win catch-up raises, unit labour costs rise, and firms pass those costs on, which restarts the cycle. Unit labour costs are the pay needed to produce one unit of output, so they rise when pay outpaces productivity.
Whether the loop fades or explodes depends on its strength. Multiply two shares: how much of each price rise returns as higher pay, and how much of each pay rise returns as higher prices. Below 1, each lap is smaller than the last. At exactly 1, each lap repeats at the same size; above 1, each lap is bigger.
Mini Example: Four Laps of a Wage-Price Spiral
Assume labour is 60% of a firm’s costs, productivity is flat and pay catches up fully with last year’s inflation. An energy shock lifts prices 5% in year one, cutting real pay by about 4.8%.
In year two workers win 5%. Unit labour costs rise 5%, so total costs rise 3.0% because labour is 60% of costs. Firms pass that on, and prices rise 3.0%. In year three pay rises 3.0% and prices 1.8%; in year four, pay rises 1.8% and prices 1.1%.
Each lap is 0.6 times the last, so the loop fades. Even so, prices are 11.3% higher after four years, and the total heads towards 13%, not 5%. If workers bargain for 1.7 times past inflation instead, the ratio becomes 0.6 times 1.7, or 1.02, and each lap grows.
Cost-Push Inflation: The Parent of the Spiral
Cost-push inflation is a rise in the general price level caused by higher production costs rather than excess demand. It occurs when an input most firms buy becomes dearer: energy, raw materials, imports after a currency fall, taxes or labour. A wage-price spiral is its wage-driven, self-reinforcing version.
Energy is the classic trigger, and the live one in 2026. US energy prices were 20.4% higher in September than a year earlier, with petrol up 34.2%. Core inflation, which excludes food and energy, was only 2.6%. Producer prices often show such pressure before consumer prices do.
Cost-Push vs Demand-Pull Inflation
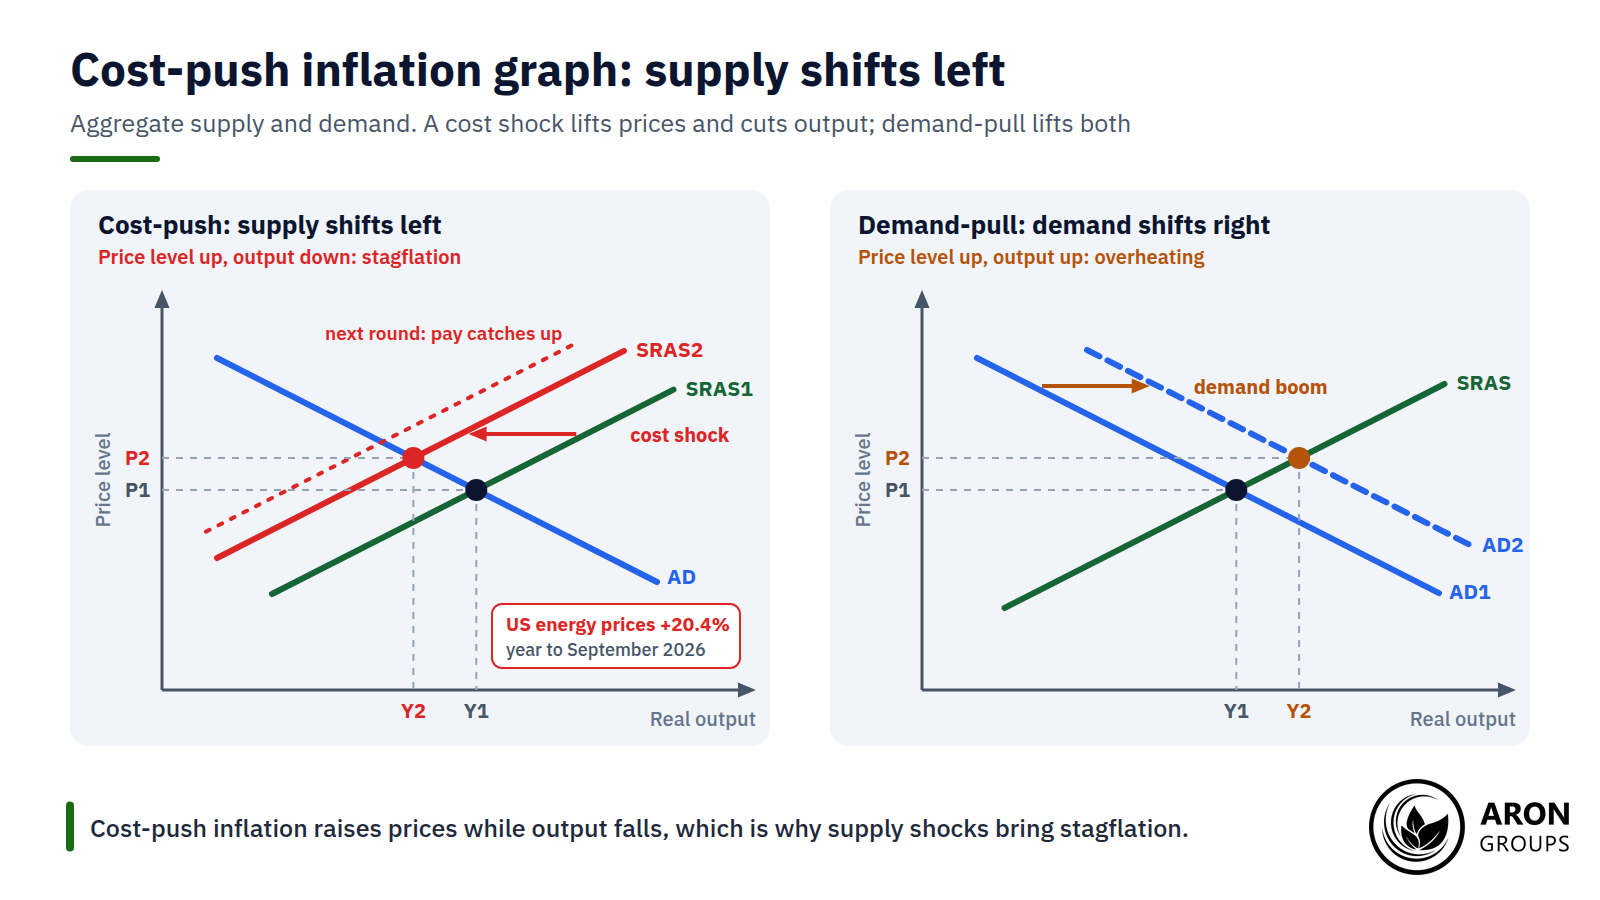
Demand-pull inflation is the opposite case: too much spending chases too few goods, so prices and output rise together. Cost-push inflation lifts prices while output falls, the mix called stagflation, which forces central banks to choose between inflation and jobs.
The dotted line on the graph shows how a one-off shock can become a spiral. If pay catches up, supply shifts left again. If the central bank then eases to protect jobs, demand shifts right, output recovers and prices rise again. Tightening does the reverse: it lowers prices but deepens the output loss.
Wage-Price Spiral Examples: The 1970s and 2021 to 2023
Two episodes frame the debate: the 1970s spiral and the post-COVID scare.
The 1970s: Stagflation and the Textbook Case
Oil shocks fanned an inflation that loose money had started in the mid-1960s. In 1973 an Arab embargo and output cuts nearly quadrupled the price of oil, from $2.90 a barrel to $11.65 by January 1974. Oil then more than doubled again between April 1979 and April 1980. US consumer prices rose 12.3% in the year to December 1974 and 14.8% in the year to March 1980.
Indexation kept the loop turning. By the late 1970s, cost-of-living adjustment (COLA) clauses covered about 60% of US workers under major union contracts. That was up from about 25% in the 1960s, a BIS bulletin notes. Yet real pay still fell first: in the year to March 1980, production workers’ hourly pay rose 7.6% while prices rose 14.8%.
A BLS review found that in 1980 the average COLA increase covered only 62% of the rise in prices. The 1970s spiral was about persistence, with pay rising about 7.5% a year from 1973 to 1981, not about wages outrunning prices.
Paul Volcker, Fed chair from August 1979, broke it. The monthly average fed funds rate peaked at 19.1% in June 1981. Unemployment reached 10.8% in late 1982, by which time inflation had fallen to 3.8%.
2021 to 2023: The Spiral That Did Not Happen
Post-pandemic inflation revived the fear. US inflation peaked at 9.1% in June 2022, when average hourly earnings were up 5.4%. Unemployment fell to 3.4% by April 2023, a very tight labour market.
Pay did accelerate, peaking at 5.9% in March 2022, but it trailed inflation in every month from April 2021 to April 2023. From May 2023 pay outpaced inflation, mainly because inflation fell. In the IMF’s past episodes, falling inflation and faster pay growth both helped.
The table compares the two episodes with 2026 so far.
| Measure | 1970s to early 1980s | 2021 to 2023 | 2026 so far |
|---|---|---|---|
| Trigger | Oil shocks of 1973 and 1979, easy money | Reopening demand, supply snarls, energy | Oil shock; US crude above $100 in October |
| Peak CPI inflation | 14.8% (March 1980) | 9.1% (June 2022) | 4.2% (May); 3.7% in September |
| Peak pay growth | 9.3% (January 1981, production workers) | 5.9% (March 2022) | 3.7% (February); 3.0% in September |
| Real pay at its worst | -6.3% (March 1980) | -3.4% (June 2022, leaving aside the April 2021 base effect) | -0.9% (May) |
| Unemployment | 9.0% (May 1975); 10.8% (late 1982) | Low of 3.4% (April 2023) | 4.2% (September) |
| Policy rate peak | Fed funds 19.1% (June 1981 average) | 5.25% to 5.50% (from July 2023) | 3.75% to 4.00% (since 17 September) |
| Pay indexation | COLAs for about 60% of workers under major union contracts | Rare: last US figure about 20% (mid-1990s) | Rare |
| Outcome | Spiral broken by recession | No spiral; real pay rose from May 2023 | Pay lagging; expectations edging up |
Year-on-year changes. Sources: BLS, Federal Reserve (via FRED), BIS; real pay computed from BLS pay and CPI data.
Why Sustained Wage-Price Spirals Are Rare
Sustained spirals are much rarer than the headlines suggest. An IMF working paper of November 2022 found 79 wage-price episodes since 1960 in a dataset of 38 advanced economies. In each, both price inflation and wage growth rose in at least three of four consecutive quarters. Only a small minority led to sustained acceleration.
The 22 episodes most like 2021 had rising inflation, falling real wages and flat or falling unemployment. On average, they were followed by faster wage growth and falling inflation, not a spiral. Falling real wages ease firms’ cost pressure, which works against a spiral. As a June 2023 headline in The Economist put it, wage-price spirals are “far scarier in theory than in practice”.
Friedman's Critique: Wages Are the Symptom
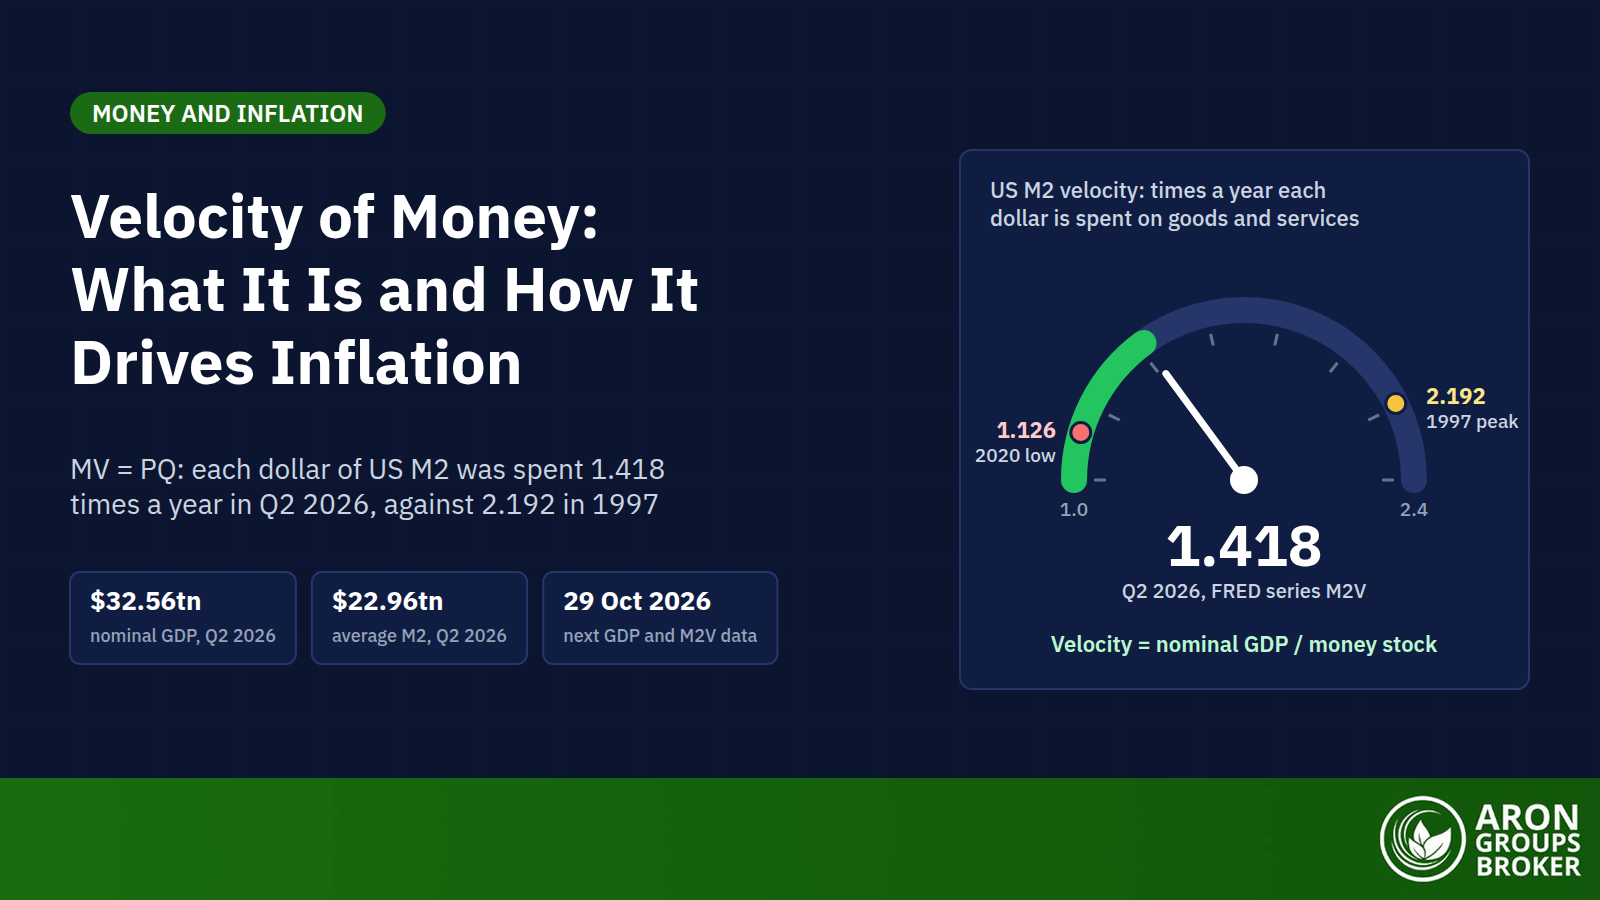
Milton Friedman went further. In a 1966 speech, first published by the Richmond Fed in 2005, he called the spiral “the external manifestation of inflation, but not its source”. Inflation, he argued, comes from “one and only one reason: an increase in a quantity of money.”
In 1963 he summed it up as “always and everywhere a monetary phenomenon”. Firms can keep passing on higher pay only if there is enough money to pay the higher prices. In this view, a central bank that refuses to accommodate breaks the loop, usually at the cost of slower growth.
What Prevents a Wage-Price Spiral
Three brakes matter most. Anchored expectations keep pay demands in line with the central bank’s target. Monetary tightening cools demand and the labour market, which weakens bargaining power. Productivity growth lets pay rise without raising unit labour costs, because each hour produces more.
With output per hour up 2.2%, pay could rise about 4.2% a year and still keep unit labour costs rising at 2%. Institutions have changed too: COLA coverage fell to about 20% by the mid-1990s, and official reporting of it stopped in 1996.
Key Point
Unit labour costs grow at roughly pay growth minus productivity growth. Pay can outpace inflation without fuelling it, as long as productivity keeps up.
Wage Growth vs Inflation in 2026: Is a Spiral Forming?
Not on the latest data. The September jobs report, released on 2 October, showed average hourly earnings up 3.0% on a year earlier. That was down from 3.7% in February, even as inflation climbed. The BLS says real average hourly earnings fell 0.7% over the year, so pay is lagging prices rather than chasing them.
Broader cost measures agree. The Employment Cost Index showed private-sector wages and salaries up 3.1% in the year to June 2026, against 3.5% a year earlier. Unit labour costs rose only 1.4% in the year to the second quarter, and the Fed’s 16 September statement said “productivity growth is strong”.
The risk lies in expectations. The University of Michigan’s preliminary October survey put year-ahead expectations at 4.7% and long-run expectations at 3.5%, above their 2024 range of 2.8% to 3.2%. The New York Fed’s September survey showed one-year expectations of 3.9%, the highest since May 2023, while expected earnings growth slipped to 2.6%.
Households expect prices to outrun their pay, the squeeze that can later fuel catch-up demands. Fed Chair Kevin Warsh flagged a related risk on 16 September. The Fed, he said, aims to ensure that “relative price changes in some sectors of the economy do not broaden”. The Fed dot plot shows how far officials expect rates to go.
The ECB watches the same risk through a wage tracker built from euro area pay agreements. On 16 September 2026 it pointed to negotiated wage growth of about 2.7% in the first half of 2027.
Q: Does a strong wage report mean a spiral has started?
A: No. A spiral needs pay and prices to accelerate together for several quarters; the IMF’s test requires three out of four. One hot month matters more if unit labour costs and long-run expectations rise with it.
The next tests come quickly. The Fed meets on 27 to 28 October, and the Employment Cost Index for the third quarter follows on 30 October. Productivity and unit labour costs are due on 5 November, the October jobs report on 6 November and October CPI on 10 November.
What Wage Data Mean for the Dollar, Gold and Stocks
Wage data move markets through rate expectations. A hot reading on hourly earnings or unit labour costs raises the odds of tighter Fed policy. That tends to lift Treasury yields and the US dollar, and a soft reading tends to do the reverse. The effect is strongest when inflation is the Fed’s main worry.
Gold pays no interest, so it usually suffers when wage data push real yields up. It can still rise when an inflation scare outruns the rate response, which is why traders watch CPI and gold together. Energy shocks with a geopolitical cause can add a safe-haven bid, though gold’s reaction to war shows it often fades.
Stocks face two forces. Faster pay supports spending but squeezes margins when firms cannot pass costs on, and higher yields weigh on valuations. In a cost-push episode, energy producers can gain while labour-intensive firms with thin margins suffer.
The Honest Limits of the Wage-Price Spiral Idea
Correlation is not causation. Pay and prices rise together in most inflations, but that does not show which drives the other. In Friedman’s view, both can be symptoms of too much money.
Profits can matter as much as pay. IMF economists estimated in June 2023 that profits accounted for about 45% of euro area price rises since the start of 2022. Labour costs accounted for 25%. How far firms absorbed wage gains, they argued, would decide how fast inflation returned to the ECB’s 2% target.
Measurement is messy. Average hourly earnings jumped 8.1% in the year to April 2020 because low-paid workers lost their jobs, not because pay rose. The October 2025 CPI was never collected during the government shutdown. Official indices do adjust for smaller packs, but quality cuts and other hidden inflation are harder to capture.
Expectations are hard to pin down, because surveys of households, firms and markets often disagree. Lags between price rises and pay deals blur cause and effect. Spirals are rare, not impossible: the 1970s show what happens when indexation, unanchored expectations and easy money line up.
Where Aron Groups Fits
Aron Groups does not offer bonds or options. Wage and inflation releases still move markets it does offer: major US dollar pairs, gold on XAU/USD and index CFDs on MetaTrader 5. Prices can gap on jobs and CPI days, and leverage magnifies the move. When it restricted CFDs in 2018, the EU markets regulator reported that 74% to 89% of retail accounts typically lose money.
The economic calendar lists each release and its time, so you can plan around it rather than react. A stop-loss does not cap a loss exactly: an SEC investor bulletin warns that the stop price is not the guaranteed execution price. A Nano account, which trades from 0.01 nano lots, lets you test position sizes on data days with little at stake.
Conclusion
A wage-price spiral is a real mechanism but a rare outcome. The loop usually fades because real pay falls first, productivity absorbs part of the rise and central banks lean against it.
In 2026 the oil shock has done the first part: prices are up 3.7% and real pay is falling. Whether a wage-price spiral follows depends on pay growth, unit labour costs and long-run expectations. Those releases will say more than any single CPI print.
Frequently Asked Questions
Short answers on wage-price spirals and cost-push inflation.
What causes a wage-price spiral?
It usually starts with a shock that lifts prices, such as energy, followed by pay deals that try to restore lost purchasing power. It becomes self-sustaining when expectations come unanchored, pay is indexed to past inflation and the central bank accommodates the higher costs.
Is a wage-price spiral cost-push or demand-pull inflation?
It is classed as cost-push inflation, because higher labour costs push prices up. In practice it also needs demand to hold up, since firms can keep raising prices only if customers keep paying them.
What is an example of cost-push inflation?
The 1973 oil shock, when an Arab embargo and output cuts nearly quadrupled oil prices, is the classic case. In 2026 a new oil shock lifted US energy prices 20.4% in the year to September, while core inflation was 2.6%.
How do central banks stop a wage-price spiral?
They raise interest rates to cool demand and the labour market, and they work to keep long-run expectations anchored. The Fed raised its target range to 3.75% to 4.00% on 16 September 2026. It said the move would support a timelier return to its 2% goal.