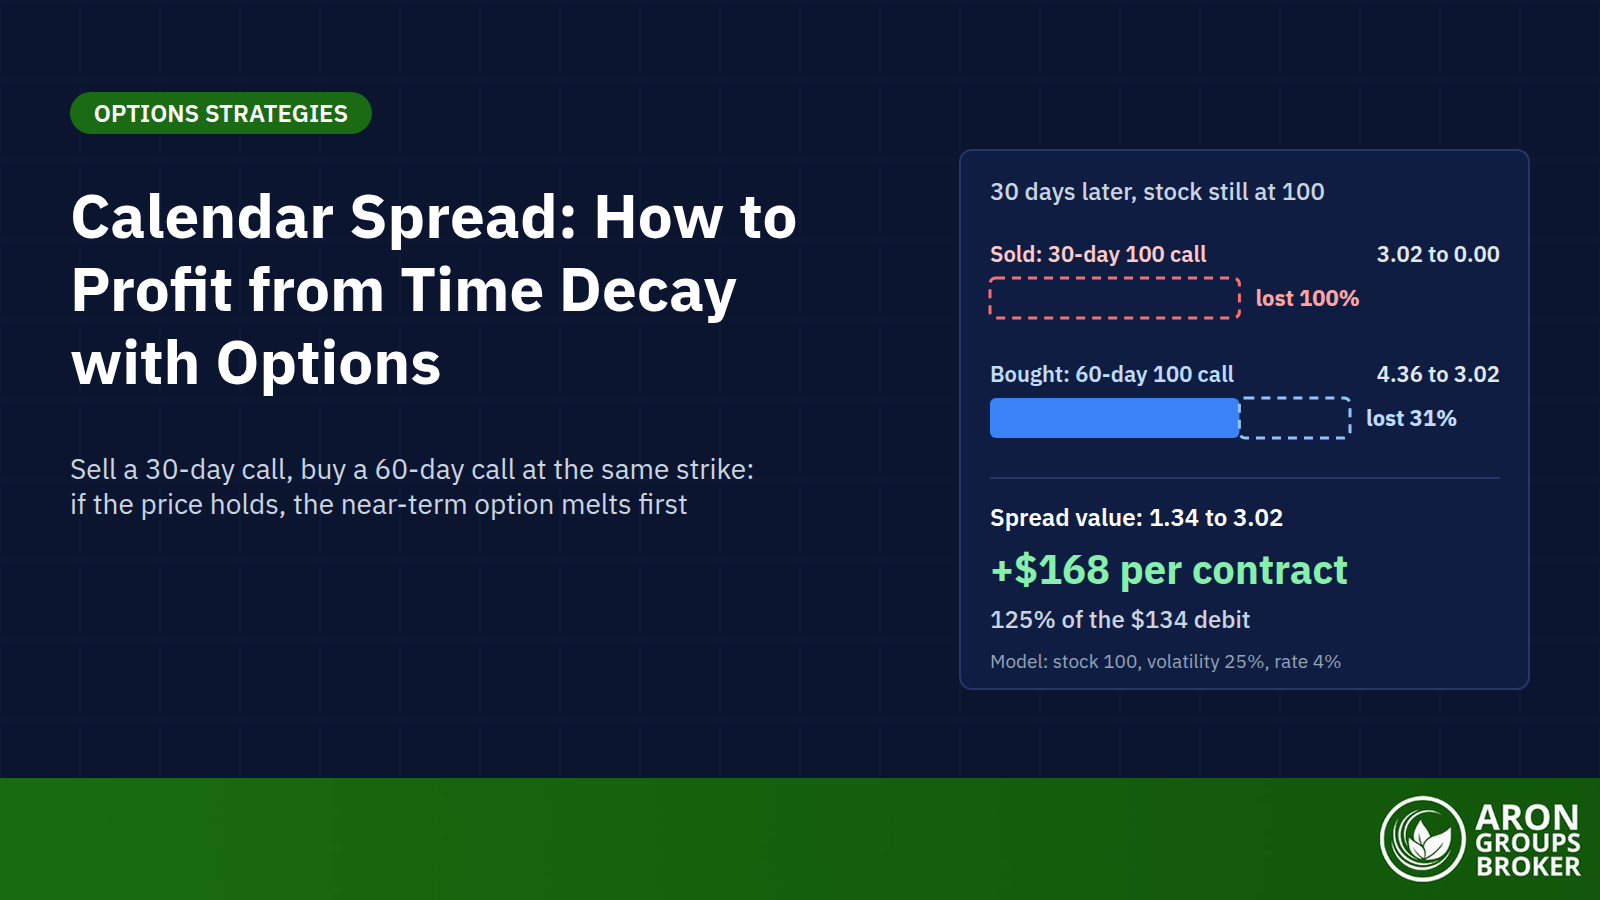

A calendar spread is an options strategy that sells a near-term option and buys a longer-dated option at the same strike price. Both legs are calls or both are puts. It is also called a time spread or horizontal spread. It profits mainly from time decay, because the near-term option loses value faster than the longer-dated one.
It matters now because implied volatility, the options market’s price for future moves, has jumped. On Friday 16 October 2026 the S&P 500 fell 1.1% and the VIX volatility index rose 21.4% to 19.99. Earnings season adds event risk: Netflix reported on 20 October, Tesla was due on 21 October and Microsoft on 28 October.
This guide prices calendar spread options on a textbook stock, a real SPY chain and a Netflix earnings setup. It also covers variants, management and limits.
- A calendar spread sells a near-term option and buys a longer-dated one at the same strike, usually for a net debit. It is also called a time spread or horizontal spread; in futures the name covers buying one delivery month and selling another.
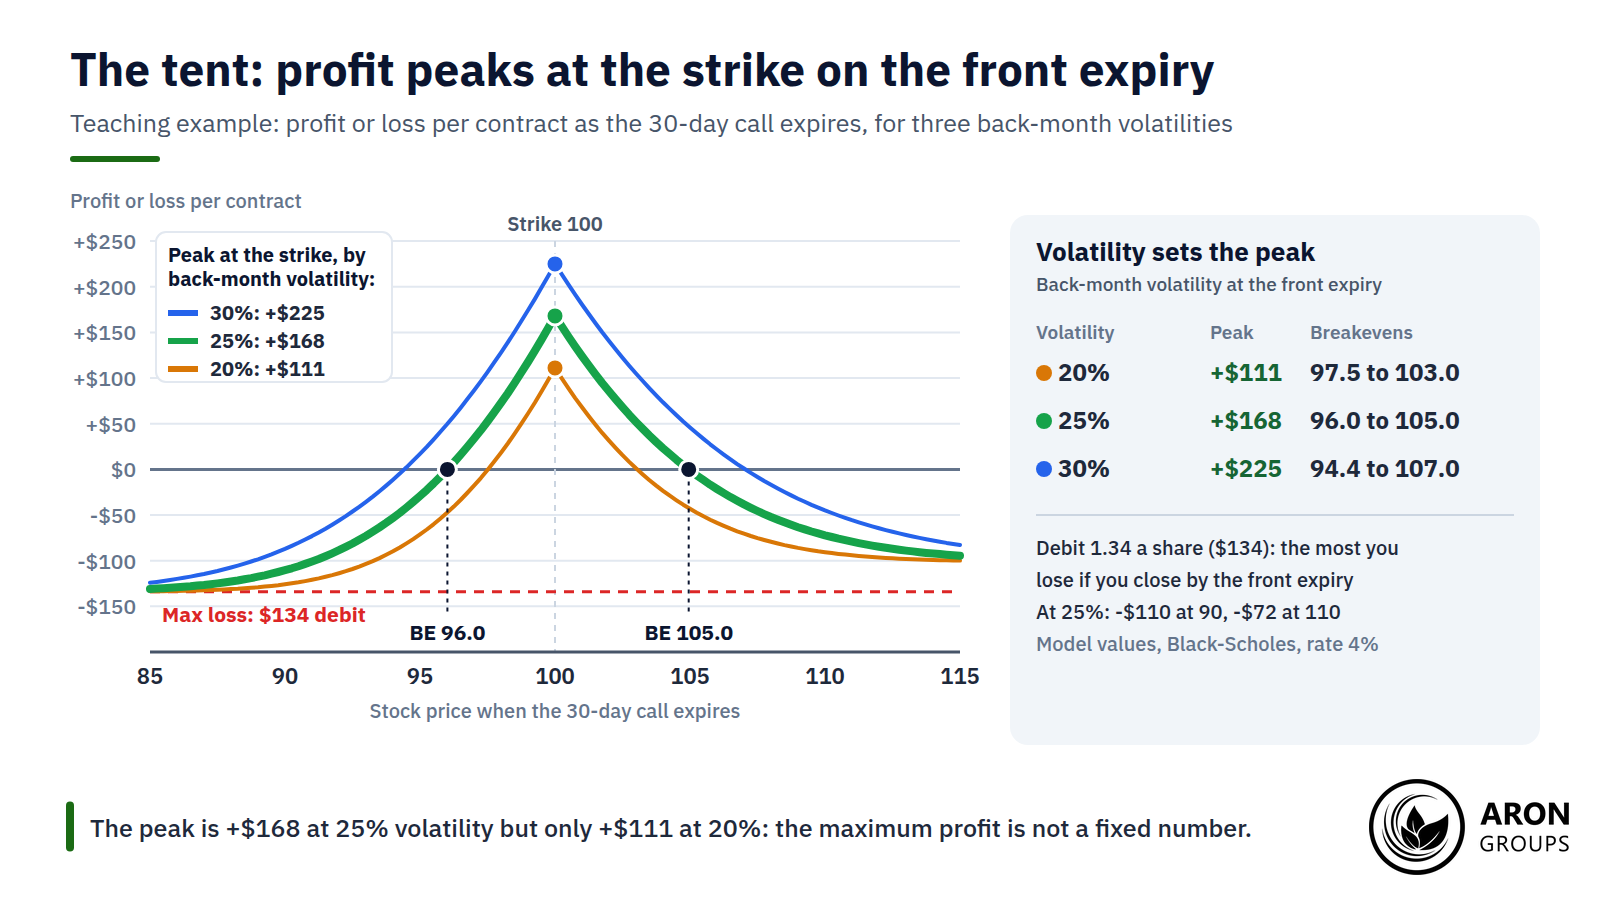
- Teaching example: sell the 30-day 100 call for 3.02 and buy the 60-day 100 call for 4.36, a 1.34 debit. If the stock and volatility hold for 30 days, the spread is worth 3.02: +$168 per contract, or 125% of the debit.
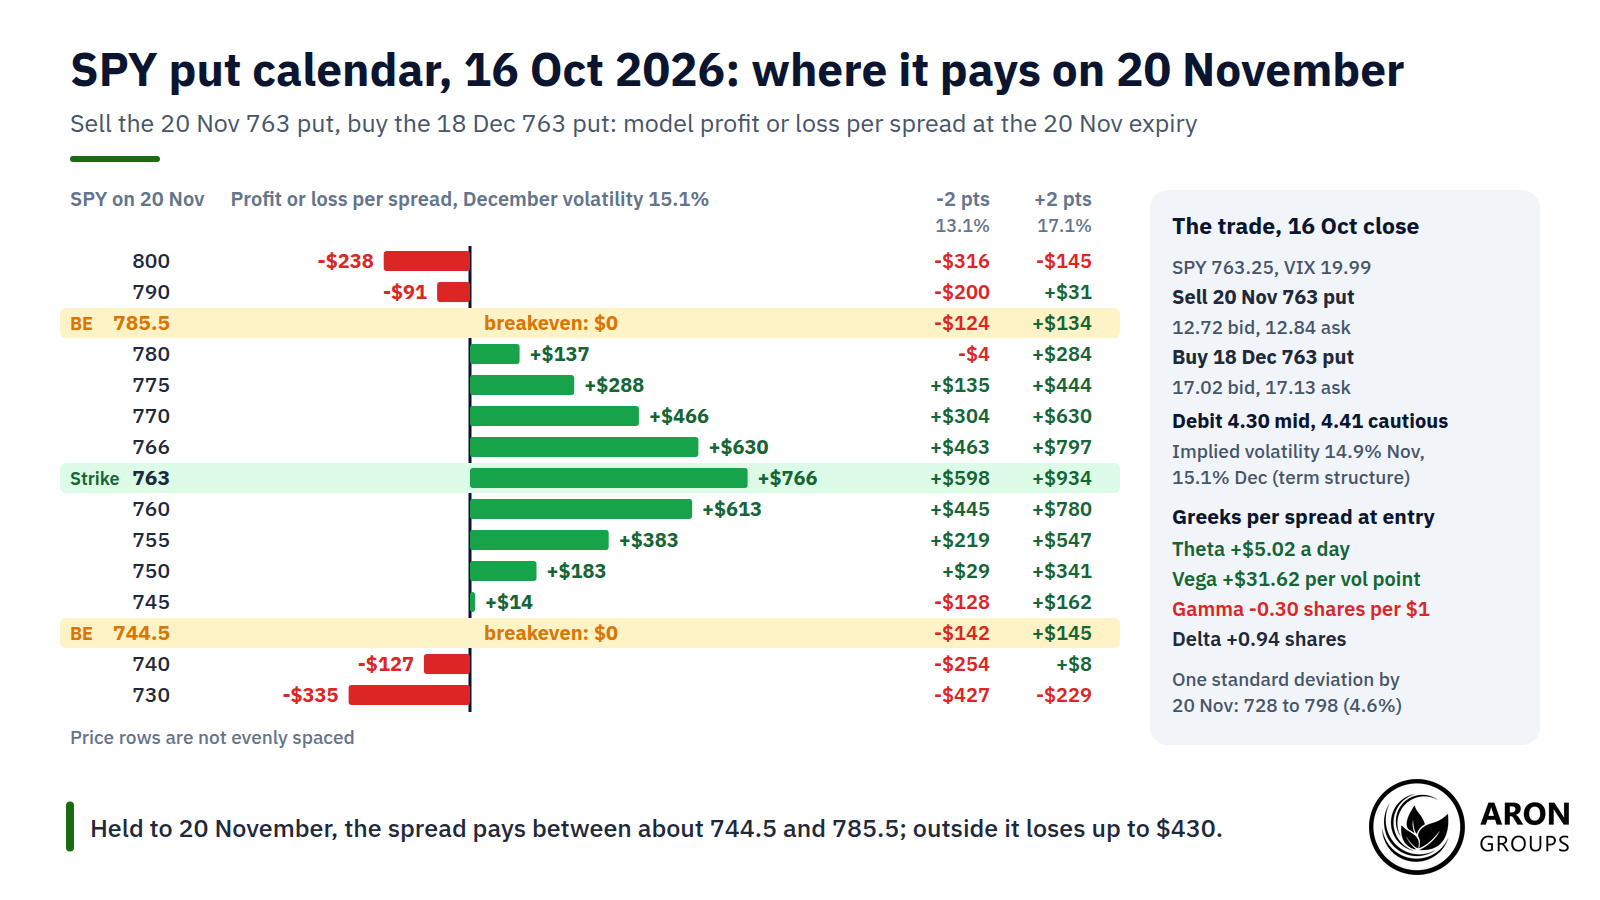
- SPY on 16 October 2026: the 763 put calendar (20 November against 18 December) cost 4.30 at mid prices. The model peak on 20 November is +$766 per spread, with breakevens near 744.5 and 785.5; two volatility points lower, it is +$598.
- Earnings calendars sell the inflated front month. On 16 October, four days before Netflix reported, its 23 October options implied 85.3% volatility against 46.8% for 20 November. The trade bets on that gap collapsing and a small move, not on rising volatility.
- The debit is normally the maximum loss, and a reverse calendar's short leg is margined as uncovered from the start. Aron Groups offers no options: index CFDs with a stop-loss are the nearest way to trade a range view.
What Is a Calendar Spread?
A standard long calendar spread sells the near-term option and buys the later one at the same strike, so it opens for a net debit. The CFTC’s glossary defines the term for two markets. In futures it means buying one delivery month and selling another. In options it means trading the same type of option, typically at one strike, across two expiries.
Risk Disclosure
Trading forex and CFDs carries a high level of risk and can result in the loss of all your capital. This content is educational and is not investment advice. Never risk money you cannot afford to lose.
How a Calendar Spread Earns From Time
Both options share a strike, so small price moves largely cancel out and the trade starts close to delta-neutral. What differs is time: an option’s premium above its intrinsic value, its time or extrinsic value, decays faster as expiry nears.
So the near-term option loses value faster, and a long calendar earns positive theta near the strike. An at-the-money option’s time value shrinks roughly with the square root of the time left, so most of the gain comes late.
Mini Example: A 100-Strike Call Calendar
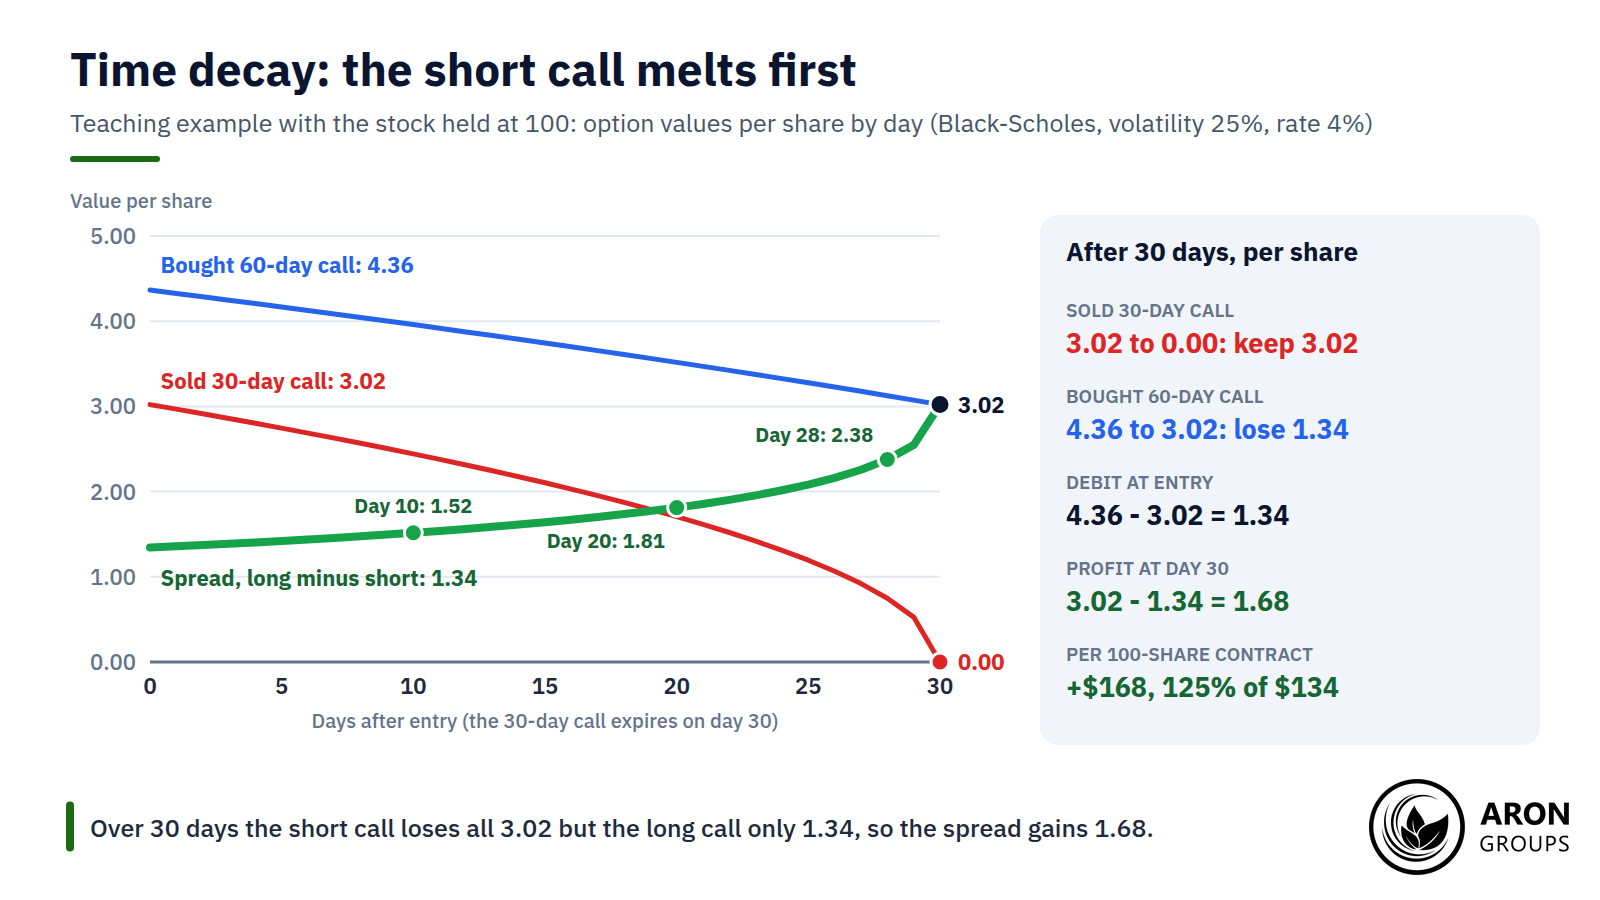
Take a stock at 100, implied volatility of 25% and a 4% rate. The Black-Scholes model values the 30-day 100 call at 3.02 and the 60-day 100 call at 4.36. Selling the first and buying the second costs a 1.34 debit, or $134 per 100-share contract.
After 30 days with the stock and volatility unchanged, the short call expires worthless, so you keep all 3.02. The long call, now a 30-day option, is worth 3.02, down only 1.34 (31%). The spread is worth 3.02: a profit of 1.68 a share, or $168 (125%).
Calendar Spreads in Futures
In futures, a calendar spread buys one delivery month and sells another, a bet on the gap between them rather than the price. The CFTC calls a curve in contango when later months trade progressively higher, and in backwardation when they trade lower. On 16 October 2026 November WTI settled at $101.41 and December at about $99.02, a backwardation of $2.39 a barrel. Spreads also tend to carry lower margins than outright futures, as CME Group’s education pages note.
Profit, Loss and the Sweet Spot
A long calendar earns its maximum profit when the price sits at the strike as the front-month option expires. The short option then expires worthless and the long one keeps all its time value: +$168 in the teaching example. Move away either way and the profit shrinks, giving the payoff its tent shape.
At 25% volatility the breakevens are about 96.0 and 105.0, and beyond them the loss grows: $110 at 90 and $72 at 110. The maximum loss is the $134 debit, approached when both options end far out of the money. Deep in the money, the model loss levels off near $101, because the long call keeps some interest value.
Why the Maximum Profit Is Not Fixed
The peak depends on the long option’s value at the front expiry, and so on implied volatility then. At 20% the peak is $111 and the breakevens narrow to 97.5 and 103.0. At 30% it is $225, with breakevens of 94.4 and 107.0. Any quoted maximum profit is a model estimate.
When the Loss Can Exceed the Debit
The debit normally caps the loss, but assignment can add costs on top. Single-stock options are American-style, and the Options Industry Council notes that calls are generally assigned early around ex-dividend dates. You would then be short 100 shares and owe the dividend, though the long call still hedges the price.
At expiry, OCC’s exercise-by-exception rule exercises an equity option a cent in the money unless the holder says otherwise. A short leg that finishes just in the money therefore leaves a stock position, which needs margin and, if short, owes any dividend. Hold the long leg past the front expiry and you own an outright option whose 3.02 of value can vanish. The loss from entry still stops at the 1.34 debit.
Long, Short and Double Calendar Spreads
A call calendar spread and a put calendar spread at the same strike have almost the same payoff. They differ mainly on dividends and early exercise. Long and short refer to the later expiry: a long calendar buys it, a short or reverse calendar sells it.
The Short (Reverse) Calendar Spread
A short calendar buys the near-term option and sells the later one for a credit, 1.34 in the teaching example. It profits from a big move or falling implied volatility, and its maximum gain is the credit. With both legs open, it loses most if the stock sits at the strike at the front expiry: about $168 in the teaching example. Once the 30-day call expires, the short call is naked, and the Options Industry Council lists the call version’s maximum loss as unlimited.
Cboe’s spread margin rules, as amended with SEC approval in 2012, say the long option may not expire before the short one. So the short 60-day call is margined as uncovered from day one: about $2,436, its premium plus 20% of the stock’s value. That is 18 times the credit.
The Double Calendar Spread
A double calendar pairs a put calendar below the price with a call calendar above it. On the teaching stock, 97 and 103 calendars cost 2.22, against 1.34 for one 100 calendar, and widen the breakevens to about 95.1 and 106.2. Profits between the strikes run from about $98 to $163. Like a short strangle, it profits from a range, but if closed in time it can lose only the debit.
Calendar vs Vertical vs Diagonal Spreads
A vertical spread uses two strikes and one expiry, so it is directional. A calendar uses one strike and two expiries, so it trades time and volatility. A diagonal spread uses both, adding a directional lean. Buying the 60-day 100 call and selling the 30-day 105 call costs 3.19: the calendar’s 1.34 plus the 100/105 vertical’s 1.85.
A working paper published by the SEC’s economics division found verticals made up 36% of complex stock-option volume in 2016 to 2018. Plain calendars made up about 9%, and many calendar and diagonal trades appeared to roll positions to later expiries. The table compares five structures.
| Strategy | Strikes | Expiries | Debit or credit | View | Main Greeks | Maximum loss |
|---|---|---|---|---|---|---|
| Long calendar | Same: 100 | Sell 30-day, buy 60-day | Debit 1.34 | Neutral, price near 100 | Long theta and vega, short gamma | $134 if closed by the front expiry |
| Short calendar | Same: 100 | Buy 30-day, sell 60-day | Credit 1.34 | Big move or falling volatility | Short theta and vega, long gamma | Unlimited once the 30-day call expires |
| Bull call vertical | Buy 100, sell 105 | Both 30-day | Debit 1.85 | Bullish | Long delta, short theta | $185 |
| Call diagonal | Buy 100, sell 105 | Sell 30-day, buy 60-day | Debit 3.19 | Mildly bullish | Long delta, theta and vega | $319 if closed by the front expiry |
| Double calendar | 97 put and 103 call | Sell 30-day, buy 60-day | Debit 2.22 | Neutral, wider range | Long theta and vega, short gamma | $222 if closed by the front expiry |
Black-Scholes model, stock at 100, volatility 25%, rate 4%; losses per 100-share contract.
A Real-Scale Calendar Spread on SPY
On Friday 16 October 2026 SPY, the S&P 500 exchange-traded fund, closed at 763.25. A put calendar at the 763 strike sells the 20 November put (35 days) and buys the 18 December put (63 days). Optionistics’ free end-of-day data quote them at 12.72 bid, 12.84 ask and 17.02 bid, 17.13 ask.
The debit is 4.30 at mid prices, or $430 per spread, and 4.41 if you buy at the ask and sell at the bid. Implied volatility, solved from the mids, is 14.9% for November and 15.1% for December: an almost flat term structure despite the VIX jump.
Holding December volatility at 15.1%, the model puts the 20 November profit at $766 per spread at 763, with breakevens near 744.5 and 785.5. Two volatility points lower, the peak is $598 and the breakevens 749.2 and 779.9. Two points higher, it is $934, with 739.7 and 791.5.
The 763 call calendar cost 5.89, yet its modelled profit at the strike is within a cent of the put version’s. The extra cost is carry, earned back by the front expiry.
The Greeks in Plain Words
At entry the spread is close to delta-neutral, at +0.94 shares. Theta, the daily time decay, is +$5.02, or 1.2% of the debit. Vega is +$31.62 per volatility point because December’s vega (+$125.40) outweighs November’s (-$93.79), so one point is worth about six days of theta.
Gamma, the rate at which delta changes, is -0.30 shares per dollar: the opposite of the long-gamma position that gamma scalpers hold. With SPY at the strike, the model’s gamma reaches -1.40 with seven days left and -2.61 with three. Theta rises to +$25.78 and +$51.70.
Why a Calendar Spread Is Long Vega
The longer-dated option has more vega, so a calendar gains when both months’ implied volatility rises equally and loses when it falls equally. A 2-point parallel drop would cost the SPY spread about $63, more than 12 days of theta. Volatility rarely moves in parallel, though.
Key Point
For the SPY spread to gain from volatility, December must rise at least three-quarters as much as November. The two legs' vegas are -$93.79 and +$125.40. Between 9 and 16 October, at-the-money volatility rose 1.9 points for November and only 1.4 points for December. Applied to the spread's vegas, that move would have cost about $10 per spread, even though volatility rose.
The Earnings Calendar: A Bet on the Term Structure
Traders are often told to buy calendars into earnings because volatility may rise. The usual earnings calendar instead sells the first expiry after the report, whose volatility the event inflates. A BIS study of swaption markets found implied volatility tends to fall once a scheduled US data release has passed. Earlier research it cites found volatility rises in the days before.
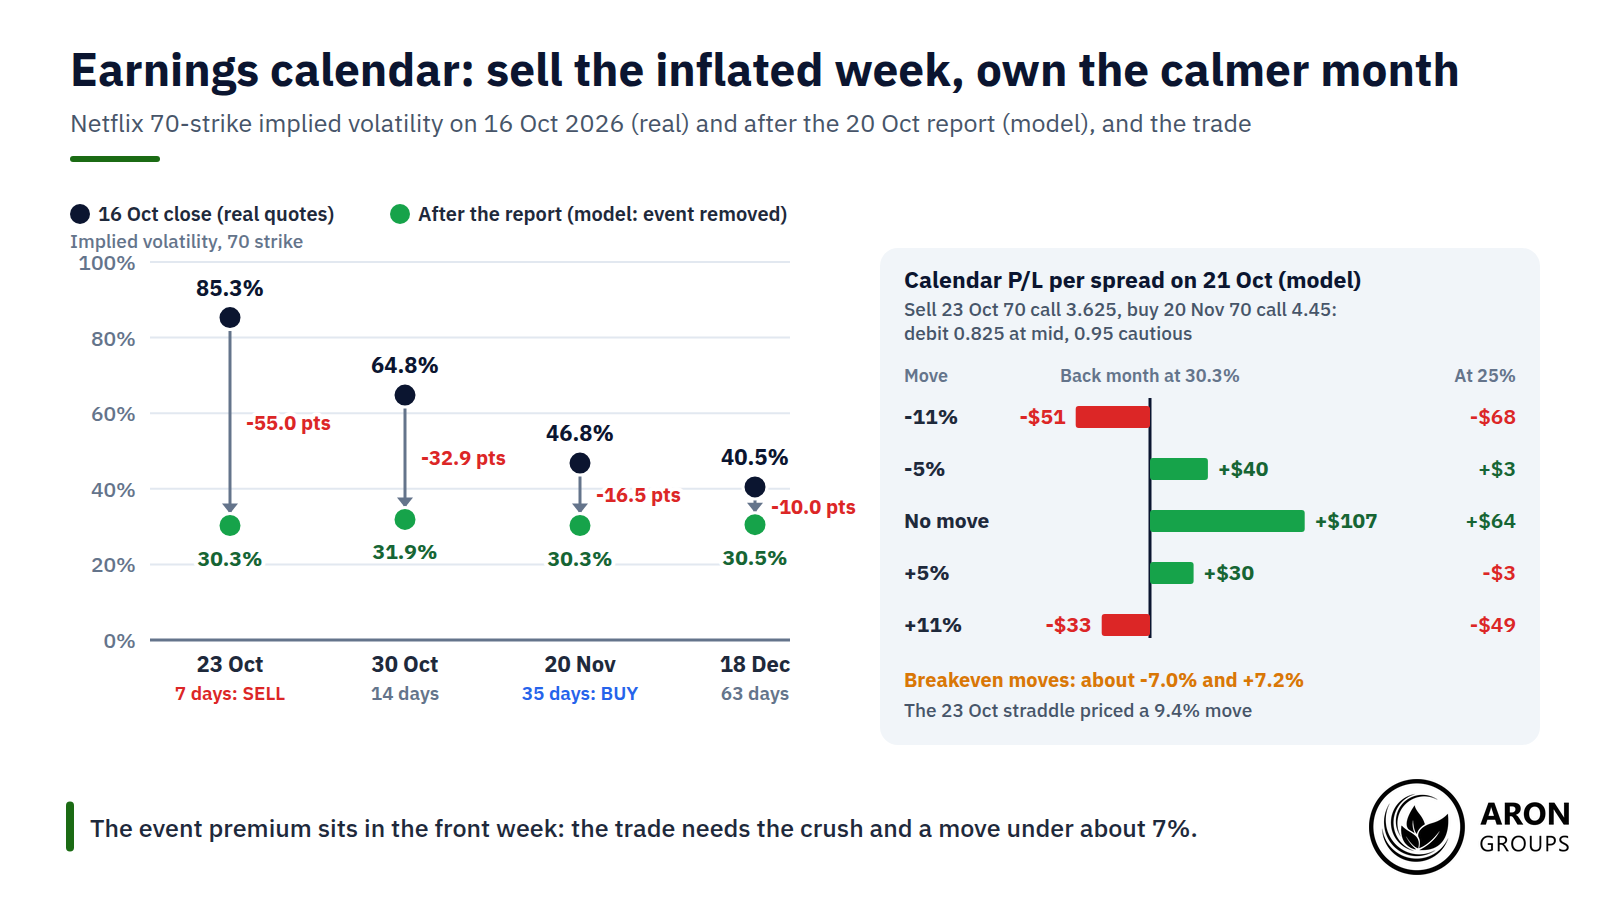
On 16 October 2026, four days before Netflix’s 20 October report, its 70-strike options implied 85.3% volatility for 23 October. The 20 November options implied 46.8% and the 18 December options 40.5%. On a simple variance split, the curve prices a one-day move of about 11% on top of 30% normal volatility.
Selling the 23 October 70 call at its 3.625 mid and buying the 20 November call at 4.45 costs 0.825 ($82.50). If an IV crush pulls both months to 30.3% by the 21 October close, the model gives +$107 on an unchanged stock. A 5% move either way leaves $30 to $40. An 11% fall loses $51, and with November at 25% the flat-stock profit shrinks to $64.
So the trade bets on the front month’s event premium vanishing while the stock barely moves, not on volatility rising. The front-week straddle priced a 9.4% move, yet the trade loses beyond about 7%. A version whose short leg expires before the report does bet on rising volatility, and must be closed before it.
How to Manage a Calendar Spread
The calendar spread strategy suits a view that the price stays near one level and volatility holds or rises. It is cheapest when the front month is rich against the back month, as before earnings. Check the economic calendar for events inside the short leg’s life, such as the Fed’s 27 and 28 October meeting. Liquidity varies by strike: on 16 October the 20 November 765 put had open interest of 19,795 contracts, against 2,022 at 763.
A typical exit plan closes the trade if the price leaves the tent, near 744.5 or 785.5 for the SPY spread. It also takes profits before the front expiry. To roll, buy back the expiring short option and sell a later one at the same strike, collecting new premium but extending the risk.
Q: Should I hold a calendar spread until the short option expires?
A: Usually not. At the strike, model theta rises from $5 a day at entry to $52 with three days left, and gamma from -0.30 to -2.61. A modest late move can erase days of that income, and a short option a cent in the money is likely to be assigned. Closing or rolling a few days early gives up some theta to avoid that.
The Honest Limits of the Calendar Spread
A calendar spread is a volatility forecast as much as a price forecast. A 2-point fall in December volatility cuts the SPY peak from $766 to $598. The tent is narrow: its breakevens sat 2.5% below and 2.9% above the 16 October close, inside a 4.6% one-standard-deviation move. A lognormal model put the chance of finishing between them at about 44%.
Costs bite with two legs to open and two to close. Crossing the bid-ask spread lifted the SPY debit 2.7% and the Netflix debit 15%, before commissions. Earnings gaps also arrive while the options market is shut, because Netflix reports after the close.
The figures are Black-Scholes estimates that ignore skew, the extra put volatility a risk reversal measures, and understate fat tails. Assignment, pin and gamma risk cluster at the front expiry, and you need an options-approved account. Access to US-listed options also varies by country, and users in restricted regions face added legal, access and custody risk.
Where Aron Groups Fits
Aron Groups does not offer options or exchange-traded futures, so there is no calendar spread to trade. The view behind one, a price holding a range while time passes, maps onto index CFDs such as SPXUSD, NDXUSD and DJIUSD on MetaTrader 5. A trader might buy near the floor or sell near the ceiling. A stop-loss goes beyond the range, and the stop distance sets the position size.
A CFD has no time decay to collect, so a quiet range earns nothing by itself, and overnight swaps can cost the holder. The Nano account discounts swaps, with 6 swap-free days on indices. A margin call comes at a 100% margin level and stop-out at 50%, or 40% on Islamic and VIP accounts. The economic calendar flags volatility events, and a demo account lets you practise first.
Conclusion
A calendar spread is a bet that time passes faster than the price moves. The option it sells decays faster than the one it buys, so it pays best with the price at the strike at the front expiry.
It is also a volatility position, so read the term structure as closely as the chart. Pricing it with real quotes, sizing it for the full debit and closing before the front expiry keep both risks in view.
Frequently Asked Questions
Short answers to common calendar spread questions.
Is a calendar spread bullish or bearish?
Neither at the money: it is neutral and wants the price near the strike at the front expiry. A strike above the price adds a mild bullish lean; one below, a bearish lean.
What is the maximum loss on a calendar spread?
Normally the net debit: $134 in the teaching example and about $430 on the SPY spread. Dividends owed after an early call assignment can add to it. Deep in-the-money put calendars on European-style index options can lose slightly more.
Are calendar spreads good for earnings?
They can, if you understand the bet. The usual version sells the inflated first expiry after the report. It profits if the crush hits that leg harder than the back month and the stock moves less than the options expected.
What is the difference between a calendar spread and a diagonal spread?
A calendar uses one strike for both options; a diagonal uses two strikes as well as two expiries. In the teaching example the diagonal costs 3.19, the calendar’s 1.34 plus a 1.85 vertical, and adds a bullish lean.