
icon icon Home
icon icon Accounts
icon icon Quick start
icon icon Symbols

The Consumer Confidence Index (CCI): How It Is Measured, What It Signals, and How It Moves the Dollar and Gold

Author
Abe Cofnas
Abe Cofnas
calendar Last update: 22 October 2026
watch Reading time: 9 min

The consumer confidence index is a monthly survey measure of how optimistic or pessimistic US households feel about business conditions, jobs and their own income. The Conference Board publishes the main US version, scaled so that the 1985 average equals 100. It is not the Commodity Channel Index, a technical indicator that shares the CCI abbreviation.

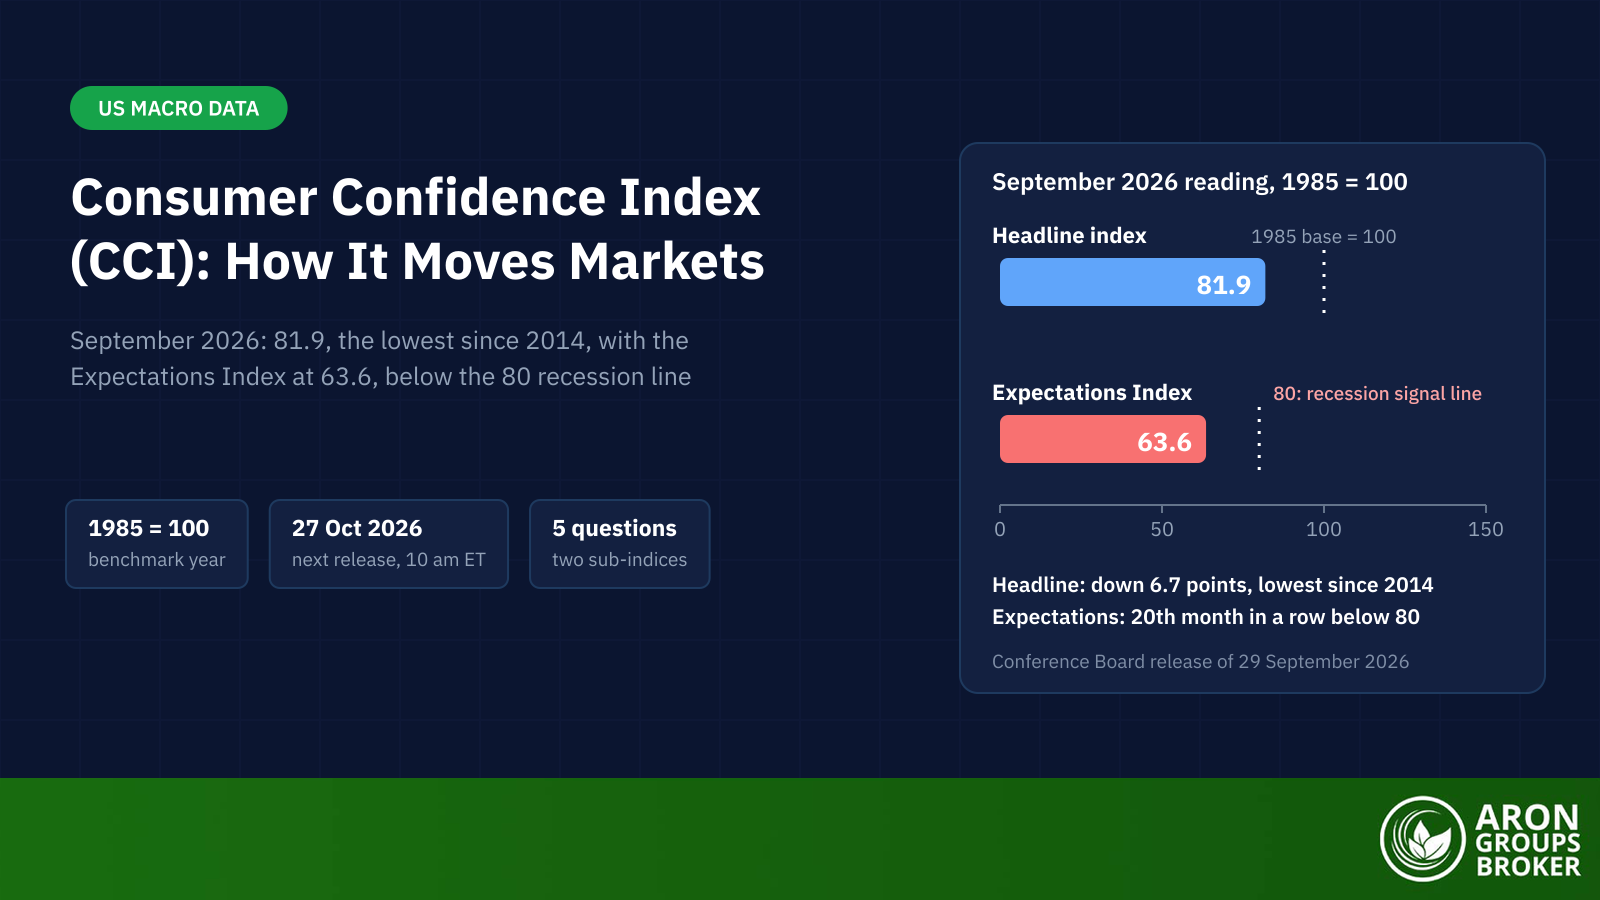
It matters now because confidence has slumped while the Fed is tightening. On 29 September 2026 the index fell 6.7 points to 81.9, its lowest reading since 2014. The drop came less than two weeks after the Fed raised its target range to 3.75% to 4.00%. The Expectations Index fell to 63.6, far below the 80 level that the Conference Board says usually signals a recession ahead.

This guide shows how five survey questions become the headline and its two sub-indices, and how to read a release against consensus. It then compares the gauge with Michigan sentiment, traces a surprise through to the dollar, gold and index CFDs, and sets out the limits.

bookmark
Key Takeaways
  • The Conference Board's Consumer Confidence Index averages five question indexes, each scaled so the 1985 average equals 100; two questions form the Present Situation Index and three form the Expectations Index.
  • In September 2026 the headline fell to 81.9 from a revised 88.6, against a consensus of 89.2; the Present Situation Index was 109.3 and the Expectations Index 63.6.
  • Expectations has been below 80, the level the Conference Board says usually signals a recession ahead, in every month since February 2025, and no recession has been dated so far.
  • In September 2026 the Michigan sentiment index stood at 48% of its February 2020 level, against 62% for the Conference Board index, a gap that opened in 2022.
  • Reactions run through Fed expectations, not the headline alone: on 29 September 2026 a 7.3-point miss cut the 2-year yield to 4.89% and lifted gold about 1.4%, yet the dollar index rose.

What Is the Consumer Confidence Index?

The consumer confidence index is a survey-based gauge of household mood about the economy. Each month the Conference Board, a non-profit research group, asks US consumers five questions about business conditions, jobs and income, now and six months ahead. The answers are scored and averaged into one number, where 100 equals the 1985 average. Higher readings mean consumers are more positive than in 1985; lower readings mean less positive.

sms-star

Risk Disclosure
Trading forex and CFDs carries a high level of risk and can result in the loss of all your capital. This content is educational and is not investment advice. Never risk money you cannot afford to lose.
Not the Commodity Channel Index

The abbreviation causes confusion. The Commodity Channel Index is a technical oscillator that measures how far a price has moved from its average. It has nothing to do with surveys. This article covers the economic indicator only; the chart tool has its own guide.

Who Publishes It and When

The Conference Board has run the survey since 1967 and monthly since June 1977. It publishes the index at 10:00 am Eastern on the last Tuesday of each month; the October 2026 report is due on 27 October.

Since May 2021 the survey has been an online panel run by Toluna, with a target of 3,000 responses. The September 2026 cut-off was 23 September, and each month’s figure is revised in the next release.

How the Conference Board Builds the Index

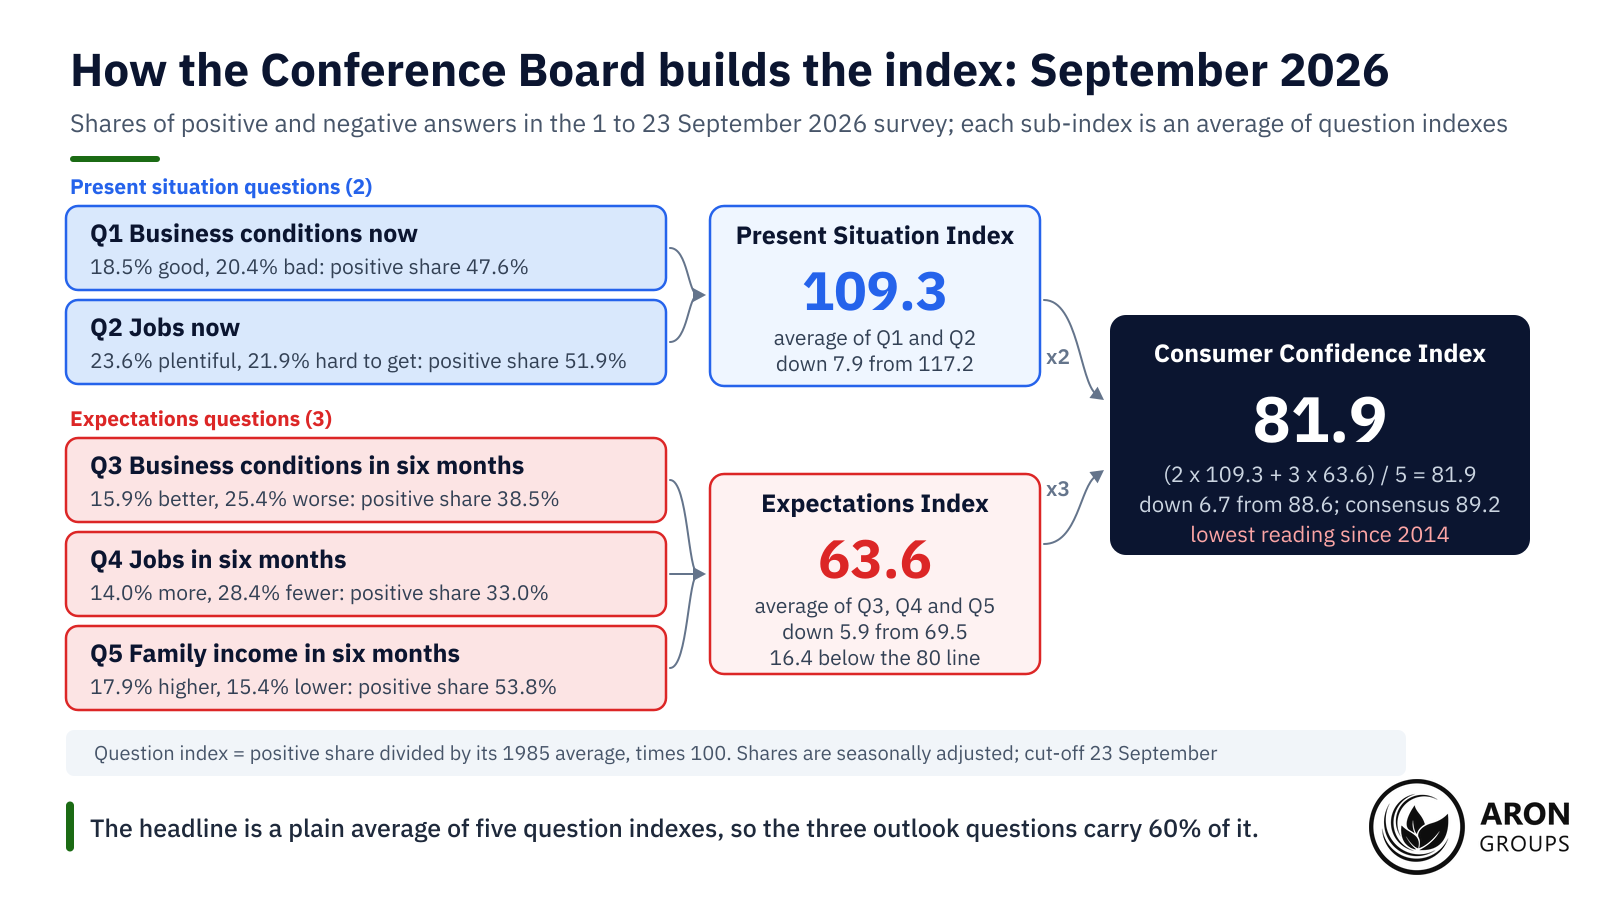
The index is built from five questions with three possible answers each: positive, negative or neutral. Two ask about the present: current business conditions, and whether jobs are plentiful or hard to get. Three ask about six months ahead: business conditions, employment and total family income. The Present Situation Index averages the first two, the Expectations Index the last three, and the headline averages all five.

The scoring is simple. For each question the Conference Board divides the share of positive answers by the sum of positive and negative answers, ignoring neutral replies. That relative value is divided by its own 1985 average and multiplied by 100, after seasonal adjustment. In September 2026, 18.5% of respondents called business conditions good and 20.4% called them bad, so the positive share was 47.6%.

The headline is a plain average of five question indexes, so the three outlook questions carry 60% of its weight.

Why the Two Sub-Indices Matter

The two halves measure different things. The Present Situation Index tracks current business and labour conditions, so it tends to hold up until jobs weaken. The Expectations Index is the forward-looking part and usually turns first.

Mini Example: Reading the September 2026 Release

Start with the three numbers published on 29 September 2026: headline 81.9, Present Situation Index 109.3 and Expectations Index 63.6. August was revised down to 88.6 from 89.4. The consensus forecast was 89.2, so the headline missed by 7.3 points and fell 6.7 points on the month.

Check the arithmetic: (2 x 109.3 + 3 x 63.6) / 5 = (218.6 + 190.8) / 5 = 81.9. The sub-indices and the headline agree. Then apply the 80 test: Expectations at 63.6 is 16.4 points below the threshold, the 20th month in a row beneath it.

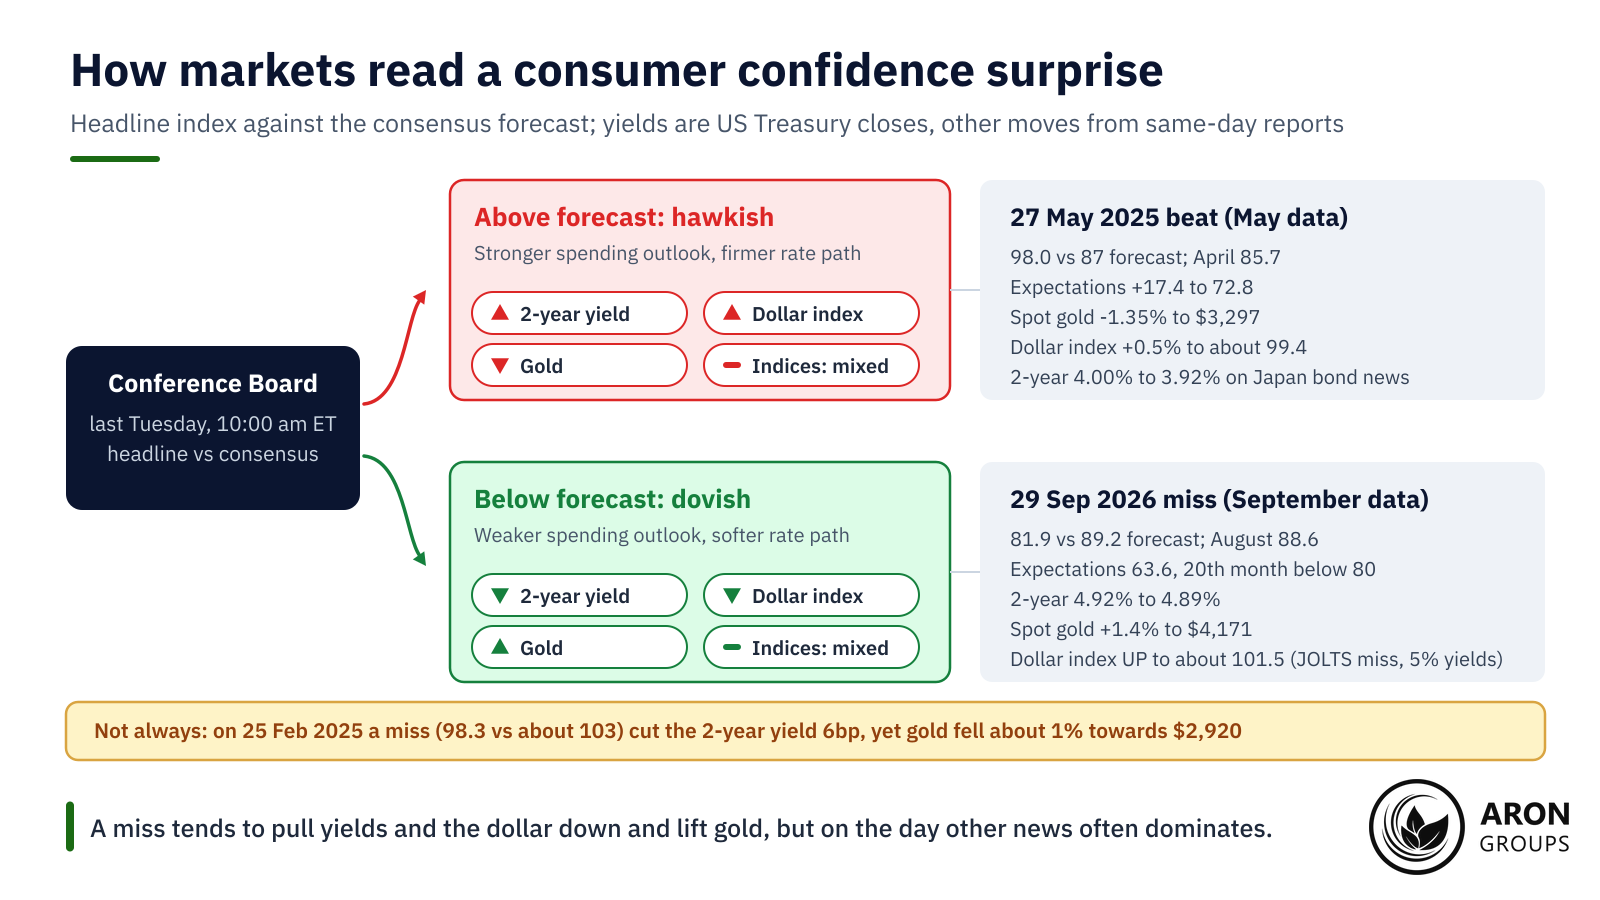
Finally, read the market. The 2-year Treasury yield slipped from 4.92% to 4.89% and spot gold rose about 1.4% to a session high of $4,171. The dollar index still climbed to about 101.5. Long yields kept rising, with the 10-year at 5.26%, and traders still priced a possible further hike by December.

How to Read a Consumer Confidence Report

Read a consumer confidence report in four steps. Compare the headline with the 1985 baseline of 100, then with the consensus forecast and the revised prior month. Then check the gap between the two sub-indices. Markets move on the surprise: a 92 that beats an 88 forecast is bullish for the dollar even though it sits below 100.

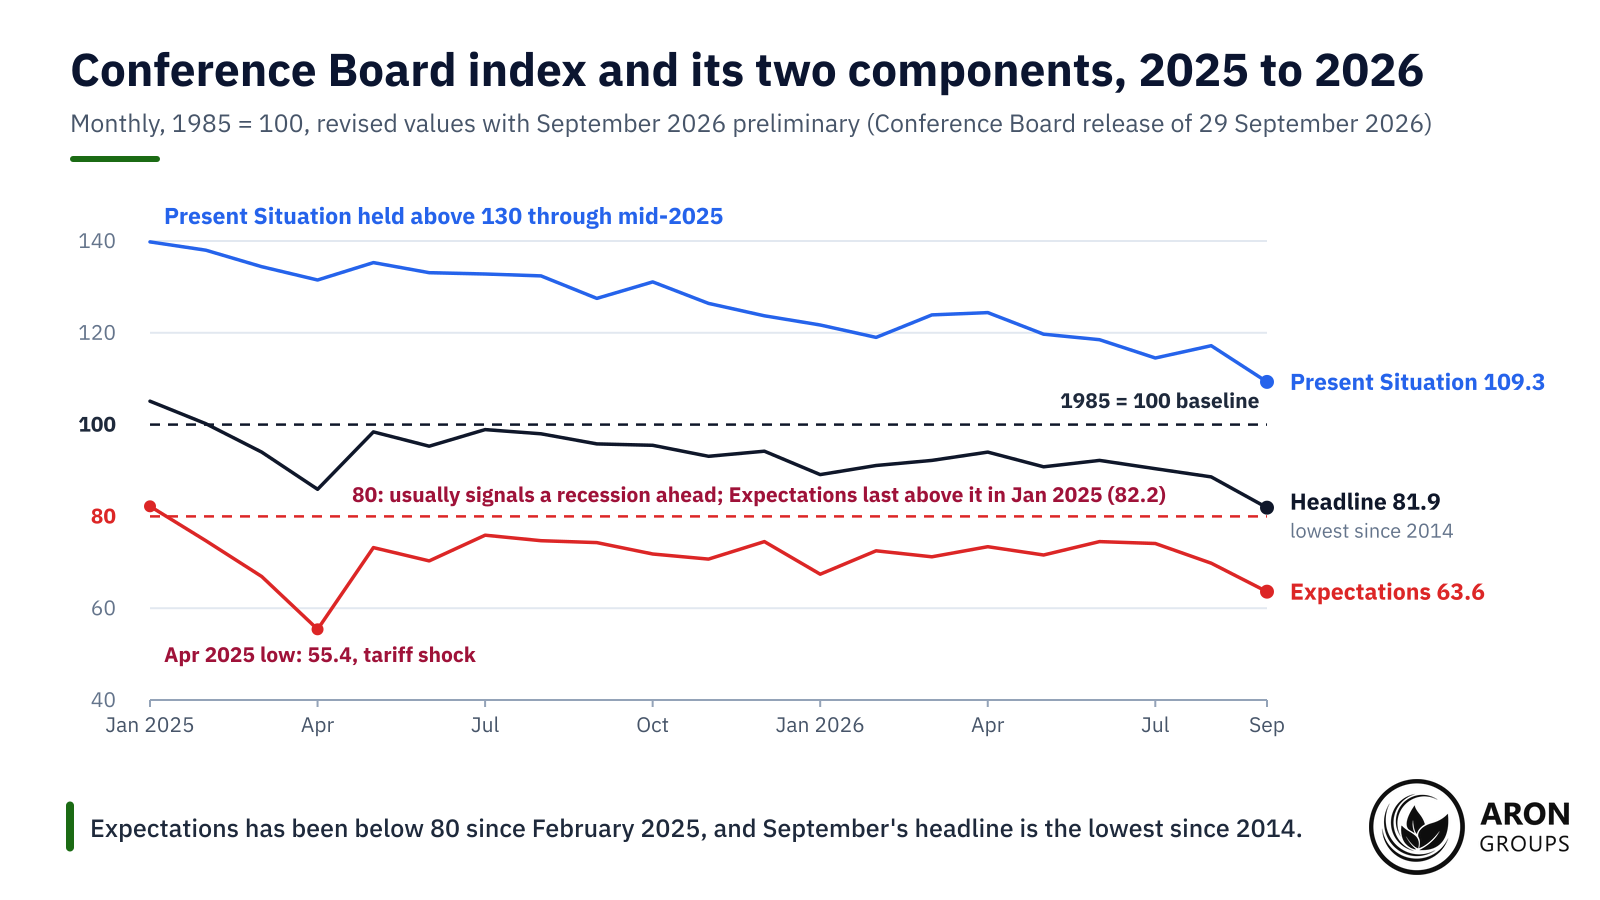
The trend and the sub-index gap carry the longer message. The index peaked at 112.8 in November 2024, a four-year high. It then fell through the tariff shock of April 2025 and the war-driven inflation of 2026. The Present Situation Index held above 130 through August 2025 while Expectations fell below the 80 line that the Conference Board watches for recession risk.

Expectations has been below 80 since February 2025, and September's headline is the lowest since 2014.

The 80 Line on the Expectations Index

The Conference Board states the rule itself: an Expectations Index below 80 usually signals a recession ahead. Its July 2023 wording was a recession within the next year. The record is mixed. The sub-index spent most of mid-2022 to mid-2023 below 80 and has been there again since February 2025. Yet the NBER’s business cycle chronology still lists April 2020 as the most recent trough. Treat the line as a warning of elevated risk, not a forecast.

sms-star

Key Point
The market trades the surprise (actual minus consensus) and the revision to the prior month. The level matters for the trend and for the 80 test on Expectations, not for the release-minute move.
Reading the Chart Against History

The all-time high was 144.7 in 2000 and the record low 25.3 in February 2009. The index stood at 132.6 in February 2020, fell to 85.7 in April 2020 and recovered above 125 by mid-2021. September 2026’s 81.9 is below the pandemic trough, hence the headlines about the weakest reading since 2014.

Conference Board CCI vs Michigan Consumer Sentiment

The US has two widely watched confidence gauges, and they often disagree. The Conference Board index leans on the labour market, with two of its five questions about jobs. The University of Michigan’s Index of Consumer Sentiment, or Michigan consumer sentiment, asks about personal finances, buying conditions and business prospects. It reports inflation expectations separately. The table sets out the differences, with the UK’s GfK survey for comparison.

FeatureConference Board CCIMichigan consumer sentimentUK GfK consumer confidence
PublisherThe Conference BoardUniversity of Michigan Surveys of ConsumersGfK, an NIQ company
SampleOnline panel (Toluna), target of 3,000 responses; cut-off about a week before releaseAbout 1,000 online interviews a month, address-based sampling2,000 people aged 16 and over; fieldwork in the first half of the month
QuestionsFive: business conditions and jobs now; business, jobs and income in six monthsFive: own finances versus a year ago and a year ahead; business conditions over one and five years; buying conditions for major itemsFive: own finances and the general economy, past and next 12 months; major purchase climate
LeaningLabour marketPersonal finances and prices (inflation expectations reported separately)Personal finances and the economy
Scale1985 = 1001966 = 100Net balance from -100 to +100
ReleaseLast Tuesday of the month, 10:00 am ETPreliminary mid-month, final end-month, 10:00 am ETMonthly, usually in the second half of the month
Latest reading81.9 (September 2026, released 29 September)46.3 preliminary (October 2026, released 9 October); 48.1 September final-13 (September 2026, released 25 September)
Next release27 October 202623 October 2026 (final October)23 October 2026

The three main consumer confidence gauges compared. Sources: The Conference Board, University of Michigan Surveys of Consumers and GfK/NIQ, releases of 25 September to 9 October 2026.

The UK reading shows why confidence gauges are national stories. GfK’s index rose one point to -13 in September 2026, a third straight rise and a two-year high, as US confidence hit a 12-year low.

The 2022 to 2023 Divergence

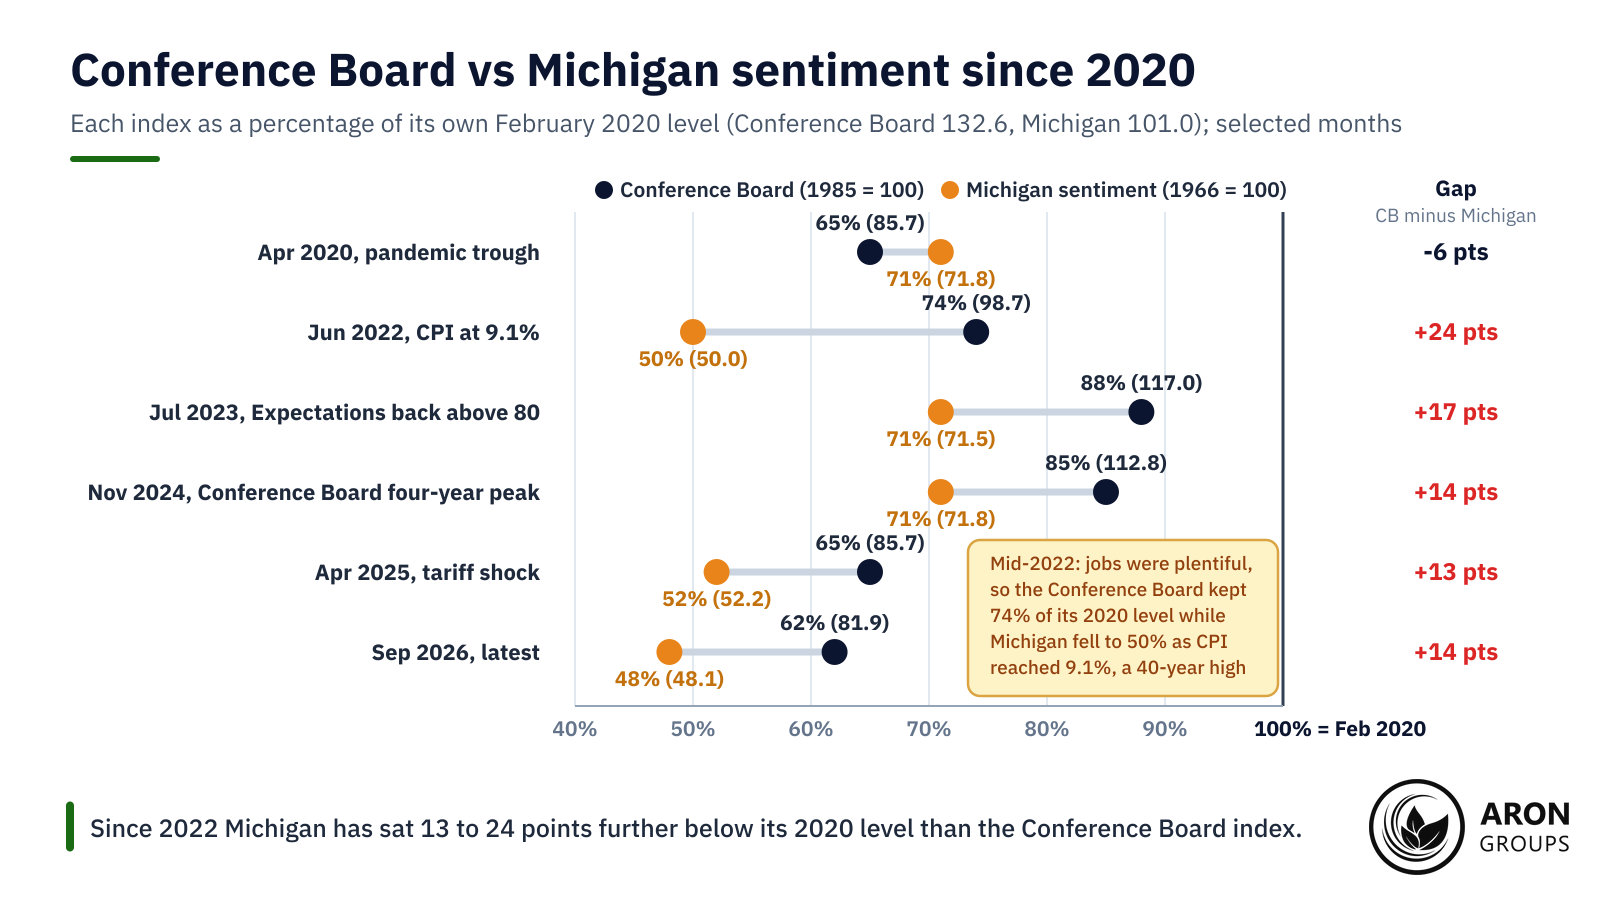
The clearest split came in 2022. In June 2022 consumer prices were up 9.1% over the year, according to the BLS. Michigan sentiment hit 50.0, then a record low and half its February 2020 level. The Conference Board index was 98.7, about 74% of its pre-pandemic level, because its Present Situation Index stayed at 147.1 on plentiful jobs. By July 2023 the Conference Board gauge was back at 117.0 while Michigan was still 29% below its 2020 level.

Since 2022 Michigan has sat 13 to 24 points further below its 2020 level than the Conference Board index.

Two further differences explain part of the gap. Michigan moved from telephone to online interviews during 2024. The university’s own analysis found the web sample reads about 6.6 points lower, while Yale Budget Lab economists put the effect near 9 points. Michigan also publishes results by party. Its February 2024 study found the partisan gap in expectations reached 53.1 points under the 2017 to 2021 Trump administration and 44.6 under Biden.

Why Consumer Confidence Moves Markets

Consumer confidence moves markets because household spending is the engine of US output. Personal consumption ran at $21.99 trillion a year in the second quarter of 2026, 67.5% of GDP on BEA data. If confidence foreshadows spending, it foreshadows growth, and growth expectations feed straight into the expected path of the federal funds rate.

The transmission runs through the Fed. A stronger-than-expected reading suggests firmer spending and inflation, so traders price more hikes or fewer cuts than the Fed’s own dot plot shows. The 2-year Treasury yield rises, the dollar firms and rate-sensitive assets wobble. A weak reading does the opposite. As an SEC investor bulletin notes, when market interest rates rise, prices of fixed-rate bonds fall, so bondholders feel a hawkish surprise first.

In 2026 the Fed calls inflation too high, which sharpens the rates channel. The September survey window included the 16 September hike. The share expecting higher interest rates within a year jumped 5.2 points to 68.4%, and average 12-month inflation expectations rose to 6.1%. Such a weak reading with such high inflation expectations argues for easing on growth and tightening on prices at once.

CCI and Gold

Gold reacts to the index through the same two channels: rate expectations and risk appetite. Weak confidence that pulls yields down lowers the opportunity cost of holding gold, and a risk-off mood adds safe-haven demand. Strong confidence that lifts the dollar and real yields tends to weigh on it, as the main drivers of gold show.

The pattern is a tendency, not a law. On 25 February 2025 a sharp miss cut the 2-year yield by 6 basis points. Gold still fell about 1% towards $2,920, having set a record the day before. The same logic applies to CPI and gold: the reaction depends on how the number shifts Fed expectations, not on the number alone.

How Traders Use the Consumer Confidence Release

Traders treat the release as a scheduled event with a known consensus. Note the date and forecast, compare the actual with consensus and the revised prior, and check whether Expectations crossed 80. Then judge the surprise in proportion, the way the Citi Economic Surprise Index scores data against expectations.

Confidence is confluence, not a standalone signal. It arrives after the month’s payrolls, CPI and retail sales, so it mostly confirms or questions what the hard data said. The 29 September 2026 release landed in the same minute as a JOLTS miss, so the two are hard to separate.

A miss tends to pull yields and the dollar down and lift gold, but on the day other news often dominates.

The 27 May 2025 beat is the mirror image. The index jumped to 98.0 against a forecast of 87 after a pause in some China tariffs, and Expectations rose 17.4 points to 72.8. Spot gold fell 1.35% to $3,297 and the dollar index rose about 0.5% to about 99.4. The 2-year yield still fell, from 4.00% to 3.92%, as Japanese bond issuance news dominated the rates market.

Leverage magnifies release minutes. A CFTC advisory warns that two out of three forex customers lose money and that leverage amplifies both gains and losses. Position size matters more than the direction call.

Q: Is a weak consumer confidence number good for gold?
A: Usually, but only when it shifts Fed expectations. On 29 September 2026 the miss lifted spot gold about 1.4%, while on 25 February 2025 a roughly 5-point miss saw gold fall about 1%. Read the 2-year yield and the dollar first; if neither moves, gold rarely holds a confidence-driven bounce.

The Honest Limits of the Consumer Confidence Index

The index measures what people say, not what they do. A Federal Reserve Board note from April 2025 matched about 9,200 survey respondents to their verified retail purchases. Some 43% said they were worse off than in 2019, yet most had bought more in real terms. The authors concluded that sentiment surveys have become weaker indicators of future behaviour, and Kansas City Fed economists call the sentiment-to-spending link modest.

Inflation leaves a long shadow on the answers. A BIS survey of about 1,000 households in each of 29 economies found the median household believed prices rose about 18% over 2020 to 2024. That is double the previous five years, and almost one in five perceived rises above 30%. Beliefs like that keep confidence low long after inflation slows, which weakens its signal for spending.

Revisions and sample effects add noise. December 2025 was revised up by 5.1 points and January 2026 by 4.5, turning a reported collapse into a milder drop. May 2026 was cut by 2.5 points. Use the index as one input alongside retail sales, payrolls and inflation, never as a forecast.

Where Aron Groups Fits

Aron Groups does not run surveys or trade bonds, but the markets that react to consumer confidence trade on its MetaTrader 5 platform. They include gold on XAU/USD, the major dollar pairs and index CFDs such as SPXUSD, NDXUSD and DJIUSD. The economic calendar lists each Conference Board and Michigan release, so the 27 October 2026 report can be planned for.

The release minute can be volatile, and spreads on floating-spread ECN accounts can widen around 10:00 am Eastern. A demo account lets you watch a release with no capital at risk. A Nano account trades from 0.01 nano lots with a fixed spread and no commission. Margin call sits at 100% margin level and stop-out at 50%, or 40% on Islamic and VIP accounts.

Conclusion

The consumer confidence index is a five-question survey turned into one number, scaled to 1985 = 100 and split into present and expectations halves. The Conference Board’s September 2026 reading of 81.9 was the lowest since 2014, and Expectations has been below the 80 recession line since February 2025.

Markets price the surprise against consensus, and the reaction runs through Fed expectations. A miss tends to pull the 2-year yield and the dollar down and lift gold, but on 29 September 2026 the dollar rose anyway. The Michigan gauge is bleaker still, at a preliminary 46.3 for October.

Use it as context for the dollar, gold and index CFDs, read it with the hard data, and mark 27 October 2026 on the calendar.

Frequently Asked Questions

Short answers to common questions about the consumer confidence index.

What is a good consumer confidence index number?

There is no official threshold, but 100 marks the 1985 average and readings above it mean consumers are more positive than in that year. The index reached 144.7 in 2000 and 25.3 in February 2009. September 2026’s 81.9 sits well below the 1985 base and the pre-pandemic 132.6.

What is the difference between consumer confidence and consumer sentiment?

Consumer confidence usually means the Conference Board index (1985 = 100), which leans on jobs and comes out on the last Tuesday of the month. Consumer sentiment usually means the University of Michigan index (1966 = 100), which leans on personal finances and prices and appears mid-month and at month-end.

Is the consumer confidence index a leading indicator?

Partly. The Expectations Index is forward-looking and has dropped below 80 before past recessions, which is why the Conference Board treats that level as a signal. But Fed research finds the sentiment-to-spending link modest, and the sub-80 stretches of 2022 to 2023 and 2025 to 2026 have brought no dated recession.

Is CCI the same as the Commodity Channel Index?

No. The Commodity Channel Index is a technical oscillator built from price and its moving average, used to spot overbought and oversold conditions on a chart. The Consumer Confidence Index is a monthly household survey published by the Conference Board. Only the abbreviation is shared.

Continue Reading
not-found
calendar 22 October 2026
Rate this article

Leave a Reply

Your email address will not be published. Required fields are marked *

No thanks