
icon icon Home
icon icon Accounts
icon icon Quick start
icon icon Symbols

Money Multiplier Explained: Formula, How Banks Create Money, and the Real-World Limits

Author
Abe Cofnas
Abe Cofnas
calendar Last update: 17 November 2026
watch Reading time: 9 min

The money multiplier is the ratio of money supply to the monetary base. It shows how many dollars of deposits and cash exist for each dollar of central bank money. In the textbook model of fractional reserve banking, the simple money multiplier equals one divided by the reserve ratio: 10 at a 10% ratio.

In the United States, that textbook version does not describe how policy works. Reserve requirements have been zero since 26 March 2020, and on 28 October 2026 the Federal Reserve held interest on reserve balances at 3.90%. Fed data published on 27 October 2026 put M2 at 4.28 times the monetary base in September, against 9.15 in August 2008. Both series are monthly and not seasonally adjusted. M2 was 5.7% higher than a year earlier, while consumer inflation was 3.7% (BLS, 14 October 2026).

This guide covers the money multiplier formula, a worked example and the leakages that shrink it. It tests the model on US data from 2000 to 2026. It also explains why many central banks steer the price of reserves, through interest rates, rather than their quantity.

bookmark
Key Takeaways
  • The money multiplier is the ratio of money supply to the monetary base; the simple version is one divided by the reserve ratio.
  • In the textbook model, $100 million of new reserves at a 10% ratio supports at most $1 billion of deposits.
  • Currency drain and excess reserves shrink it: with illustrative 20% and 5% ratios, the multiplier falls from 10 to 3.43.
  • US M2 divided by the monetary base fell from 9.15 in August 2008 to 2.81 in August 2014. It was 4.28 in September 2026.
  • US reserve requirements have been zero since 26 March 2020. The Fed steers short-term rates mainly with administered rates, such as 3.90% on reserves.

What Is the Money Multiplier?

The usual money multiplier definition is the factor by which the banking system expands central bank money into the broader money supply. Central bank money, called the monetary base, is currency plus the reserves that banks hold at the central bank. Broad money adds the bank deposits that households and firms spend and save.

sms-star

Risk Disclosure
Trading forex and CFDs carries a high level of risk and can result in the loss of all your capital. This content is educational and is not investment advice. Never risk money you cannot afford to lose.
The Monetary Base, M1 and M2

In September 2026 the US monetary base was $5,449.8 billion: $2,483.0 billion of currency in circulation and $2,966.8 billion of reserve balances. M1 is cash held by the public plus demand and savings deposits; M2 adds small time deposits and retail money market funds. M2 stood at $23,339.6 billion, not seasonally adjusted.

Fractional Reserve Banking and the Reserve Ratio

Fractional reserve banking means banks hold part of their deposits as reserves. The reserve ratio is that share, and the required reserve ratio is the minimum a central bank sets. Reserves above the minimum are excess reserves. Before March 2020, the top US requirement was 10%, on net transaction accounts above $127.5 million. The Fed estimated that the cut to zero lowered required reserves by about $200 billion.

The Money Multiplier Formula

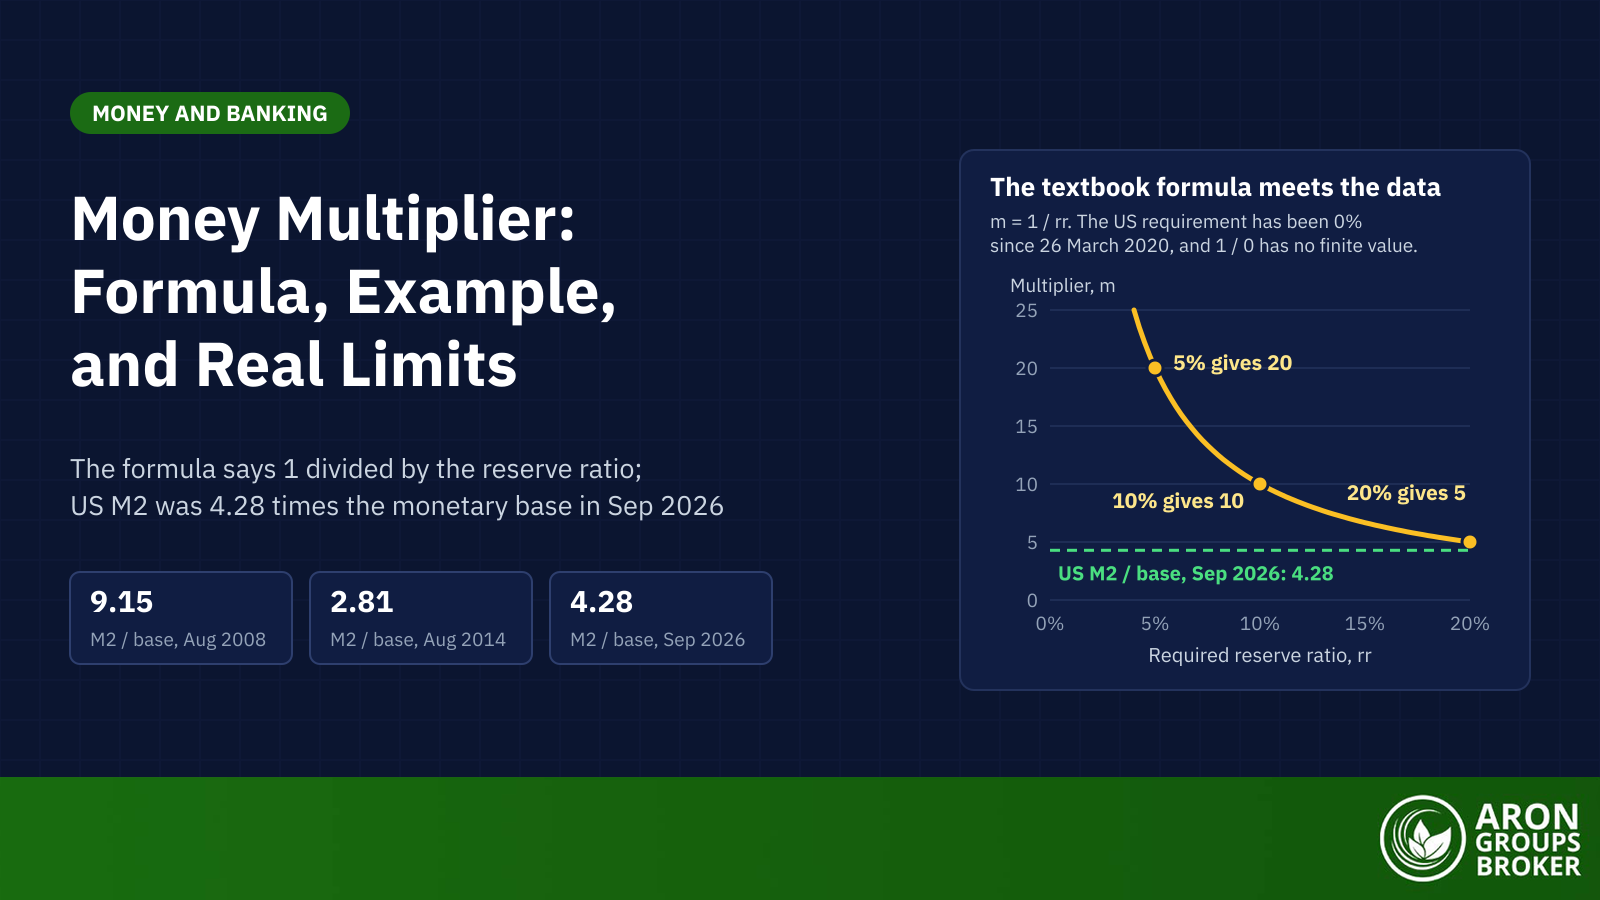
The simple money multiplier equation is m = 1 / rr, where rr is the required reserve ratio. A lower reserve ratio produces a larger money multiplier: 20 at 5%, 10 at 10% and 5 at 20%. In the textbook model, the maximum change in money supply equals new reserves times the multiplier. That expansion is the money multiplier effect.

Required reserve ratio (rr)Simple multiplier (1 / rr)Textbook maximum from $100 million of new reserves
20%5$500 million
10%10$1 billion
5%20$2 billion
1%100$10 billion
0% (US since 26 March 2020)No finite valueNo finite limit

Simple money multiplier by reserve ratio. The maxima assume no currency drain, no excess reserves and every loan redeposited.

From the Formula to the Data

Working out how to calculate money multiplier values from data takes one division: a money measure over the monetary base. For September 2026, the figures above give 23,339.6 / 5,449.8 = 4.28. Turned round, M2 equals the base times the multiplier, by construction, whatever drove the numbers.

Why a Zero Requirement Breaks the Formula

At a zero requirement, 1 / rr has no finite value. Yet the measured US ratio has stayed between 3.29 and 4.29 in every month since April 2020. The textbook multiplier is a teaching model, not a description of how US money is controlled. Banks still hold reserves to settle payments and meet liquidity needs.

How Banks Create Money in the Textbook Model

In the textbook story, banks keep a fraction of each deposit and lend out the rest. The borrower spends the loan, and the seller deposits the money at another bank. That bank keeps its fraction and lends the remainder, so lending and re-depositing cascade through the banking system. Each round is smaller than the last.

Mini Example: $100 Million of New Reserves at a 10% Ratio

The figures here are illustrative. The Fed buys $100 million of bonds from the public and pays with new reserves, so the sellers deposit $100 million. Assume a 10% required reserve ratio, no cash withdrawals, no excess reserves and every loan redeposited.

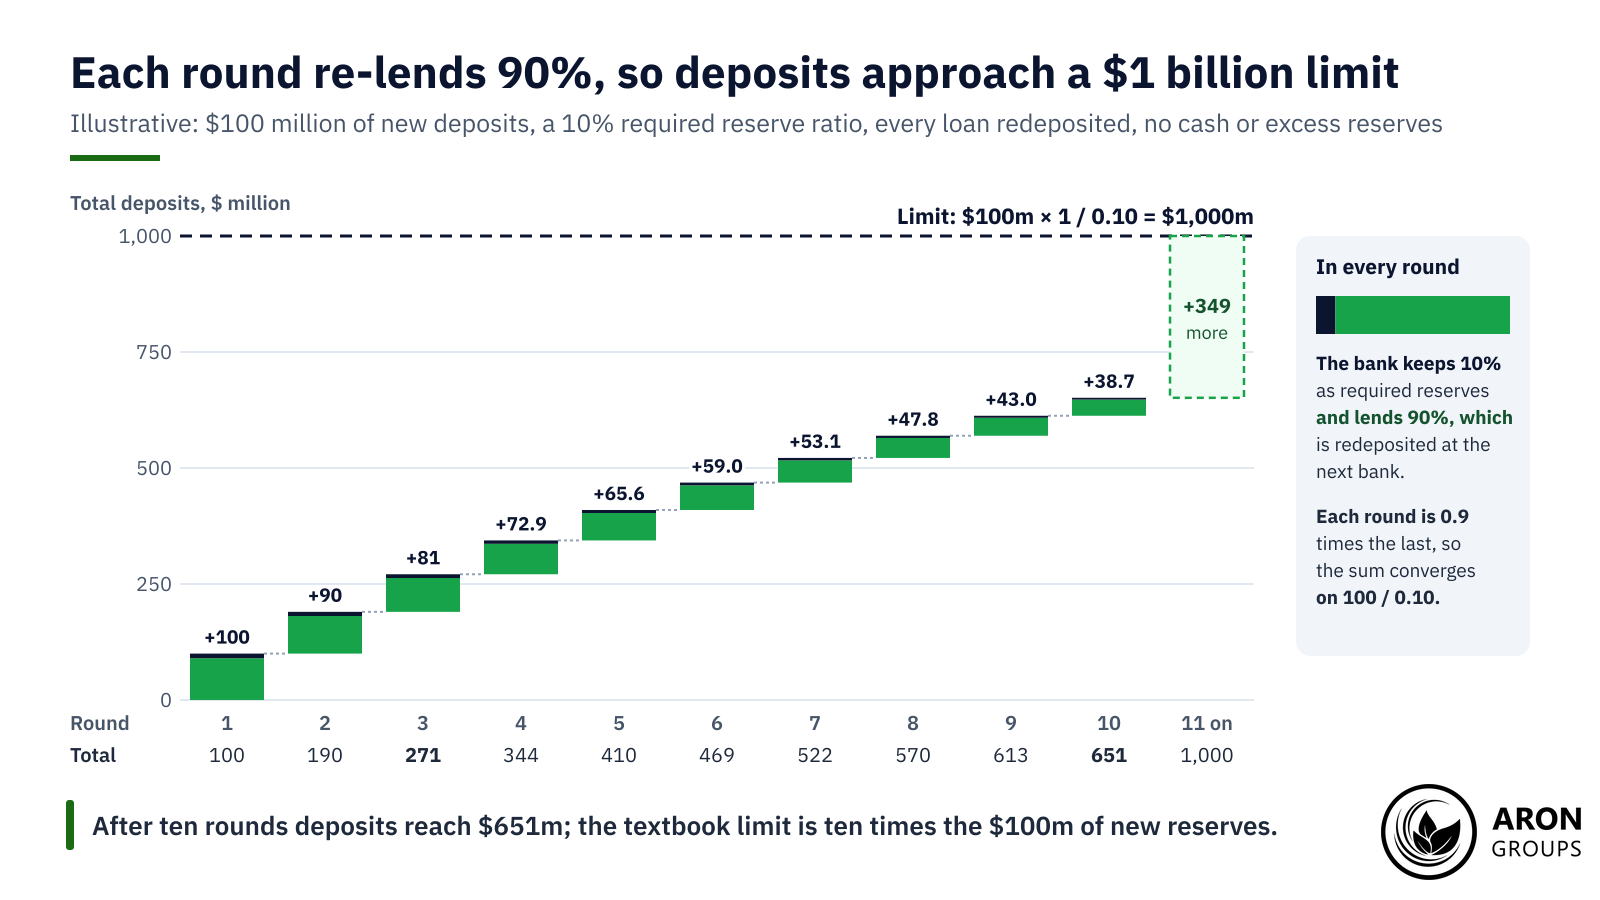
Round 1: Bank A keeps $10 million as required reserves and lends $90 million. Round 2: the $90 million lands at Bank B, which keeps $9 million and lends $81 million. Round 3: Bank C receives $81 million, keeps $8.1 million and lends $72.9 million.

After three rounds, deposits total $271 million ($100 + $90 + $81 million). After ten rounds they reach about $651 million. The limit is $100 million × 10 = $1 billion of deposits. Banks then hold $100 million of required reserves and $900 million of loans.

After ten illustrative rounds, deposits reach $651 million, about 65% of the $1 billion textbook limit.

Why the Actual Multiplier Is Smaller

The actual multiplier is smaller because of currency drain and excess reserves. Currency drain is the cash that people withdraw and keep, so it does not return to a bank as a deposit. Excess reserves are reserves that banks hold above the requirement instead of lending.

The Realistic Formula With Leakages

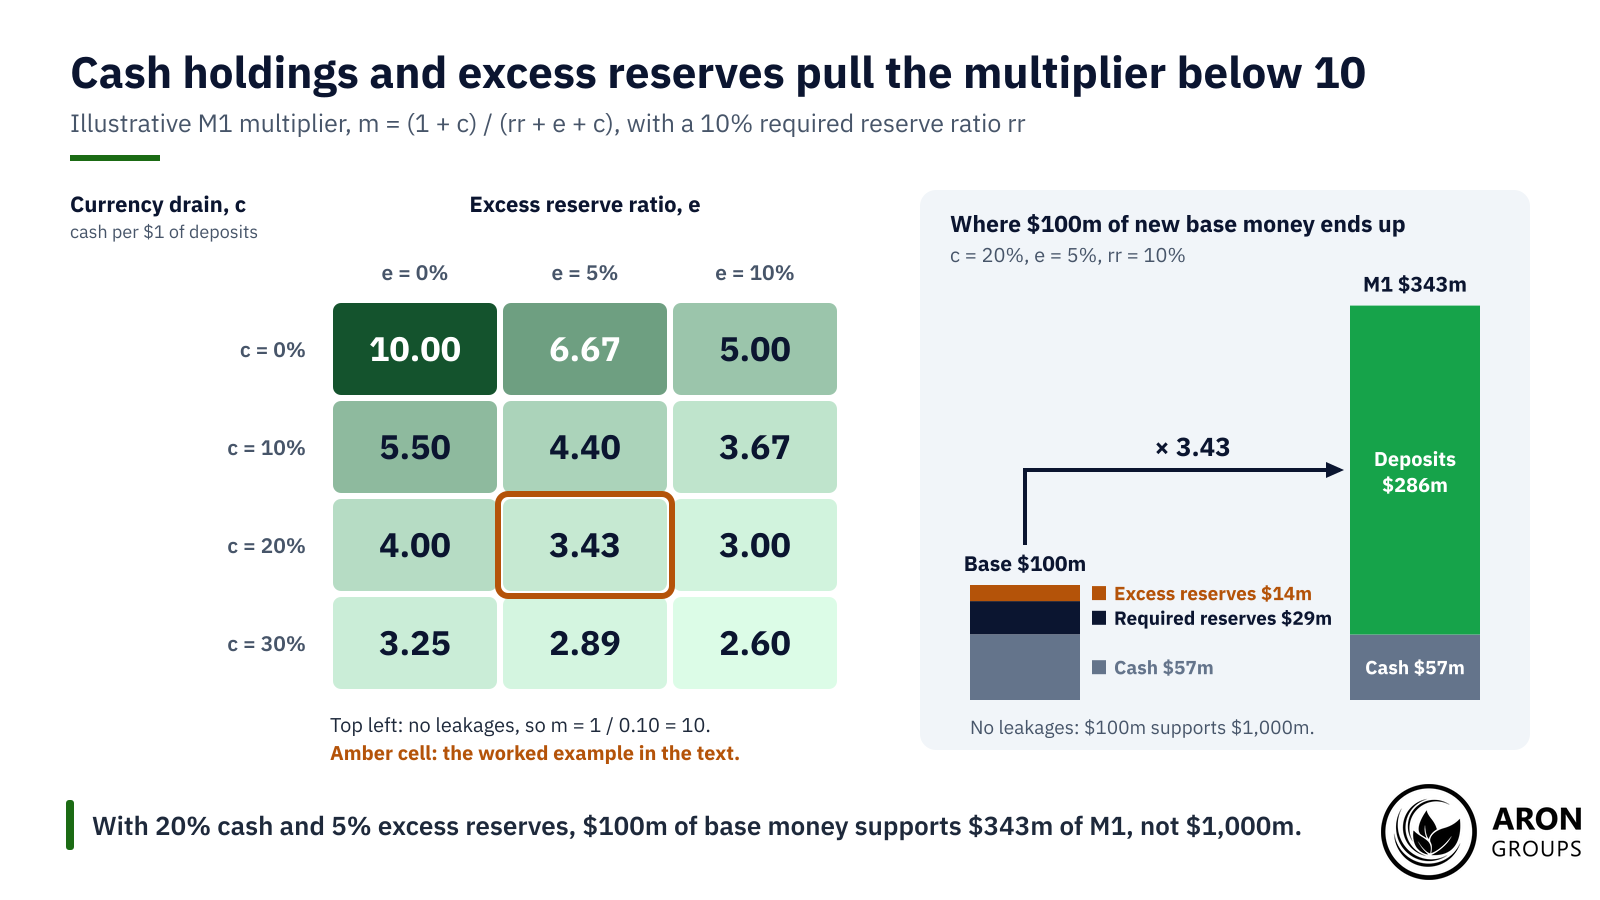
Adding both leakages gives m = (1 + c) / (rr + e + c). Here c is the currency-to-deposit ratio and e the excess reserve ratio. This is the M1 multiplier, since M1 counts cash plus deposits. With illustrative values of rr = 10%, e = 5% and c = 20%, the numerator is 1.20 and the denominator 0.35. So m = 1.20 / 0.35 = 3.43, rounded.

On those assumptions, $100 million of new base money supports about $343 million of M1, not $1 billion. About $57 million ends up as cash, $29 million as required reserves and $14 million as excess reserves. Deposits reach about $286 million. In this model, any currency drain or excess reserves pushes the multiplier below 1 / rr.

In the illustrative grid, each added leakage lowers the multiplier, from 10 with none to 2.60 at 30% cash and 10% excess reserves.

The Money Multiplier in US Data, 2000 to 2026

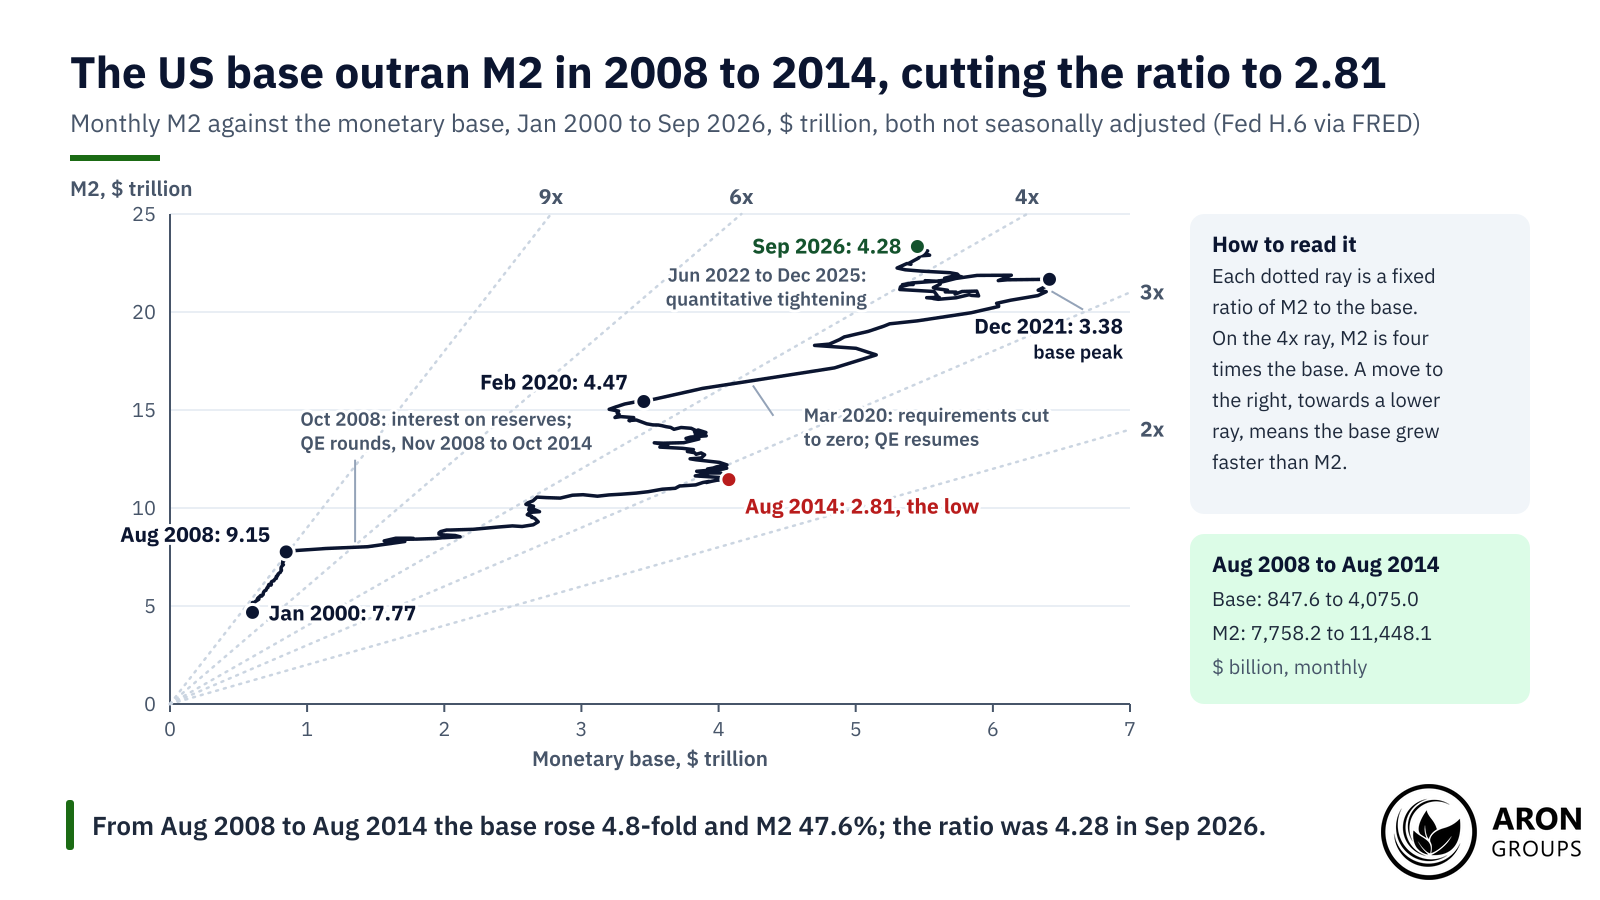
The measured US multiplier uses monthly averages from the Fed’s H.6 release, not seasonally adjusted (FRED series M2NS and BOGMBASE, 27 October 2026). In August 2008 M2 was 9.15 times the base. By August 2014 the ratio had fallen to 2.81, the lowest month in the 2000 to 2026 data.

MonthMonetary base ($ billion)M2 ($ billion)M2 ÷ baseContext
August 2008847.67,758.29.15Before interest on reserves began in October 2008
August 20144,075.011,448.12.81Base at its highest before 2020; purchases ended in October 2014
February 20203,454.515,433.74.47Before the 2020 bond purchases and zero requirements
December 20216,413.121,666.93.38Base at its highest in the sample
September 20265,449.823,339.64.28After quantitative tightening ended on 1 December 2025

Measured US money multiplier at selected months. Monthly averages, not seasonally adjusted. Source: Federal Reserve H.6 via FRED (M2NS, BOGMBASE), 27 October 2026.

QE Expanded the Base Far Faster Than M2

Quantitative easing expanded the monetary base without an equal rise in the money supply, in percentage terms. The Fed announced its first large-scale asset purchases on 25 November 2008 and ended its last round in October 2014. From August 2008 to August 2014, the base rose 4.8-fold while M2 grew 47.6%. Consumer prices (CPI-U, not seasonally adjusted) rose 8.6% in total over those six years, about 1.4% a year.

Had the August 2008 ratio held, simple arithmetic says M2 would have risen about $29.5 trillion. It rose $3.69 trillion. The extra reserves sat in banks’ accounts at the Fed, where they earned interest. M2 grew when the Fed bought bonds from non-banks, which creates deposits as well as reserves, and when banks lent.

The base raced ahead of M2 in 2008 to 2014. From December 2021 to September 2026 the base shrank 15.0% and M2 grew 7.7%.

2020 to 2021: Deposits Grew Too

The pandemic years looked different. From February 2020 to December 2021 the base grew 85.6% and M2 40.4%, so the ratio fell less, from 4.47 to 3.38. M2 was 26.6% higher in February 2021 than a year earlier, the fastest 12-month rise in the 2001 to 2026 data.

CPI then rose 9.1% in the 12 months to June 2022, the largest such rise since November 1981, the BLS said. Money was one ingredient among several. A July 2022 Fed staff note put the boost to US inflation over 2021 from fiscal stimulus at about 2.5 percentage points. Its authors called that illustrative, perhaps at the high end. Slow-adjusting supply and energy prices after Russia invaded Ukraine also mattered.

Why Central Banks Dispute the Textbook Multiplier

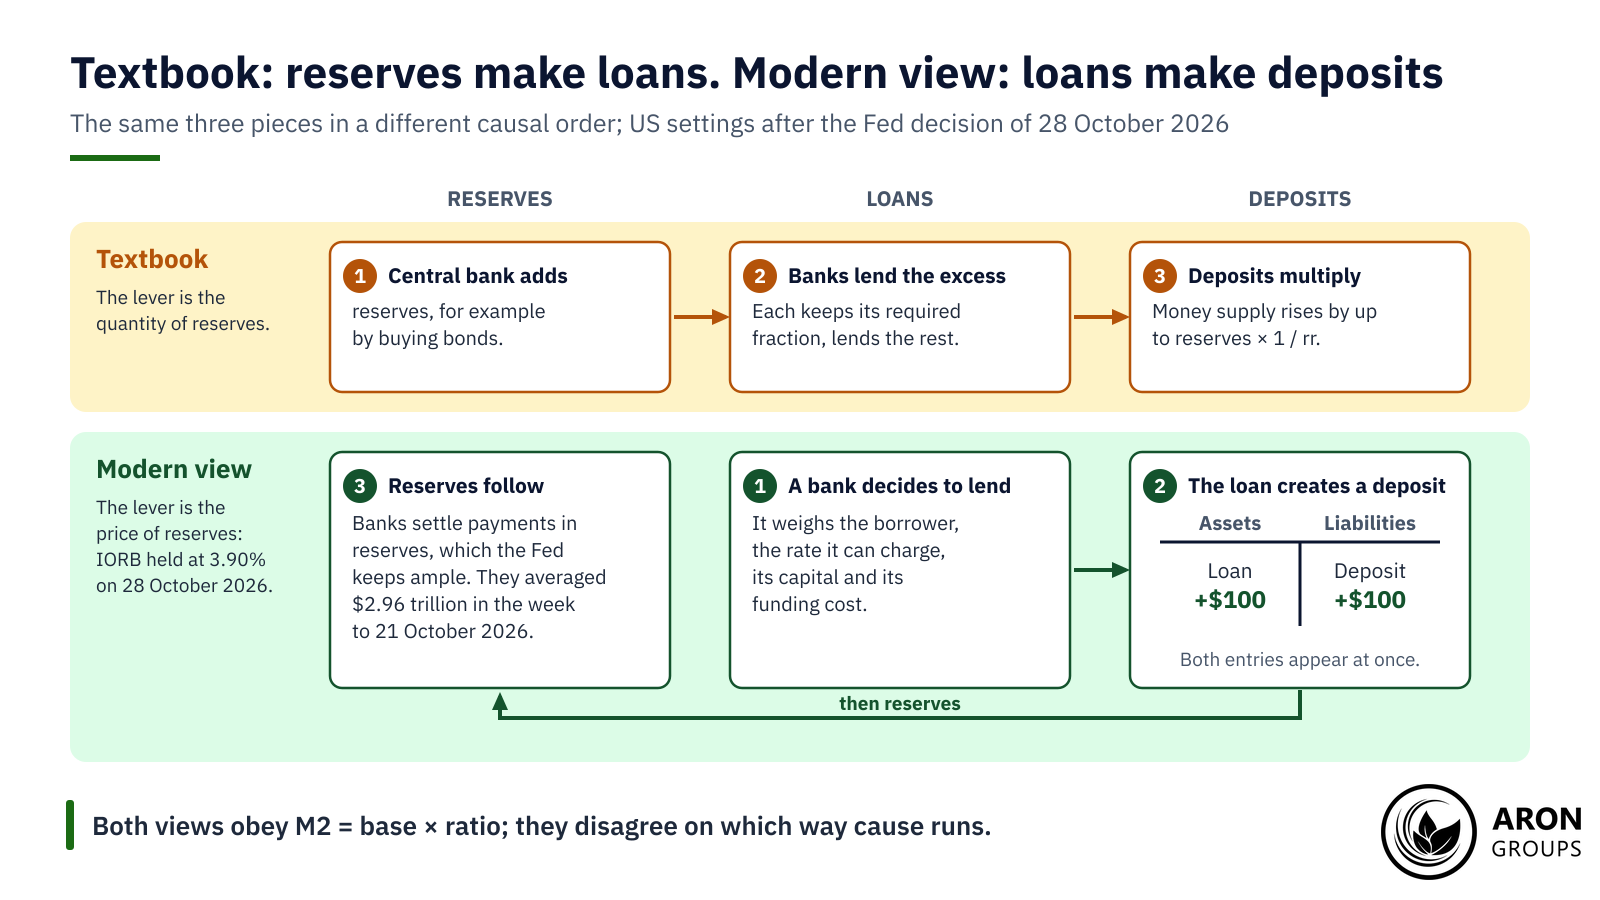
Many central bank economists dispute the textbook multiplier and treat money as endogenous: lending creates deposits, not the other way round. In “Money creation in the modern economy” (Bank of England Quarterly Bulletin, 2014 Q1), three Bank economists set out this view. Michael McLeay, Amar Radia and Ryland Thomas wrote that a bank making a loan “simultaneously creates a matching deposit in the borrower’s bank account”. They called the money multiplier theory a useful teaching device but “not an accurate description of how money is created in reality”.

They also wrote: “In no way does the aggregate quantity of reserves directly constrain the amount of bank lending or deposit creation.” In a May 2010 Federal Reserve Board working paper, Seth Carpenter and Selva Demiralp tested US data. They concluded that “the textbook treatment of money in the transmission mechanism can be rejected”.

A 2009 BIS working paper by Claudio Borio and Piti Disyatat argued that “the level of reserves hardly figures in banks’ lending decisions”. In their view, lending depends on banks’ willingness to lend, judged on risk and return, and on borrowers’ demand. None of this changes the arithmetic: M2 still equals the base times the ratio. The dispute is about which way cause runs.

Interest on Reserves and the Ample Reserves Regime

On this view, after 2008 abundant reserves and interest on reserves broke the mechanical link in the United States. The Emergency Economic Stabilization Act of 2008 let the Fed pay interest on reserves from 1 October 2008. The Board’s rule took effect on 9 October 2008. On 6 October 2008 the Board said interest on excess balances “should help to establish a lower bound on the federal funds rate”.

A bank that earns the reserve rate at the Fed has little reason to lend below it after risks and costs. Since 29 July 2021, a single rate on reserve balances, IORB, has replaced separate rates on required and excess reserves. In January 2019 the Federal Open Market Committee (FOMC) said it would keep “an ample supply of reserves”. Control of short-term rates would come mainly from administered rates.

On 28 October 2026 the FOMC held the federal funds target range at 3.75% to 4.00%. The Board kept IORB at 3.90%, effective 29 October 2026, and the overnight reverse repo rate was set at 3.75%. Reserve balances averaged $2.96 trillion in the week to 21 October 2026, according to the Fed’s H.4.1 release.

In the modern view a loan creates a deposit first; the Fed keeps reserves ample and sets their price.

Reserve Requirements Outside the United States

Reserve requirements still exist elsewhere. The European Central Bank’s minimum reserve ratio has been 1% since 18 January 2012. Since 20 September 2023, it has paid 0% on those reserves. The People’s Bank of China still changes its ratio as a policy tool. For example, it cut the ratio by 0.5 percentage point from 15 May 2025.

Q: If reserve requirements are zero, what stops banks from lending without limit?
A: Banks need borrowers who can repay, they face capital and liquidity rules, and the central bank sets the price of reserves. The Bank of England article calls monetary policy the ultimate limit on money creation.

What the Money Multiplier Means for FX and Gold Traders

The multiplier itself is not a trading signal, but its inputs are watched. The Fed’s weekly H.4.1 release shows reserve balances, and the monthly H.6 release shows the base and M2. Quantitative tightening ended on 1 December 2025. Since 11 December 2025, the Fed’s directive has provided for Treasury bill purchases to keep reserves ample. Such balance sheet choices feed into dollar liquidity and Treasury yields.

Higher expected US rates have tended to support the US dollar and weigh on gold, which pays no interest, though reactions vary. The measured ratio rose from 4.03 to 4.28 in the year to September 2026, as M2 grew and the base edged down. The FOMC meets next on 8 to 9 December 2026, with a new dot plot.

Data releases can move prices fast, and leverage raises the stakes. A CFTC advisory warns that high leverage “amplifies both gains and losses”. A stop-loss order is not a guaranteed exit either: an investor.gov bulletin notes that the execution price “can deviate significantly from the stop price”.

The Honest Limits of the Money Multiplier

The measured ratio describes; it does not explain. A falling ratio after 2008 shows that reserves outgrew deposits, not why. Testing causation takes other evidence, such as the bank-level tests in the Carpenter and Demiralp paper.

Banks’ appetite for risk shifts over the cycle, as financial conditions indices partly reflect, so lending can stall even when reserves are abundant. The endogenous view has limits too. The Fed’s 2019 framework relies on reserves staying ample, so that their quantity need not be managed actively. If reserves grew scarce, their quantity could matter more again.

Money growth is also a loose guide to inflation. From August 2008 to August 2014, M2 grew about 6.7% a year while consumer prices rose 1.4% a year. Velocity, nominal GDP divided by M2, fell from 1.90 to 1.55 between the third quarters of 2008 and 2014 (FRED, seasonally adjusted). Requirements still matter where they are used: in the BIS paper’s analysis, they affect the cost of loans rather than capping credit.

sms-star

Key Point
The measured multiplier is a ratio, not a lever. Many central banks steer the price of reserves, and bank lending creates deposits.


Where Aron Groups Fits

Aron Groups is a broker, not a bank, and the money multiplier is not a tradable instrument. Its inputs, such as rates and reserves, can move markets that Aron offers on MetaTrader 5. They include US dollar pairs such as EURUSD and USDJPY, gold on XAU/USD and index CFDs. Prices can move sharply on Fed decisions, and leverage magnifies losses as well as gains.

The economic calendar lists release times for central bank decisions and inflation data, with October CPI due on 10 November 2026. A Nano account trades from 0.01 nano lots, which allows small positions around such releases. A demo account uses virtual funds, so traders can practise reacting to news without risking capital.

Conclusion

The money multiplier is neat arithmetic: one divided by the reserve ratio in theory, M2 divided by the base in the data. As a teaching model it shows how fractional reserve banking can expand deposits, and why leakages shrink that expansion.

As a description of modern US policy it falls short. Requirements are zero, reserves earn 3.90%, and the measured ratio swung from 9.15 to 2.81 and back to 4.28. Rates and balance sheet decisions say more about money conditions than any fixed multiple.

Frequently Asked Questions

Short answers to common questions about the money multiplier.

What is the money multiplier in simple terms?

It is the number of dollars of money in the economy for each dollar of central bank money. In the textbook model it equals one divided by the reserve ratio, so a 10% ratio gives 10.

How is the money multiplier effect different from the Keynesian multiplier?

The money multiplier effect links central bank money to the money supply. The Keynesian multiplier links a change in spending, such as government purchases, to the resulting change in total output.

Does the money multiplier work with a zero reserve requirement?

Not as a formula, because 1 divided by zero has no finite value. The measured ratio still exists: US M2 was 4.28 times the base in September 2026, reflecting lending, cash demand and Fed policy.

Why is the actual money multiplier smaller than the simple one?

Money leaks out of the cascade. People keep some of it as cash, a currency drain, and banks hold excess reserves. With illustrative 20% cash and 5% excess ratios, a 10% requirement gives 3.43 instead of 10.

Continue Reading
not-found
calendar 17 November 2026
Rate this article

Leave a Reply

Your email address will not be published. Required fields are marked *

No thanks