
icon icon Home
icon icon Accounts
icon icon Quick start
icon icon Symbols

The Crowding Out Effect: How Government Borrowing Raises Rates and Squeezes Private Investment

Author
Abe Cofnas
Abe Cofnas
calendar Last update: 7 November 2026
watch Reading time: 10 min

The crowding out effect is the fall in private investment or spending that can follow a rise in government spending or borrowing. The government competes with firms and households for the same pool of savings, so interest rates tend to rise. Some private projects stop paying, and part of the boost from fiscal policy is lost.

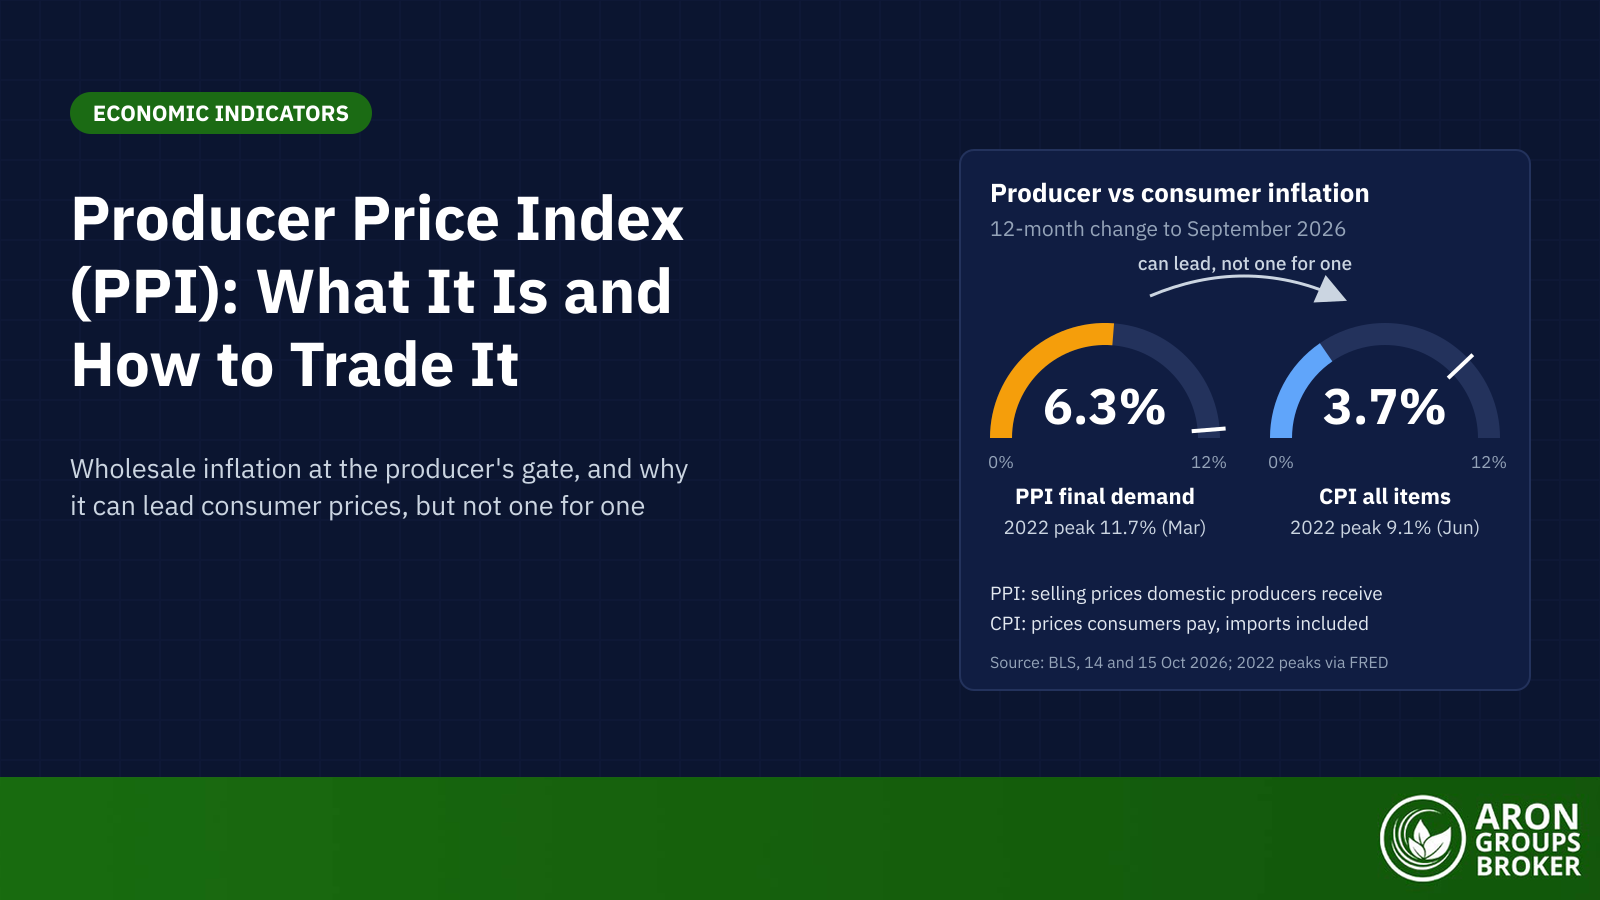
The question is live in the United States. The Monthly Treasury Statement of 16 October 2026 put the fiscal 2026 deficit at $1.99 trillion, up from $1.78 trillion in fiscal 2025. CBO projects federal debt held by the public at 101% of GDP in 2026. The 10-year Treasury yield was 4.95% on 3 November 2026, against 4.13% on 3 November 2025. Inflation and Fed policy move yields too, so the deficit is one influence among several.

This guide covers the crowding out effect definition, the loanable funds graph and the fiscal multiplier arithmetic. It then explains when crowding in wins and how central banks can offset crowding out. Finally, it weighs CBO’s estimates and traces the link to bond yields, the dollar and gold.

bookmark
Key Takeaways
  • The crowding out effect is the drop in private investment that can follow higher government borrowing, as competition for loanable funds lifts interest rates.
  • Crowding out shrinks the fiscal multiplier. In an illustrative case where half of a $100 billion spending boost is offset, the multiplier halves.
  • Crowding out tends to be strongest at full employment and weakest in a liquidity trap, where idle resources and near-zero rates allow crowding in.
  • CBO's rule of thumb adds 2 basis points to long-run rates for each point of debt-to-GDP. It projects debt rising from 101% of GDP in 2026 to 175% in 2056.
  • In the Mundell-Fleming model, deficits lift yields and the currency and crowd out net exports. In September 2022, though, sterling fell as UK gilt yields surged.

What Is the Crowding Out Effect?

The crowding out effect occurs when extra government spending or borrowing reduces private investment or consumption. It is a side effect of fiscal policy: the public sector uses savings, workers or demand that the private sector would otherwise have used.

sms-star

Risk Disclosure
Trading forex and CFDs carries a high level of risk and can result in the loss of all your capital. This content is educational and is not investment advice. Never risk money you cannot afford to lose.
Crowding Out Effect Economics: Borrowing or Taxes

Crowding out can work through two funding channels. If spending is financed by government borrowing, the state sells bonds and competes for savings, which tends to push rates up. If it is financed by higher taxes, firms and households keep less income, so they spend and invest less. Economists also describe direct crowding out, where public provision replaces private purchases without any change in rates.

How the Crowding Out Effect Works

The crowding out effect macroeconomics textbooks describe runs through the market for loanable funds. Savers supply funds, while firms and the government demand them. The interest rate is the price that balances the two.

When the government runs a budget deficit, it borrows by issuing bonds. Its demand adds to private demand, so the interest rate rises. Higher rates make private borrowing more expensive, and private investment falls.

Why Higher Rates Squeeze Private Investment

A firm invests when a project’s expected return beats the cost of funding it. Higher interest rates raise that hurdle, so marginal projects are shelved and some households delay buying homes. New bond supply also has to find buyers, and it tends to clear at lower prices and higher yields. As an SEC investor bulletin explains, bond prices and market interest rates generally move in opposite directions.

The Crowding Out Effect Graph

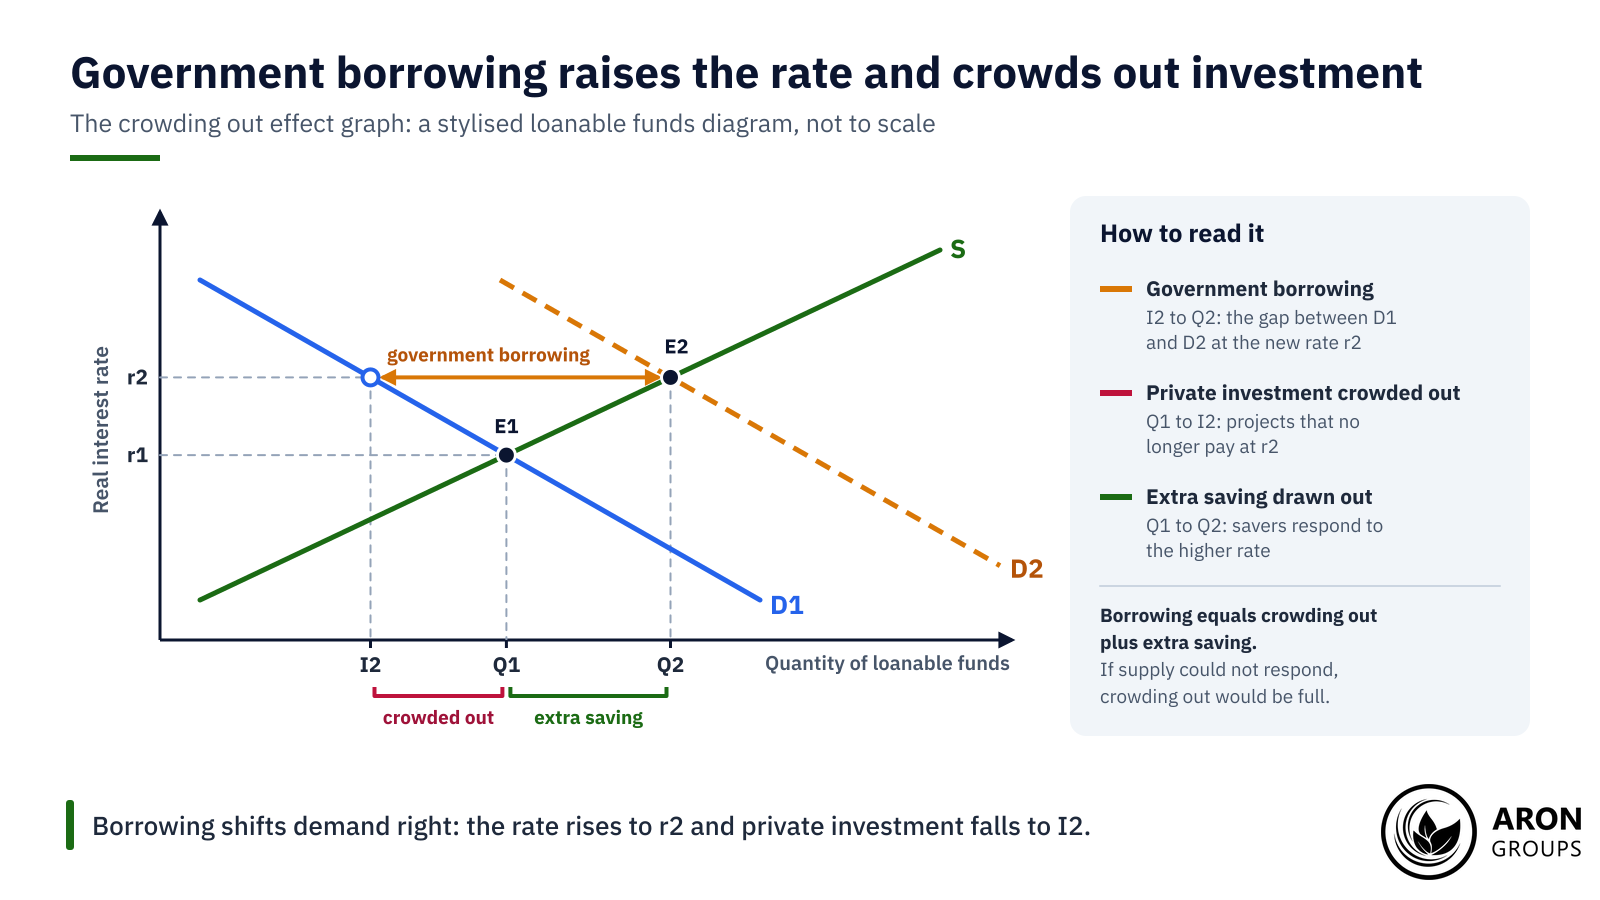
The crowding out effect graph is the loanable funds diagram. The vertical axis shows the real interest rate, and the horizontal axis shows the quantity of loanable funds. Supply slopes up, because higher rates draw out more saving. Demand slopes down, because fewer projects pay at higher rates.

Extra government borrowing shifts demand from D1 to D2, and the equilibrium moves from E1 to E2. The rate rises from r1 to r2, and total lending rises from Q1 to Q2. Private investment, read off the original demand curve at r2, falls from Q1 to I2.

On the crowding out effect graph, borrowing shifts demand right: the rate rises to r2 and private investment falls from Q1 to I2.

Partial or Full Crowding Out

The gap between Q1 and I2 is the private investment crowded out. It is smaller than the government’s borrowing, because the higher rate also draws out extra saving, from Q1 to Q2. Crowding out becomes full when the supply of funds cannot respond, so each borrowed dollar displaces a private one.

Some textbooks draw a deficit as lower national saving, which shifts supply left rather than demand right. Both versions give a higher rate and lower private investment.

How Crowding Out Shrinks the Fiscal Multiplier

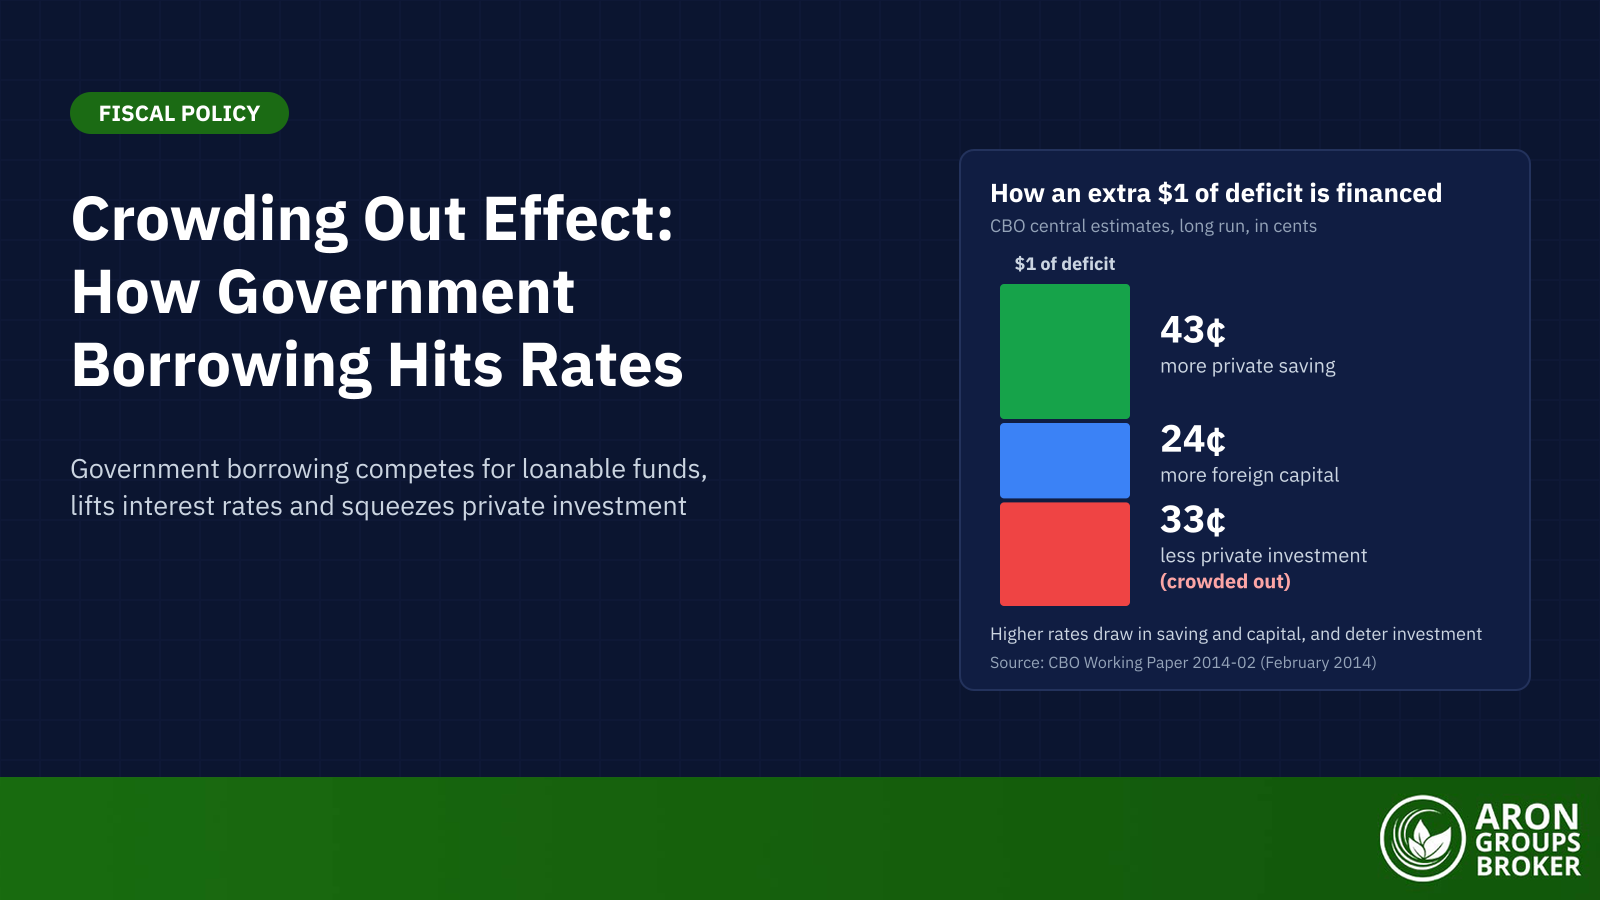
The fiscal multiplier measures the change in output for each dollar of extra government spending. Crowding out shrinks it, because lost private investment offsets part of the public boost. In a February 2014 working paper, CBO concluded that each extra dollar of federal deficit cuts private investment by 15 to 50 cents. Its central estimate was 33 cents, a long-run figure that allows for higher private saving and foreign capital.

Mini Example: When Half of $100 Billion Is Crowded Out

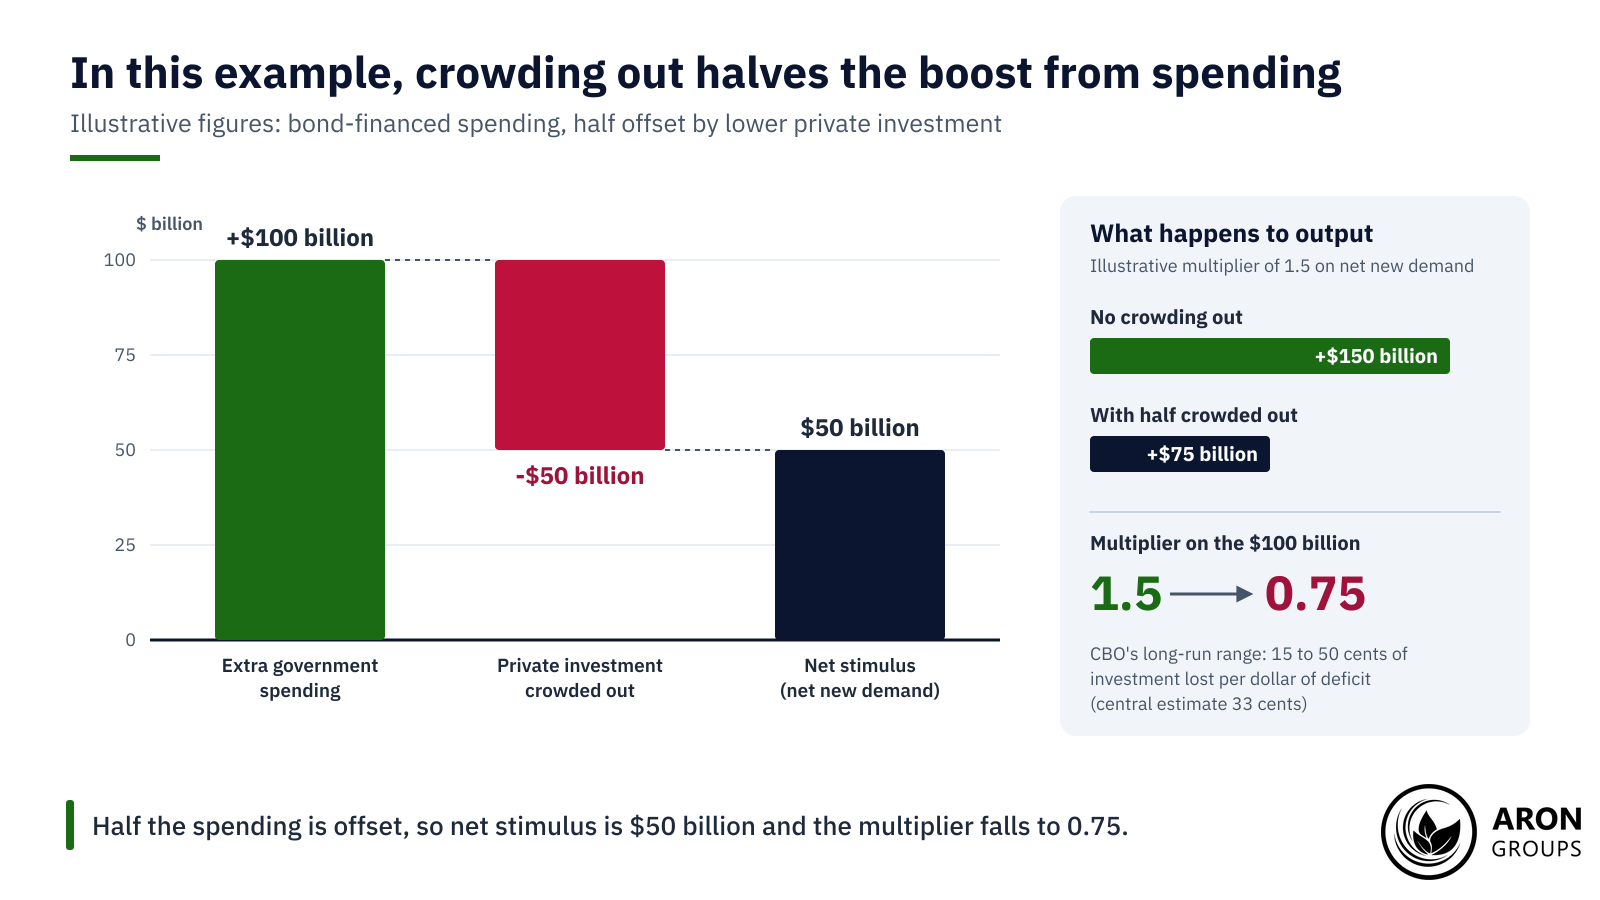
The figures in this example are illustrative. Step 1: the government spends an extra $100 billion and finances it by selling bonds.

Step 2: the borrowing lifts interest rates, and firms cancel $50 billion of investment. That is half of the spending, the top of CBO’s long-run range.

Step 3: net new demand is the spending less the cancelled investment, which leaves $50 billion.

Step 4: assume an illustrative multiplier of 1.5 on net new demand. Output rises $75 billion (50 times 1.5), not $150 billion (100 times 1.5).

Measured against the full $100 billion, the multiplier falls from 1.5 to 0.75.

In the illustrative example, $50 billion of crowded-out investment halves the net stimulus and cuts the multiplier from 1.5 to 0.75.

Crowding Out vs Crowding In

Crowding in is the opposite outcome: government spending stimulates private investment. With idle capacity, public orders raise firms’ sales, so they hire and invest more. IMF economists studied advanced economies in 2014. A public investment rise of 1% of GDP lifted output by about 0.4% in the same year and 1.5% after four years. The short-run effect was larger in periods of slack and easy monetary policy.

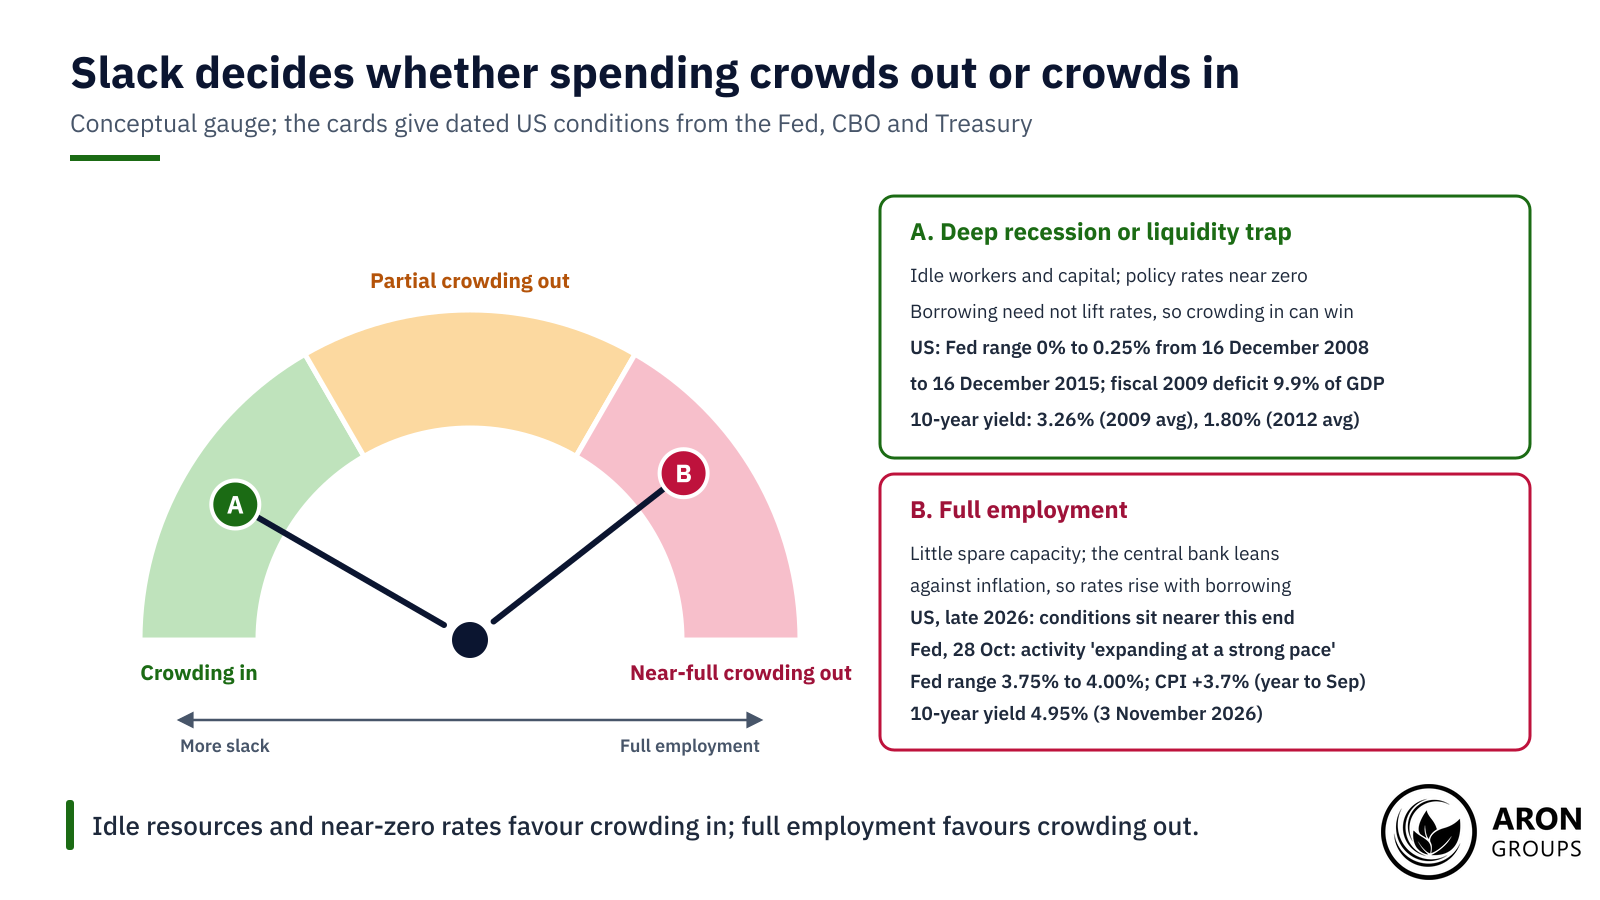
The state of the economy decides which effect wins. At full employment, resources are already in use and the central bank tends to lean against inflation, so crowding out dominates. In a deep recession or liquidity trap, policy rates sit near zero and savings lie idle, so rates need not rise.

Crowding out vs crowding in turns on slack: idle resources and near-zero rates favour crowding in, while full employment favours crowding out.

What the Great Recession Showed

The years after 2008 fit the slack case. CBO put the fiscal 2009 deficit at $1.4 trillion, or 9.9% of GDP, which it called the highest share since 1945. The Fed held its target range at 0% to 0.25% from 16 December 2008 to 16 December 2015. Yet the 10-year yield averaged 3.26% in 2009 and 1.80% in 2012 (FRED).

Research on those years suggests that near-zero rates and idle resources made crowding out weak. Lawrence Christiano, Martin Eichenbaum and Sergio Rebelo modelled this case in 2011. They argued that the multiplier “can be much larger than one when the zero lower bound on the nominal interest rate binds”. In January 2013, Olivier Blanchard and Daniel Leigh of the IMF studied fiscal consolidation in advanced economies. Planned cuts went with weaker growth than forecast, especially early in the crisis. They read this as a sign that multipliers were “substantially higher than implicitly assumed by forecasters”.

The table sets the two cases side by side.

FeatureCrowding outCrowding in
State of the economyNear full employment, little spare capacityDeep recession or liquidity trap, idle workers and machines
Interest ratesRise as the government competes for loanable fundsStay low, with policy rates near zero
Central bankTends to lean against inflationHolds rates down or buys bonds (QE)
Private investmentFalls as borrowing costs riseRises as public orders lift sales
Fiscal multiplierSmaller; many estimates are below 1Larger; can exceed 1 at the zero lower bound
Currency (Mundell-Fleming)Tends to rise as yields attract capitalLittle upward pressure while rates stay low
US exampleEarly 1980s: high real rates and a strong dollar2009 to 2015: Fed range 0% to 0.25%; 10-year yield 3.26% (2009) and 1.80% (2012)

Crowding out vs crowding in compared. Sources: CBO, Federal Reserve, FRED, IMF, and Christiano, Eichenbaum and Rebelo (2011).

The Monetary Offset: When the Central Bank Steps In

A central bank can offset crowding out by keeping interest rates low while the government borrows. It can also buy government bonds through quantitative easing (QE), which absorbs part of the new supply and adds to dollar liquidity.

The Fed did both after 2008. It held $476 billion of Treasury securities on 17 December 2008. Its holdings reached $2.46 trillion on 29 October 2014 and $5.77 trillion on 1 June 2022 (Federal Reserve data via FRED).

The offset is harder when inflation is high. On 28 October 2026 the Fed held its target range at 3.75% to 4.00%, and two members preferred a rise. Its statement said “Economic activity is expanding at a strong pace” and “Inflation remains elevated.” Consumer prices rose 3.7% in the year to September (BLS). By those signs, late 2026 sits nearer the full-employment end than the slack end. The next decision, with a new dot plot, is due on 9 December 2026.

Q: Can a central bank cancel out crowding out?
A: Partly. Low policy rates and bond buying can stop borrowing costs from rising, which works best when inflation is low and resources are idle. With high inflation, the same support risks pushing prices up instead.

How Big Is the Crowding Out Effect?

The magnitude is contested, but the direction is consistent: higher government debt tends to raise economy-wide borrowing costs. CBO’s rule of thumb comes from a December 2024 working paper by Andre Neveu and Jeffrey Schafer.

The paper says CBO estimates that a 1 percentage-point rise in the projected debt-to-GDP ratio “raises average long-run interest rates by 2 basis points”. Re-estimated with data through 2023, the coefficient was 2.0 basis points. A March 2019 CBO paper by Edward Gamber and John Seliski found about 2 to 3 basis points per point of debt.

CBO’s projections of 24 September 2026 have debt held by the public rising from 101% of GDP in 2026 to 175% in 2056. Applied mechanically, the rule turns that 74-point rise into about 1.5 percentage points (74 times 2 basis points is 148). That is an illustrative extrapolation, not a CBO forecast.

A separate CBO analysis of 8 October 2026 assumed all interest rates 150 basis points above its baseline. CBO said the factors behind those higher rates “are not specified”, so the scenario is not an estimate of crowding out. Economists often trace such supply effects to the term premium, the extra yield investors demand to hold long-term bonds, which also helps set the slope of the yield curve.

How Crowding Out Moves Bond Yields, the Dollar and Gold

The Mundell-Fleming model, developed by Robert Mundell and Marcus Fleming in the early 1960s, carries crowding out into the currency market. The same framework underpins the impossible trinity of exchange-rate policy.

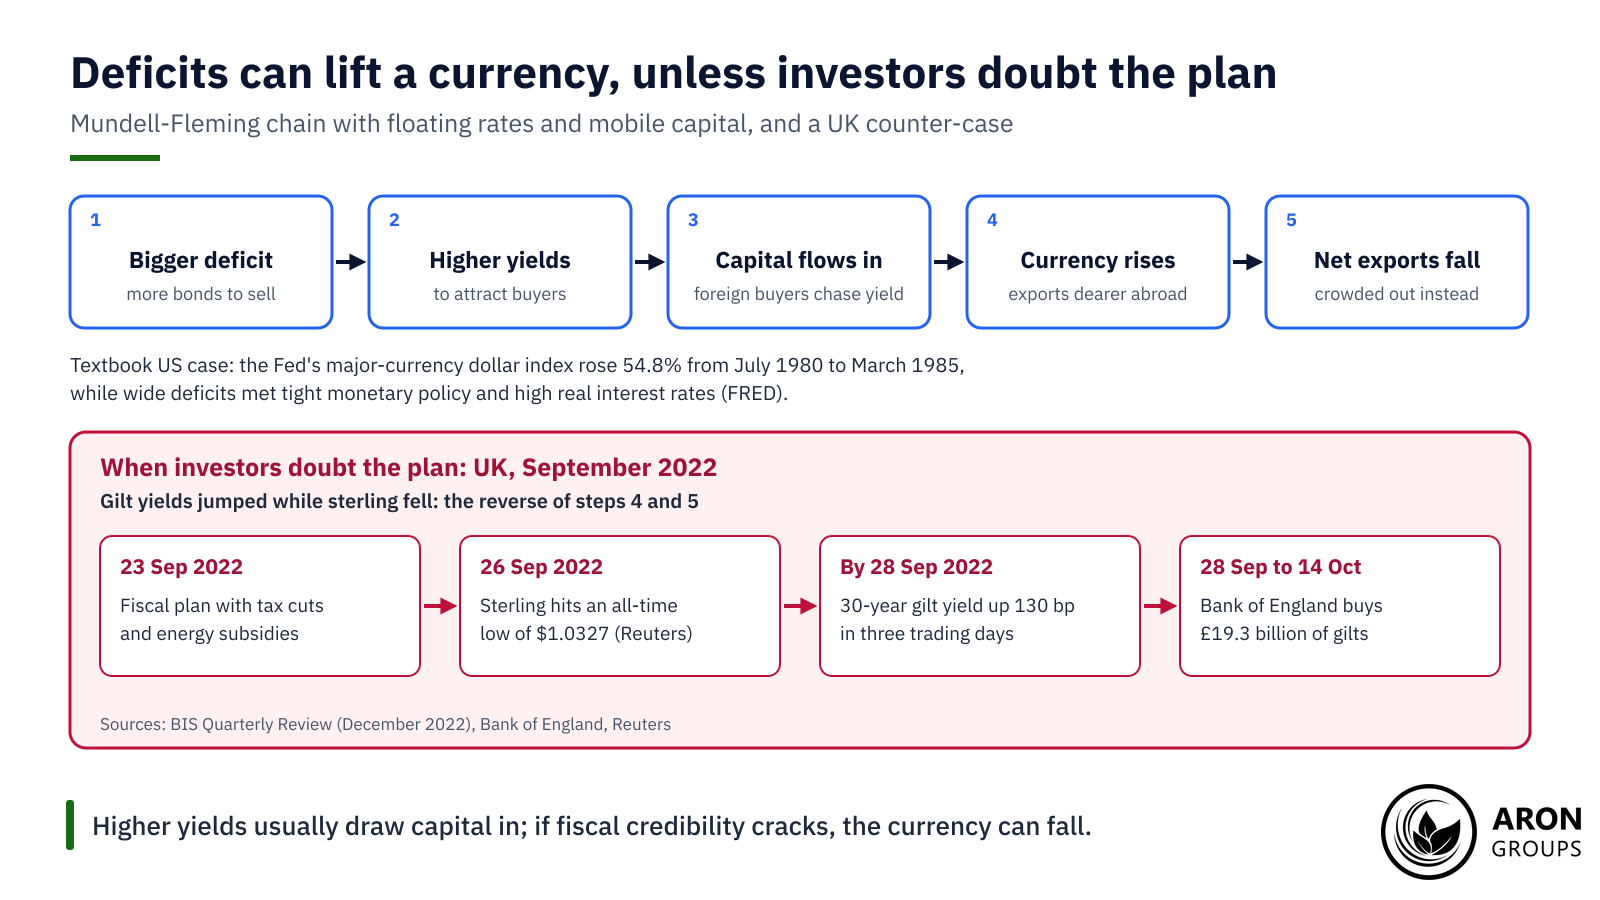
With floating exchange rates and mobile capital, heavier borrowing pushes bond yields up. A wider interest rate differential attracts foreign capital, which tends to lift the currency and make exports dearer. Net exports, rather than investment, are crowded out, so a budget deficit can come with a current account deficit, the so-called twin deficits.

The early 1980s are the classic US case. Wide deficits came with tight monetary policy and high real interest rates. The Fed’s major-currency dollar index rose 54.8% from July 1980 to March 1985 (FRED). Yields are one of several drivers of currency strength, so the link is a tendency rather than a rule.

Mundell-Fleming predicts a stronger currency after deficits lift yields; in September 2022, sterling fell to an all-time low as gilt yields surged.

When Fiscal Risk Weakens a Currency Instead

The chain assumes that investors trust the borrower. On 23 September 2022, the UK government announced a fiscal plan. By 28 September, the 30-year gilt yield had risen 130 basis points in three trading days, the Bank of England later reported. Sterling fell to an all-time low of $1.0327 on 26 September 2022, Reuters reported.

A BIS review followed in December 2022. It said the surge in yields “was precipitated by plans for an expansionary fiscal programme featuring tax cuts and energy subsidies”. It also noted “a significant depreciation of sterling”, and found that forced selling by liability-driven investment (LDI) funds played an important role. The Bank of England bought £19.3 billion of gilts between 28 September and 14 October 2022.

What FX and Gold Traders Watch

Traders track the supply side of the bond market. On 2 November 2026, the Treasury said it expects to borrow $618 billion in privately held net marketable debt in October to December 2026. It expects $800 billion in January to March 2027. Its quarterly refunding statement of 4 November 2026 sets the auction sizes for the coming quarter.

Gold pays no interest, so higher real yields tend to weigh on gold, although demand in a crisis can outweigh that pull. Higher yields also raise the rate at which future profits are discounted, a headwind for stock indices. The dollar tends to gain when US yields rise relative to others, unless fiscal worries drive investors away.

These moves can be fast around data releases and auctions, and leverage magnifies them. A CFTC advisory warns that a high degree of leverage “amplifies both gains and losses”.

The Honest Limits of the Crowding Out Effect

Ricardian equivalence challenges the mechanism. Robert Barro argued in 1974 that households may save more when the government borrows, to meet the taxes that future debt implies. If they fully do, private saving rises with the deficit and rates need not move. CBO’s 2014 review put the private saving response at 43 cents per dollar of deficit, so the offset is partial in its estimate.

Open economies blur the picture further. Foreign capital can cover part of the borrowing, 24 cents per dollar in CBO’s central estimate. That shifts crowding out from investment towards net exports.

The evidence on multipliers is mixed. Alan Auerbach and Yuriy Gorodnichenko (2012) found fiscal policy “considerably more effective in recessions than in expansions”. Valerie Ramey and Sarah Zubairy (2018) used historical US data covering large wars and deep recessions. They estimated multipliers “below unity irrespective of the amount of slack in the economy”, with mixed results at the zero lower bound.

Identities do not prove causes. Saving and investment must balance, so a deficit has to be matched by more private saving, more foreign capital or less investment. The identity cannot say which adjusts, and rates also move with inflation, growth and central bank policy.

sms-star

Key Point
The direction of the crowding-out effect is well supported: more government borrowing tends to raise interest rates. Its size depends on slack, the central bank and foreign capital, and remains contested.


Trading the Crowding Out Effect in FX, Gold and Indices

Aron Groups does not offer bonds or Treasury products. Crowding out reaches traders through markets that react to yields, which are available as CFDs on MetaTrader 5. They include forex pairs such as EURUSD and USDJPY, gold on XAU/USD and index CFDs. Leverage magnifies losses as well as gains, and a stop-loss is not a guaranteed exit when prices gap.

Budget and rate news arrives on a schedule. The economic calendar shows release times for major economic news. The next big US events are October CPI on 10 November 2026 and the Fed decision on 9 December 2026. A demo account with virtual funds allows practice without risking real money.

Conclusion

The crowding out effect is the cost side of deficit finance. Government borrowing competes for savings, lifts interest rates and can squeeze private investment. Slack, central banks and foreign capital decide how much.

With the fiscal 2026 deficit at $1.99 trillion and debt at 101% of GDP, the question is practical again. CBO’s rule of thumb is small per point of debt but sizeable across a 74-point rise.

Frequently Asked Questions

Short answers to common questions about crowding out.

What is the crowding out effect in simple terms?

It is when government borrowing or spending leaves less room for private investment. The government competes for savings, interest rates rise, and some private projects no longer pay.

What is an example of the crowding out effect?

In an illustrative case, $100 billion of bond-financed spending lifts rates and firms cancel half as much investment. CBO’s central long-run estimate is 33 cents of investment lost per dollar of deficit.

What is the difference between crowding out and crowding in?

Crowding out means private investment falls when government spending rises; crowding in means it rises with it. Crowding in is likelier in a slump, with idle resources and near-zero rates.

Does the crowding out effect strengthen the currency?

In the Mundell-Fleming model it does: higher yields attract capital and lift the currency, crowding out net exports. If investors doubt the fiscal plan, the currency can fall instead, as sterling did in September 2022.

Continue Reading
not-found
calendar 7 November 2026
Rate this article

Leave a Reply

Your email address will not be published. Required fields are marked *

No thanks