
The producer price index (PPI) measures the selling prices producers receive for their output. It tracks inflation at the wholesale level, before it reaches consumers. The PPI is published monthly by the US Bureau of Labor Statistics (BLS), and until 1978 it was called the Wholesale Price Index.
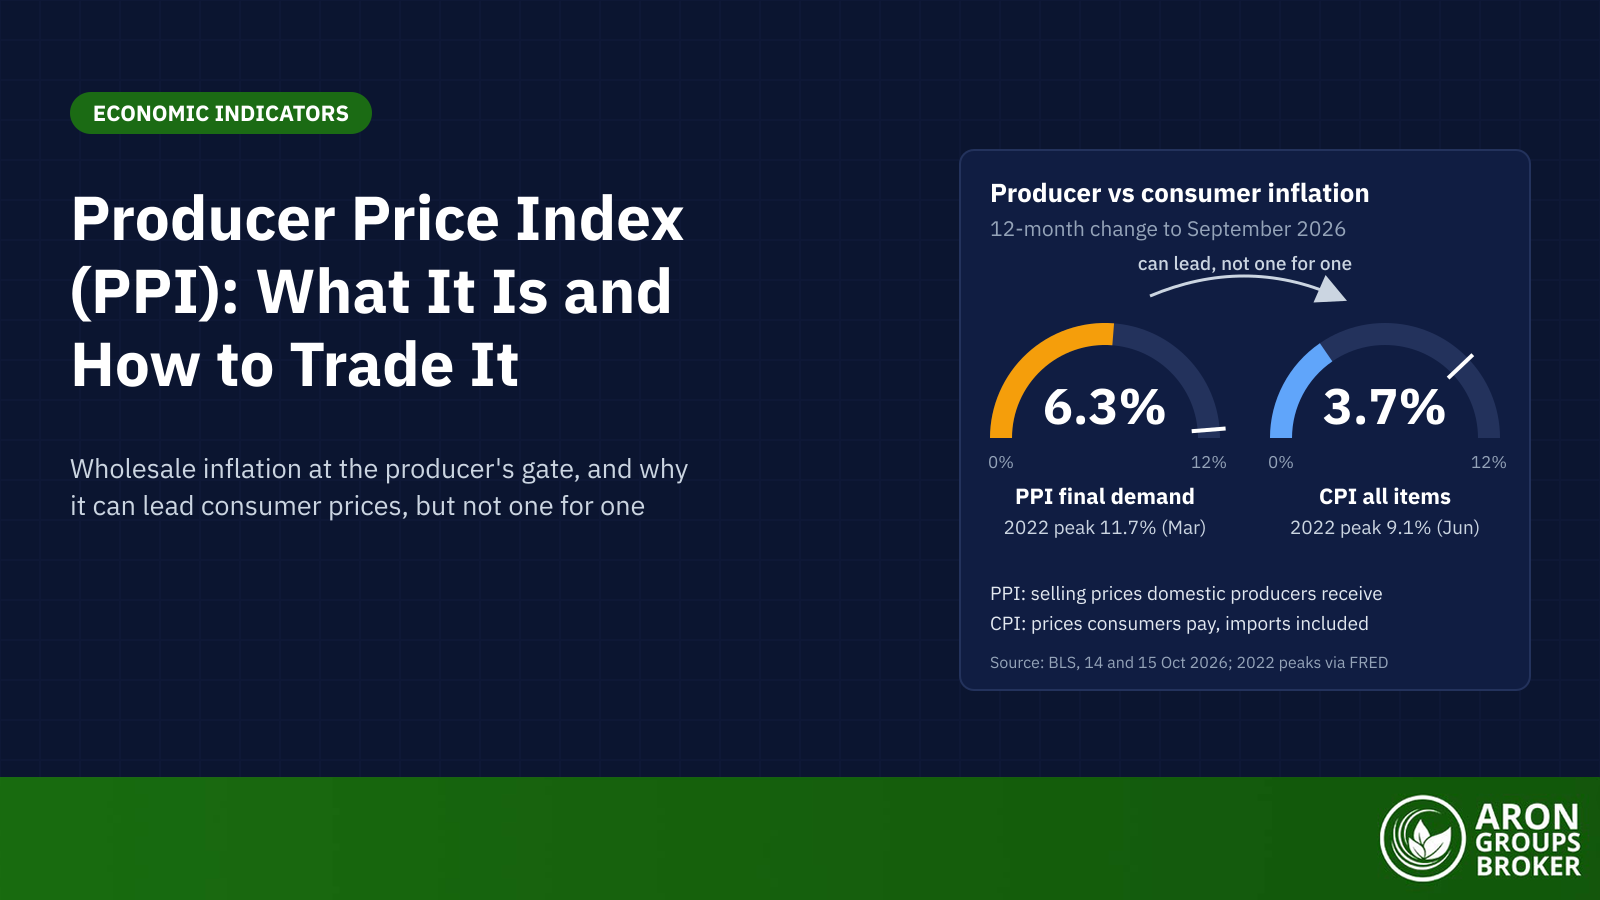
Producer prices are running well ahead of consumer prices. On 15 October 2026 the BLS reported that PPI final demand rose 1.3% in September and 6.3% over 12 months. A day earlier, the CPI had put consumer inflation at 3.7%. On 28 October 2026 the Federal Reserve kept its 3.75% to 4.00% target range, but two of 12 voters wanted a 0.25 point rise.
This guide covers what the PPI measures, how PPI vs CPI compare, whether producer prices lead consumer prices and how markets react.
- The producer price index measures the selling prices domestic producers receive; the CPI measures the prices consumers pay, imports and sales taxes included.
- In September 2026, PPI final demand rose 1.3% in the month and 6.3% over 12 months; the CPI rose 3.7% over 12 months.
- Core PPI comes in two BLS versions: final demand less foods and energy, and final demand less foods, energy, and trade services. Both rose 5.0% over 12 months.
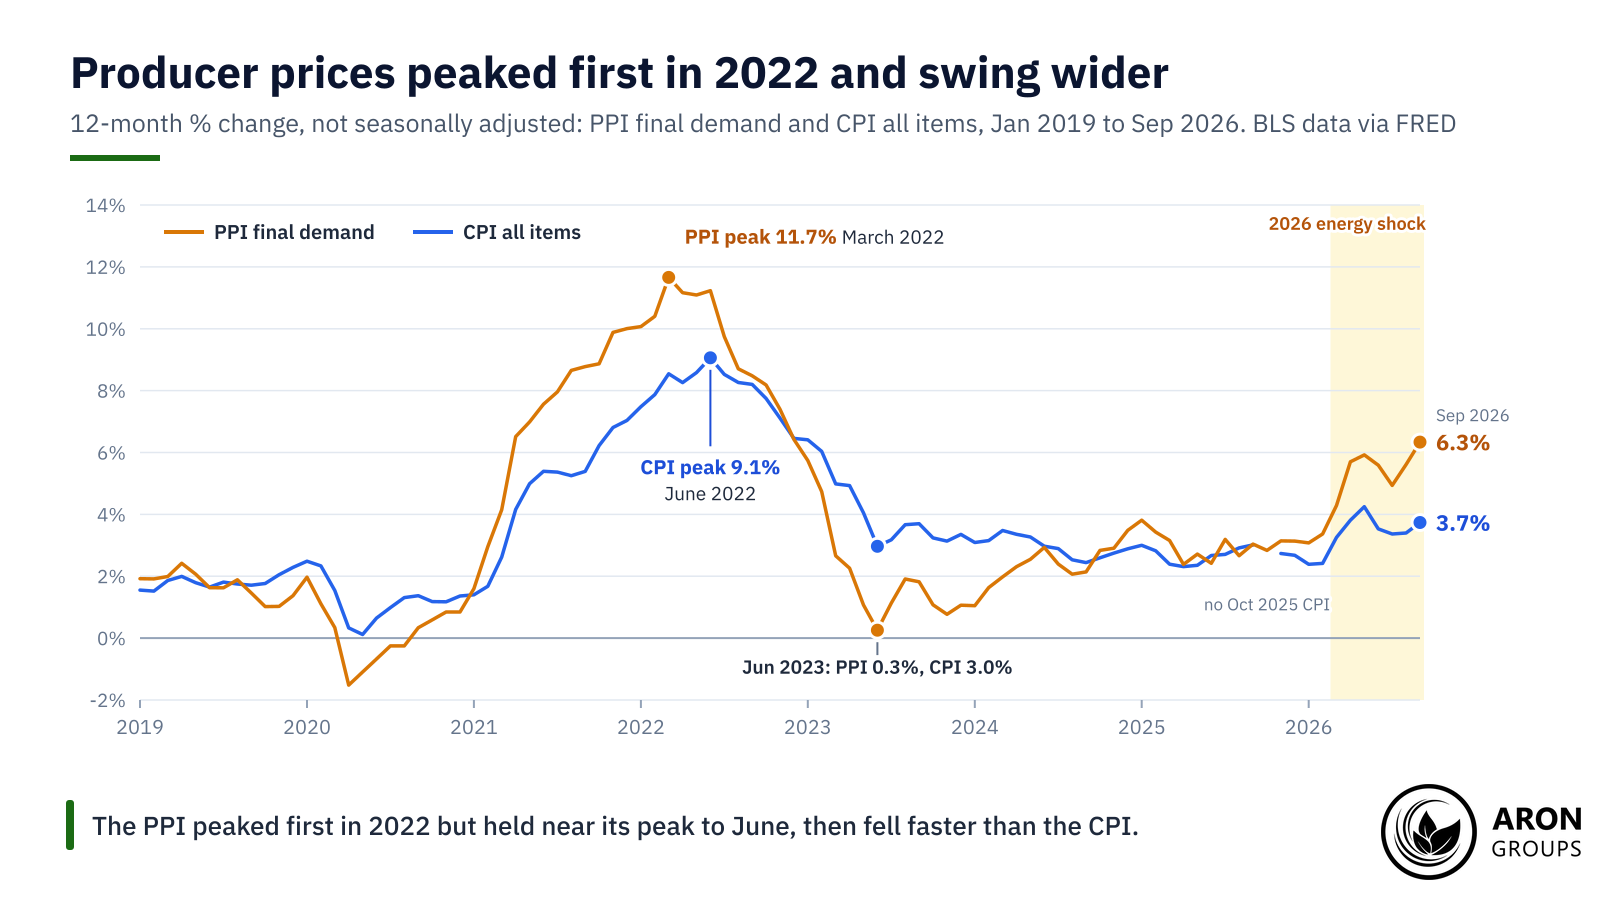
- Producer prices can lead consumer prices: the PPI peaked in March 2022 but was still near that level when the CPI peaked in June. The pass-through is partial and uneven.
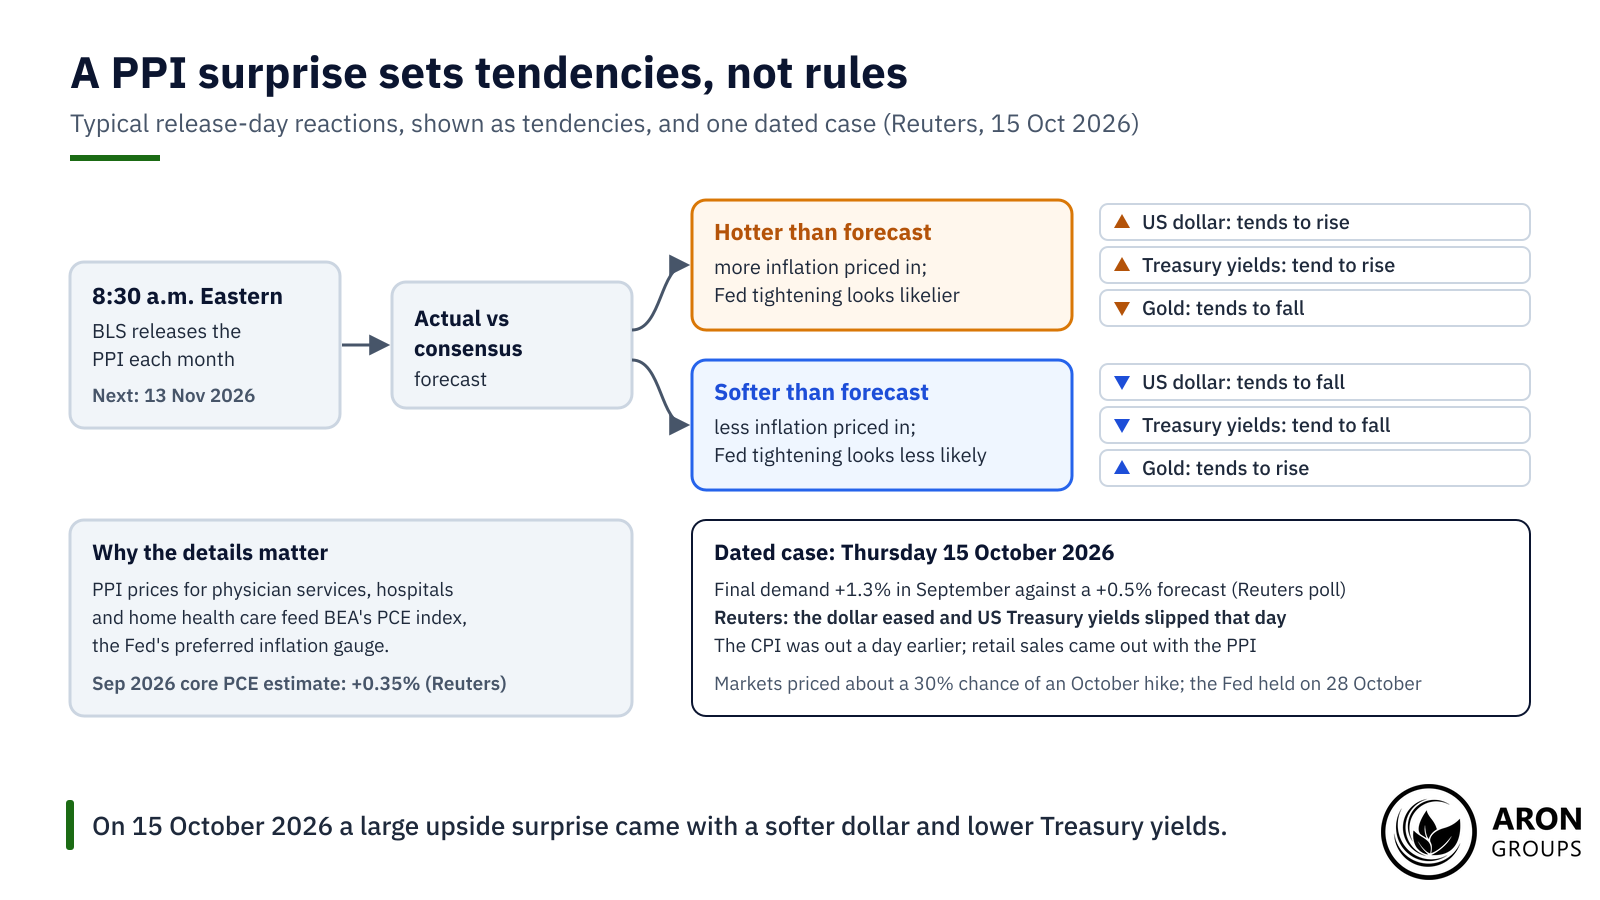
- A hotter than expected PPI tends to lift the dollar and Treasury yields and weigh on gold. On 15 October 2026, after a big upside surprise, the dollar eased instead.
What Is the Producer Price Index (PPI)?
The PPI is a family of indexes that track prices from the seller’s side. Its headline, PPI final demand, covers goods, services and construction sold for personal consumption, capital investment, government and export. The BLS releases about 10,000 of them each month.
Risk Disclosure
Trading forex and CFDs carries a high level of risk and can result in the loss of all your capital. This content is educational and is not investment advice. Never risk money you cannot afford to lose.
Producer Price Index Definition
The BLS PPI page says the index “measures the average change over time in the selling prices received by domestic producers for their output”. Prices come from the first commercial transaction for many products and some services. A factory’s price is recorded when it sells, not at the shop till. Imports and sales and excise taxes are excluded, while the CPI includes both.
From the Wholesale Price Index to PPI Final Demand
The index was first published in 1902, covering the years 1890 to 1901. It kept the name Wholesale Price Index (WPI) until 1978. In 2014 the BLS made final demand the headline, adding services, construction, government purchases and exports. That raised coverage to about 70% of domestic production.
What the PPI Measures: Final Demand, Core and the Pipeline
Final demand covers sales to final buyers, while intermediate demand covers what businesses buy from each other as inputs.
PPI for Final Demand: Goods, Services and Construction
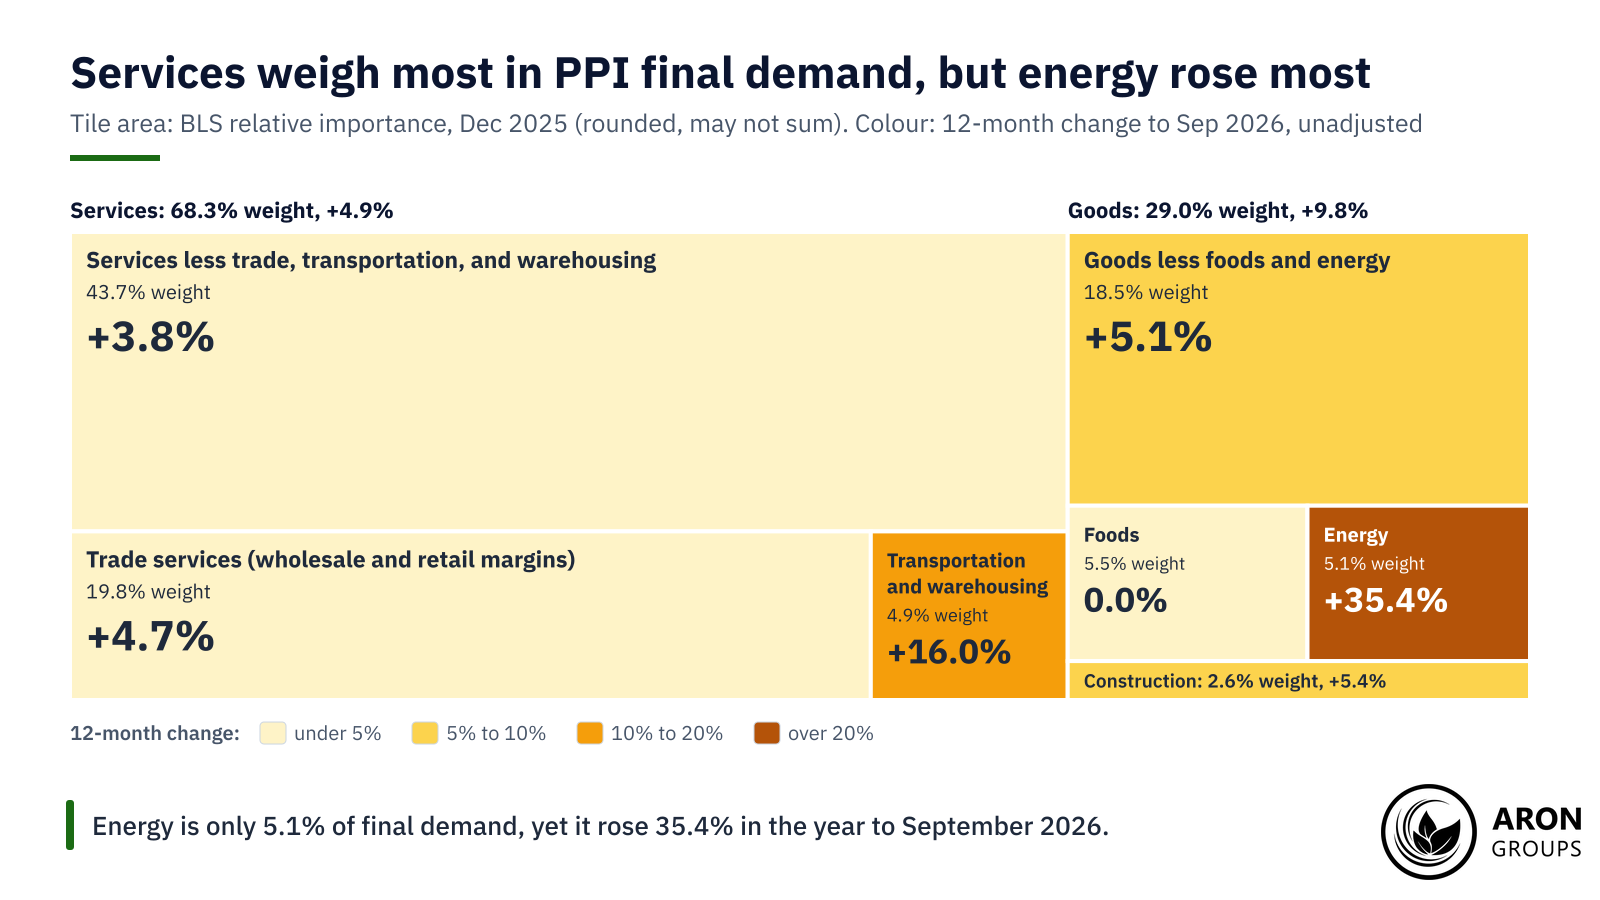
Services make up most of the index. In BLS weights for December 2025, final demand services made up 68.3%, goods 29.0% and construction 2.6%, with energy at just 5.1%. In the year to September 2026, energy rose 35.4%, while foods were unchanged and goods less foods and energy rose 5.1%. Services rose 4.9%, with transportation and warehousing up 16.0%.
Core PPI: Two Measures
Core PPI strips out food and energy to show the underlying trend, and the BLS publishes two versions. Final demand less foods and energy rose 0.7% in September, seasonally adjusted, and 5.0% over 12 months. Final demand less foods, energy, and trade services rose 0.5% in the month and also 5.0%. The BLS highlights the second in its release text, while AP quoted the first as core.
In the Technical Note to its PPI release, the BLS says trade indexes “measure changes in margins received by wholesalers and retailers”. A margin is the gap between what a trader pays for goods and what it charges. Margins can swing against the goods they sit on, so the two core measures can diverge.
Mini Example: How a Fuel Retailer's Margin Enters the PPI
Take an illustrative US petrol station. It buys petrol at $3.00 a gallon and sells it at $3.40, a margin of $0.40.
Its wholesale cost then rises 20.0% to $3.60, and the pump price rises 14.7% to $3.90. The margin shrinks to $0.30, a fall of 25.0%.
The PPI records both moves: a 20.0% rise in the producer’s price and a 25.0% fall in the retail margin. The CPI records the 14.7% rise at the pump. In September 2026, margins for automotive fuels and lubricants retailing fell 30.3%, while final demand energy jumped 10.8%.
Intermediate Demand: The Pipeline Stages
Intermediate demand tracks what businesses pay for inputs. By commodity type, it splits into unprocessed goods such as crude oil and farm products, processed goods such as fuels, and services. By production flow, it runs from stage 1, the earliest, to stage 4, the closest to final demand. A 2016 BLS study by Jonathan Weinhagen found price shocks passing forward from earlier stages to later ones, with no significant movement backwards.
What Is PPI Inflation? The September 2026 Report
PPI inflation is the percentage change in producer prices, quoted month-on-month and year-on-year, or month-over-month and year-over-year in US usage. The BLS headlines seasonally adjusted monthly changes and unadjusted 12-month changes, and this article follows that convention.
The September 2026 report came out on 15 October at 8:30 a.m. Eastern. PPI final demand rose 1.3%, the largest monthly advance since March 2022, after 0.5% in August and 0.2% in July. Over 12 months it rose 6.3%, the most since December 2022. Final demand goods rose 2.6% in the month, and the BLS traced over 80% of that rise to energy, which jumped 10.8%.
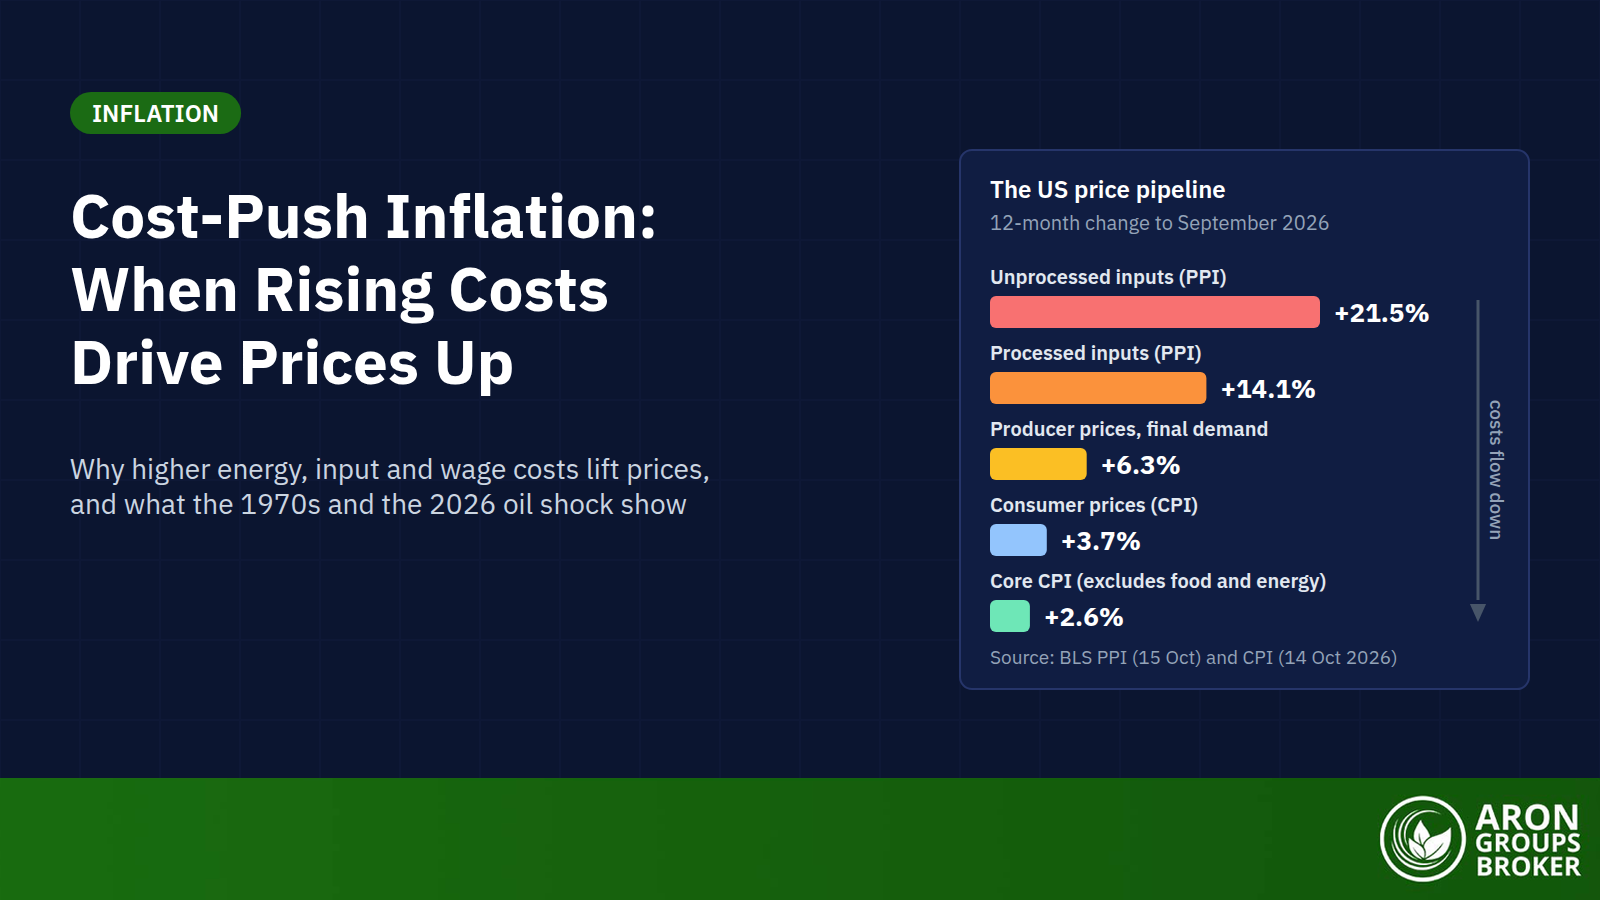
Final demand services rose 0.8%, and nearly half of that came from a 1.4% rise in trade margins. Further up the pipeline, unprocessed goods for intermediate demand rose 8.4% in the month and 21.5% over 12 months. Processed goods rose 14.1% and services for intermediate demand 6.3% over 12 months.
| BLS index | Weight in final demand (Dec 2025) | September 2026, month (SA) | 12 months to September 2026 (NSA) |
|---|---|---|---|
| Final demand | 100.0% | +1.3% | +6.3% |
| Final demand goods | 29.0% | +2.6% | +9.8% |
| Final demand foods | 5.5% | +1.2% | 0.0% |
| Final demand energy | 5.1% | +10.8% | +35.4% |
| Final demand services | 68.3% | +0.8% | +4.9% |
| Final demand trade services | 19.8% | +1.4% | +4.7% |
| Final demand less foods and energy | 89.5% | +0.7% | +5.0% |
| Final demand less foods, energy, and trade services | 69.7% | +0.5% | +5.0% |
| Processed goods for intermediate demand | n/a | +2.5% | +14.1% |
| Unprocessed goods for intermediate demand | n/a | +8.4% | +21.5% |
| Services for intermediate demand | n/a | +0.9% | +6.3% |
September 2026 PPI by BLS index (SA: seasonally adjusted; NSA: not seasonally adjusted). Source: BLS.
PPI vs CPI: Producer Prices and Consumer Prices Compared
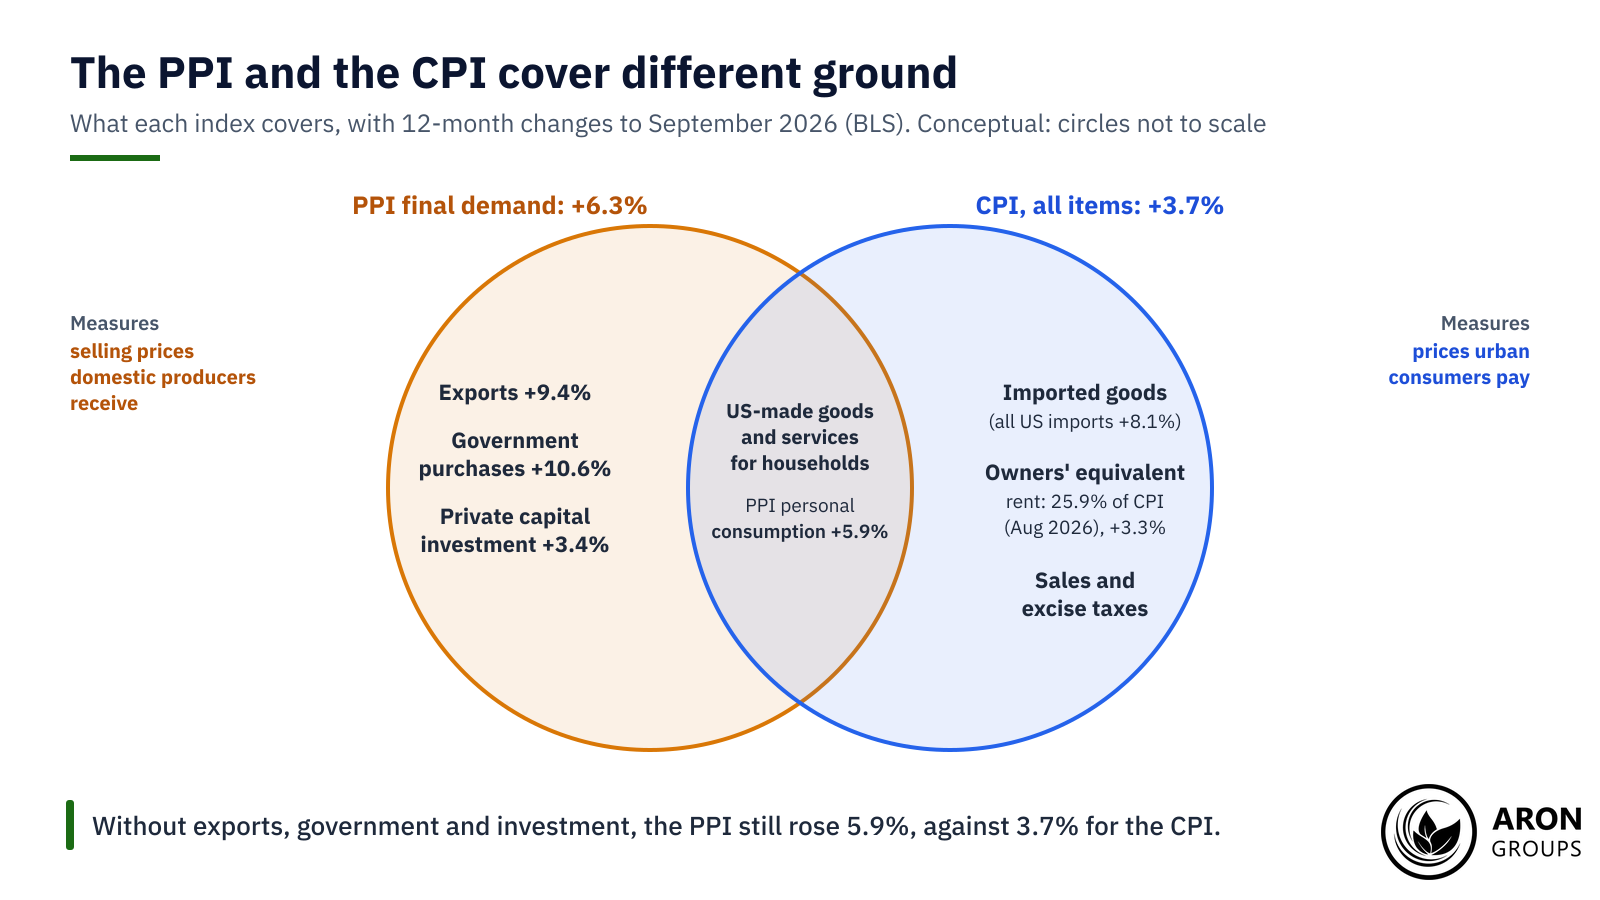
The core difference in PPI vs CPI is the point of view. CPI measures consumer prices, while PPI measures producer prices. The CPI tracks what urban consumers pay; the PPI tracks what domestic producers receive. The PPI excludes imports, while the CPI includes them.
| Feature | Producer Price Index (PPI) | Consumer Price Index (CPI) |
|---|---|---|
| Whose prices | Selling prices domestic producers receive | Prices urban consumers pay |
| Where measured | First commercial transaction for many products and some services | Retail purchase |
| Buyers covered | Personal consumption, capital investment, government and exports | Urban consumers |
| Imports | Excluded | Included |
| Sales and excise taxes | Excluded | Included |
| Owners' equivalent rent | Not covered | Included: 25.9% of the index (Aug 2026) |
| Headline, September 2026 | Final demand +1.3% month, +6.3% 12 months | All items +0.6% month, +3.7% 12 months |
| Core, 12 months to September 2026 | +5.0% on both core measures | +2.6% (all items less food and energy) |
| Publisher and timing | BLS, monthly; September data on 15 Oct 2026 | BLS, monthly; September data on 14 Oct 2026 |
PPI vs CPI at a glance. Sources: BLS releases and methodology pages.
The PPI’s wider scope explains only part of the gap. PPI final demand also prices exports, government purchases and private capital investment, which rose 9.4%, 10.6% and 3.4% over 12 months. Without them, the BLS index for personal consumption still rose 5.9%.
CPI vs PPI: Why the Two Rates Differ in 2026
In September 2026 the CPI vs PPI gap was 2.6 points, and the core gap was 2.4 points: 5.0% against 2.6%. Energy also differs: it weighed 6.4% in the CPI and 5.1% in PPI final demand in December 2025. But about half the CPI’s energy weight was energy services such as electricity and piped gas, which rose 4.6%. PPI final demand energy, up 35.4%, includes energy bought by government and for export, which rose 53.7% and 64.5%.
Other differences pull both ways. Shelter, 35.6% of the CPI in December 2025, rose 3.2%, and the PPI does not cover owners’ equivalent rent. Imports are in the CPI but not the PPI. The BLS import price index rose 8.1% in the year to September, with fuel up 34.5%. The gap reflects different baskets, weights and points of measurement rather than a single cause.
Does the PPI Lead the CPI? What the Research Shows
The PPI is often called a leading indicator of CPI; the evidence says it can lead, not that it reliably does. Todd Clark tested the idea in “Do Producer Prices Lead Consumer Prices?”, a 1995 Kansas City Fed Economic Review article. He found that “PPI changes sometimes help predict CPI changes but fail to do so systematically”. One reason, he noted, is that “the PPI measures only domestic prices, while the CPI includes the prices of both domestic and imported goods”.
Later work finds a firmer, but still partial, link. John O’Trakoun and David Ramachandran tested it in “Building A Pipeline Between Producer and Consumer Prices”, a September 2022 Richmond Fed Economic Brief. They modelled intermediate demand prices against the PCE price index. They found that “levels and growth rates of producer prices have a statistically significant impact on consumer price inflation”. PCE inflation was correlated, above 0.3, with PPI readings up to seven months earlier, but most strongly with the same month’s, at about 0.46.
Firm-level evidence points the same way: firms pass on rising input costs with a lag, and only in part. In Bank of Italy surveys analysed in BIS Working Paper No 1305 (November 2025), Italian firms expected roughly 45% pass-through within 12 months. Realised prices moved less, and responses were more than twice as large for cost increases as for decreases.
Survey gauges arrive earlier still. The ISM manufacturing Prices Index, often called ISM prices paid, registered 77.9% in September 2026, up from 71.1% in August. It is a diffusion index, not a price index: it shows how widespread price rises are, not how large.
The 2022 Peaks and the 2026 Energy Shock
On an unadjusted 12-month basis, PPI final demand peaked at 11.7% in March 2022. It was still 11.2% in June, when the CPI peaked at 9.1%. Producer prices then fell faster: by June 2023 the PPI was up 0.3% on a year earlier, while the CPI was still up 3.0%.
In 2026 the two rose in the same months, after the war involving Iran began on 28 February 2026. From February to May, the PPI’s 12-month rate climbed from 3.4% to 5.9% and the CPI’s from 2.4% to 4.2%.
The Link to Cost-Push Inflation
The PPI connects to cost-push inflation through producer costs: rising production costs push prices up, and intermediate demand shows those costs early. In the year to September 2026, unprocessed energy materials rose 49.0% and processed fuels and lubricants 44.7%, against 6.3% for final demand.
Why the PPI Moves Markets
Traders watch the PPI release for early clues about CPI and the Fed, and for details that feed the PCE price index. The Fed’s 2% target is set on PCE inflation, which BEA builds mostly from CPI data. Gadi Barlevy and co-authors map the link in “Flash PCE: A Mid-Month Inflation Nowcast”, a September 2026 Chicago Fed Letter. They write that PPI data play “a smaller but important role” in the PCE index. Their examples include physician services, hospitals and home health care, where third parties pay on households’ behalf.
Analysts therefore update their core PCE estimates after the PPI. On 15 October 2026, economists estimated that September core PCE rose 0.35% in the month, Reuters reported. BEA’s 30 September 2026 update dropped a PPI for portfolio management in consumer spending but added legal-services PPIs. The Fed’s next meeting, on 8 to 9 December 2026, brings new projections and a new Fed dot plot.
Release Day: Surprise Versus Forecast
Prices tend to react to the surprise against the consensus forecast, which the Citi Economic Surprise Index sums up across releases. In a New York Fed study of 1993 to 1994 bond trading, six of the sharpest price shocks followed PPI reports, two CPI reports. The PPI was then released before the CPI.
A BIS study of 1999 data found the CPI and PPI announcements each tied to three of the 25 largest Treasury price moves. Positive inflation surprises cut bond prices significantly, which means higher yields. A 2018 CFTC staff study found news and data releases were large drivers of sharp price movements in many futures contracts.
The 15 October 2026 release shows the limits. The PPI rose 1.3% against a 0.5% Reuters poll forecast, yet Reuters reported that the dollar eased and Treasury yields slipped. The CPI had come out a day earlier, and retail sales data came out alongside the PPI.
The Dollar, Bond Yields and Gold
A hotter than expected PPI can strengthen the dollar and pressure gold, but as a tendency rather than a rule. A softer print tends to do the opposite. Higher producer prices hint at higher CPI and PCE readings, so markets tend to price a tighter Fed. Treasury yields tend to rise, and higher US rates can support the dollar, one factor in how currency strength is determined. Gold pays no interest, so rising real yields tend to weigh on it, a link also seen with CPI and gold.
Other forces can outweigh a single release: gold also responds to geopolitics, as the history of war and the gold price shows.
Q: Does a hot PPI always mean a hot CPI the next month?
A: No. The link is loose and changes over time. In 2026 the PPI and CPI rose in the same months, as energy prices hit both at once.
The Honest Limits of the PPI
The PPI is a partial and noisy guide to consumer inflation. Unlike the CPI, the BLS notes, the PPI does not have complete coverage of services. Monthly data are also revised: August’s rise, first reported as 0.4%, stood at 0.5% in the September release.
Pipeline models can mislead. In September 2022, the Richmond Fed brief projected PCE inflation “ending 2023 at 4.8 percent”. The PCE price index rose 2.6% in the year to December 2023 as first published, and 2.9% after revisions to 30 September 2026. The authors had warned that “the model does not consider the effects of tightening monetary policy”.
Measurement has blind spots too. The BLS adjusts for smaller pack sizes, a form of hidden inflation, but quality changes are harder to measure. Execution has limits too: an SEC investor bulletin warns that a triggered stop order’s fill can deviate significantly from the stop price.
Key Point
The PPI measures prices at the producer's door and can lead the CPI. Its pass-through is partial, delayed and uneven, so it is one signal among several.

Where Aron Groups Fits
Aron Groups does not offer bonds, but the PPI can move markets it does offer as CFDs on MetaTrader 5. They include USD pairs such as EURUSD and USDJPY, gold on XAU/USD and index CFDs such as SPXUSD and NDXUSD. On ECN accounts, which use market execution with floating spreads, spreads can widen around 8:30 a.m. Eastern releases, and prices can gap.
The PPI’s effect on these markets is a tendency, not a rule, and leverage magnifies losses as well as gains. A stop-loss is not a guaranteed exit, because a gap can fill it beyond its price. Aron’s economic calendar tracks economic releases, including inflation data. A Nano account trades from 0.01 nano lots, and a demo account allows practice with virtual funds.
Conclusion
The producer price index tracks inflation from the seller’s side, in the prices producers receive. In September 2026 it ran well ahead of consumer inflation, at 6.3% against 3.7%.
The PPI can lead the CPI, though loosely, as 2022 showed. But the pass-through from PPI to CPI is neither immediate nor one for one. The October report, due on 13 November 2026, will show whether producer price pressure is building or fading.
Frequently Asked Questions
Short answers to common questions about the producer price index.
What is PPI in economics?
In economics, the PPI measures inflation from the seller’s side. Economists use it to turn producers’ revenues into real output and to gauge price pressure in supply chains.
Is the PPI a leading indicator of the CPI?
Sometimes. Clark’s 1995 study found it helped predict the CPI in some periods but not systematically. In 2022, PPI final demand peaked three months before the CPI.
What is the difference between headline and core PPI?
Headline PPI is final demand, which rose 6.3% in the year to September 2026. Core measures strip out foods and energy, and in one version trade services too; both rose 5.0%.
When is the next PPI release?
The October 2026 PPI is due at 8:30 a.m. Eastern on Friday 13 November 2026, three days after the October CPI.